Recognize Break and Retest of price level
Hello, perhaps this article will help you

- www.mql5.com
Hi fellows,
I wanna build a trading boot which recognize a break and retest pattern of support or resistance line.
The support or resistance level is known by the bot, it will be a parameter given by the user of the bot. The bot DO NOT have to detect this support or resistance level.
See picture...The only thing the bot has to do is to recognize if on this support or resistance happens a break and retest pattern and send a trade.
How I could develop the logic to recognize such a pattern or are there any article or helper classes which can do that for me?
Would be glad for any hint or ressource.
Thanks!
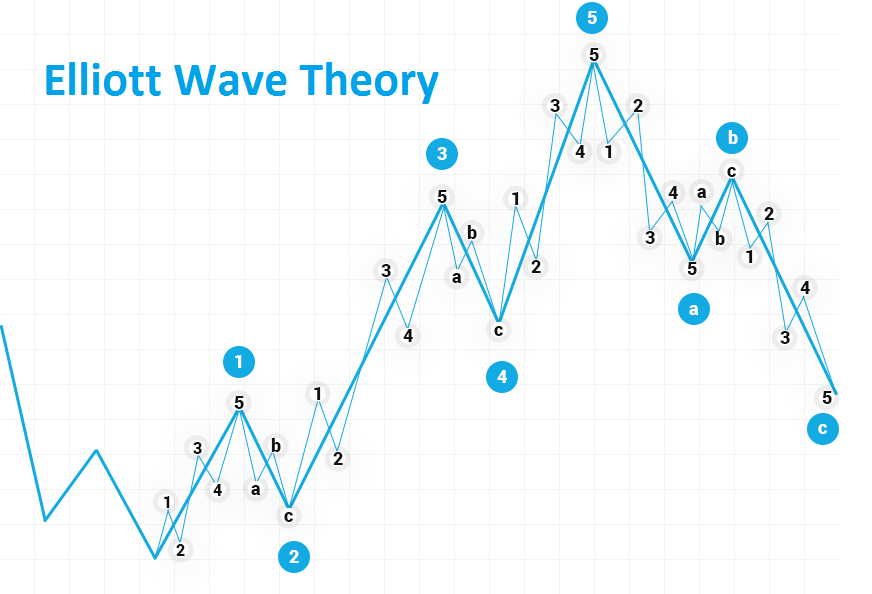
You call "retest" the pullback of a wave, its amplitude isn't always enough to "retest" and sometimes it even reverses ...
Maturity teachs to get ready to close some deals in loss, you won't never ever avoid it, you have to accept it : even E.W model is a theory, not a gospel.
Forum on trading, automated trading systems and testing trading strategies
Market Condition Evaluation based on standard indicators in Metatrader 5
Sergey Golubev, 2013.01.31 16:30
Why false breakout? Look at the image (this is Merrill's patterns for downtrend):

and look at GBPUSD M1 chart for now:
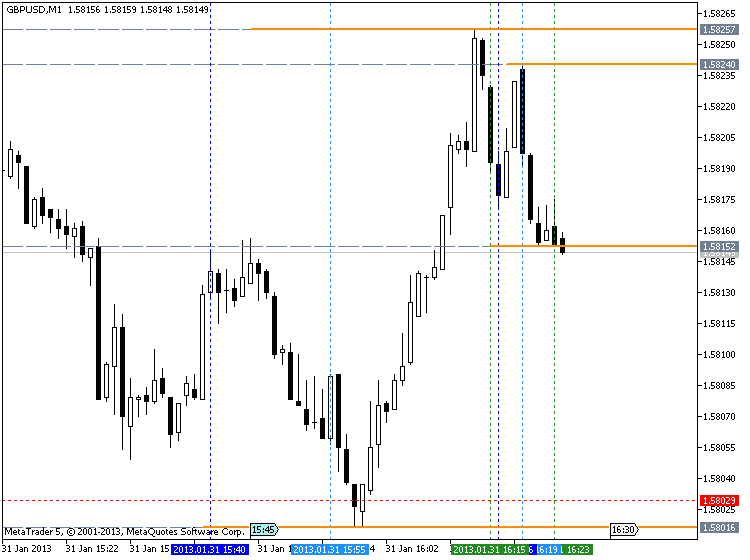
So, the pattern on GBPUSD chart is same as M3 Merrill, right? And the evolution of this M3 pattern was on the following way: M8 - M4 - M3. That is why it was false breakout.
Forum on trading, automated trading systems and testing trading strategies
Market Condition Evaluation based on standard indicators in Metatrader 5
Sergey Golubev, 2013.01.31 16:51
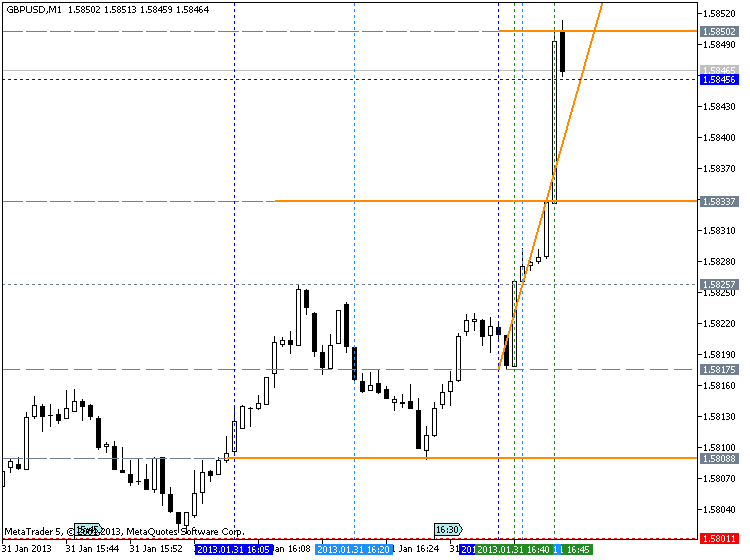
Merrill's patterns for uptrend:

and it looks like W10 with evolution as W4 - W5 - W10:
Forum on trading, automated trading systems and testing trading strategies
Sergey Golubev, 2017.04.17 20:05
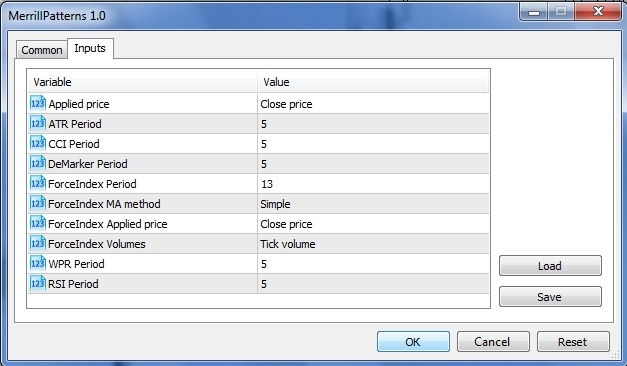
Just to remind about interesting indicator: FivePattern - indicator for MetaTrader 5
This is the indicator to show М & W Wave Patterns by Merrill and support/resistance levels.
===============
About Merill Patterns:
This is Merrill's patterns for downtrend:
Merrill's patterns for uptrend:
===============
And this is some other patterns:
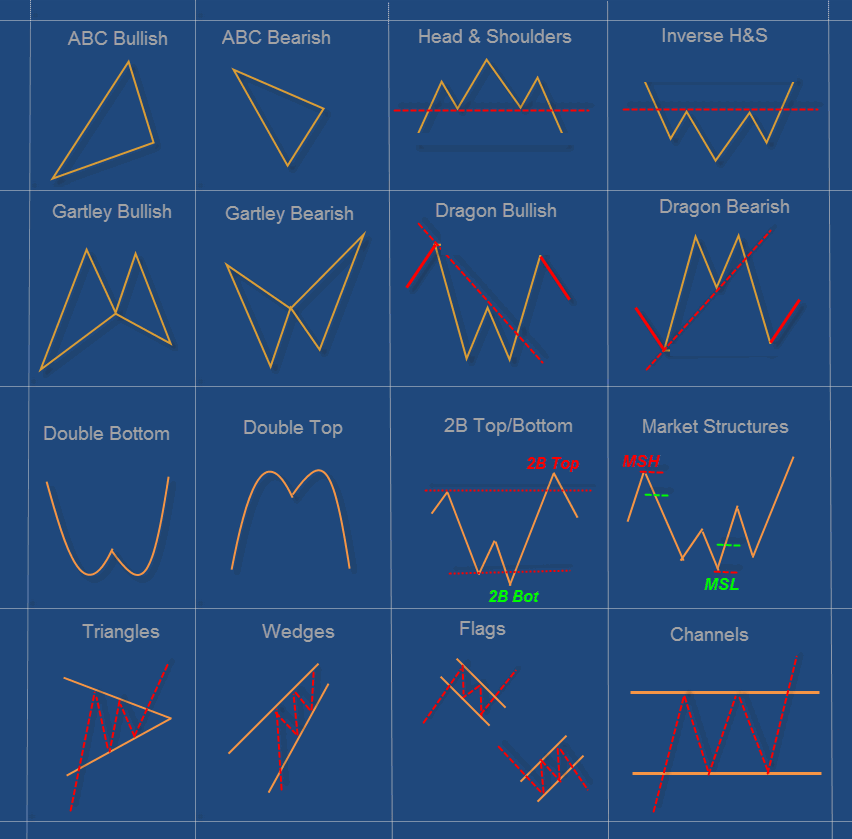
Merrill patterns - the article
And this is the indicator for those patterns - FivePattern - indicator for MetaTrader 5
I didn't know that one ! Gonna read about, thanks for sharing.
- Free trading apps
- Over 8,000 signals for copying
- Economic news for exploring financial markets
You agree to website policy and terms of use
Hi fellows,
I wanna build a trading boot which recognize a break and retest pattern of support or resistance line.
The support or resistance level is known by the bot, it will be a parameter given by the user of the bot. The bot DO NOT have to detect this support or resistance level.
See picture...The only thing the bot has to do is to recognize if on this support or resistance happens a break and retest pattern and send a trade.
How I could develop the logic to recognize such a pattern or are there any article or helper classes which can do that for me?
Would be glad for any hint or ressource.
Thanks!