

Any market — whether Forex, cryptocurrencies, or indices — follows the same fundamental principles of price movement.
These principles are exactly what the Owl Smart Levels indicator is built on. It is based on classic elements of market analysis: trend, wave structure, price extremes, and corrections.
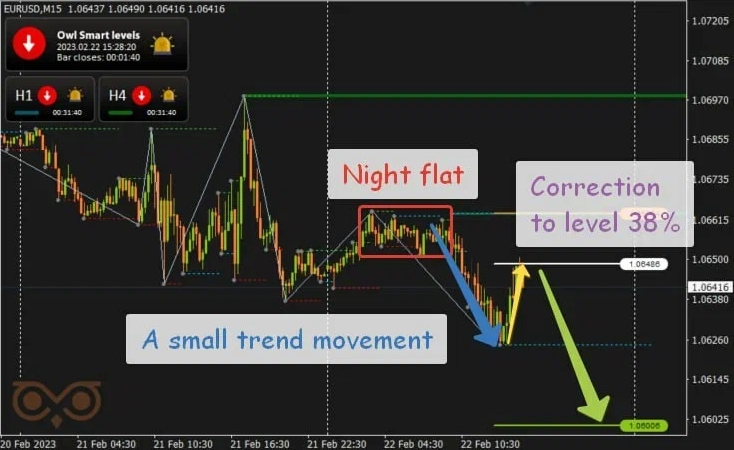
Fig. 1. Example of how the Owl Smart Levels indicator works
Trend as the Foundation of Market Movement
The first and most important principle is that the market moves in trends. If the price begins to consistently update its highs or lows, this indicates that the market is forming a trend.
A trend reflects the direction of capital flow and allows traders to trade with the market rather than against it. That is why most trading systems are built around the idea of following the trend.
In Owl Smart Levels, the direction is identified using the Valable ZigZag, which filters out minor fluctuations and highlights the main structure of the movement.
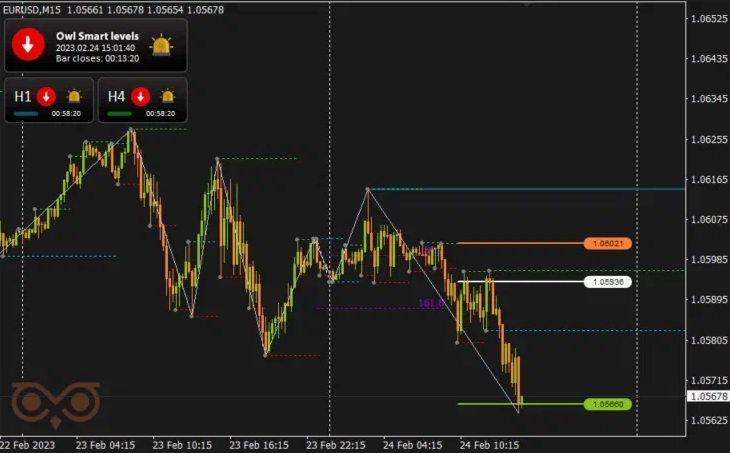
Fig. 2. Trend-following trade based on an Owl Smart Levels signal
Additionally, the indicator analyzes three timeframes simultaneously, allowing traders to evaluate the direction not only on the current chart but also on higher timeframes. The indicator panel displays the trend direction across the main and higher timeframes, helping to quickly understand the overall market picture.
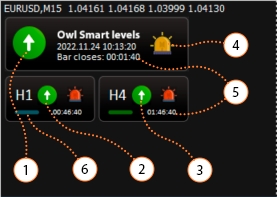
Fig. 3. Indicator panel showing trend direction
Wave Structure of Price Movement
The second fundamental principle is that price moves in waves. Even in a strong trend, movement consists of impulses and corrections.
After an impulse, a pullback almost always occurs. That is why understanding the structure of price movement helps identify more precise entry points.
Corrections are a natural part of any trend and often provide the best trading opportunities. You can learn more about how such pullbacks form in the article "How correction levels work in a trend".
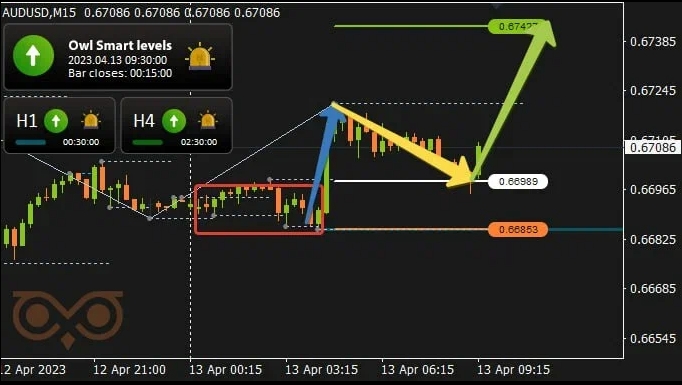
Fig. 4. How correction levels are used in the Owl Smart Levels indicator
Extremes and Market Structure
Another key element of the market is local highs and lows. These points form the structure of price movement.
When the price breaks previous extremes, it indicates trend continuation. If the structure begins to change, it may signal a possible shift in direction.
In Owl Smart Levels, modified fractals are used to identify these points, helping traders spot key levels on the chart.
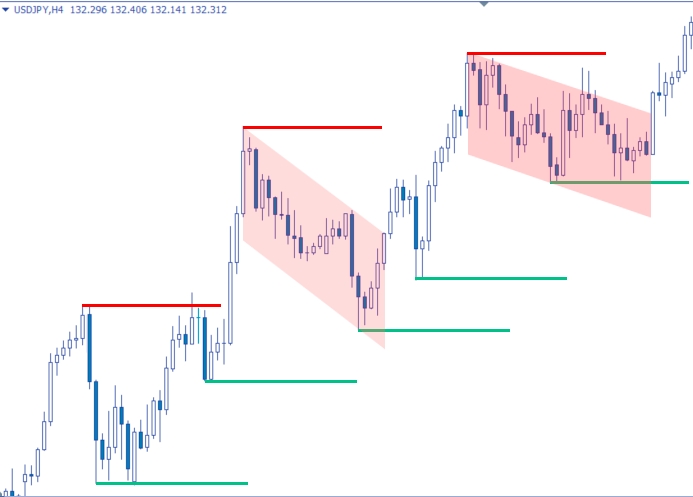
Fig. 5. Fractals in Owl Smart Levels used to identify key levels
Corrections and Entry Levels
Another important principle is that every movement includes corrections. These pullbacks often provide the most convenient entry points.
In the Owl system, Fibonacci grid is used to identify such zones. It is drawn between key fractals after a change in ZigZag direction.
When the price returns to correction levels, it creates an opportunity to open a position in the direction of the main trend.
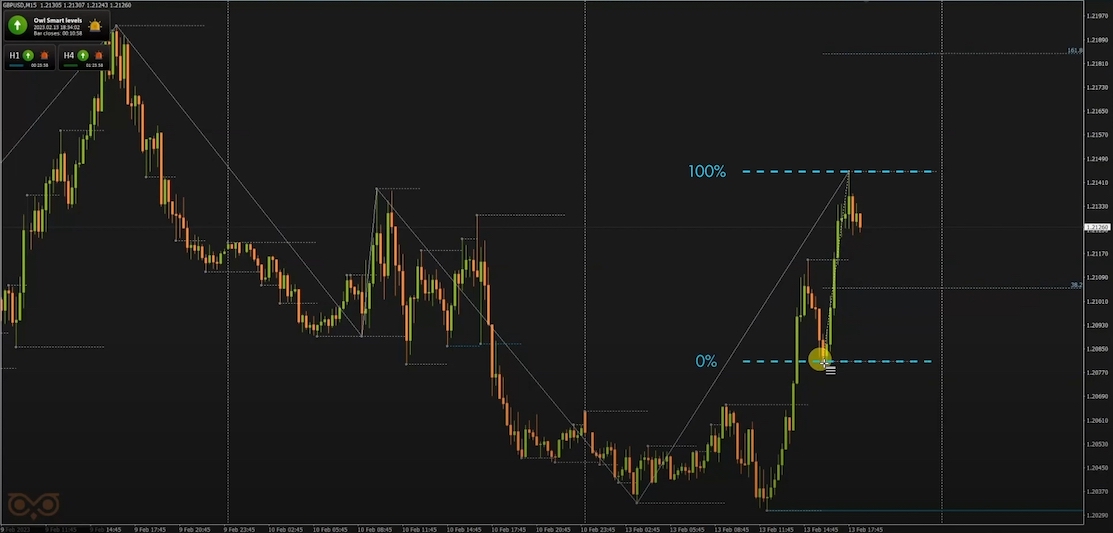
Fig. 6. Example of using Fibonacci grid
All this means that Owl Smart Levels does not attempt to find random signals in the market. Instead, the indicator combines several classic analysis tools — fractals, ZigZag, and Fibonacci levels — to help traders understand price structure and trade based on core market logic.
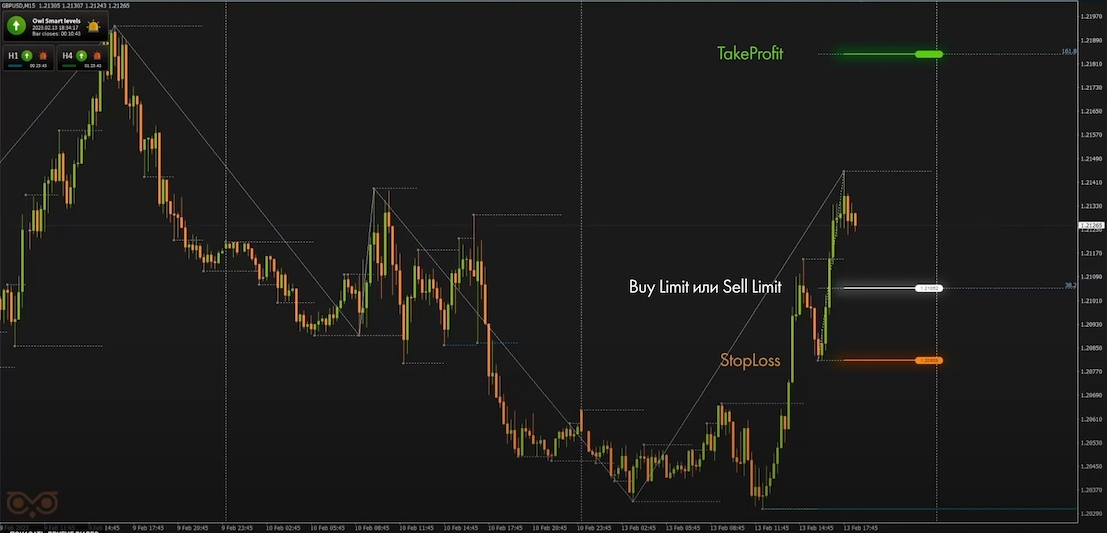
Fig. 7. Example of a trade signal from the Owl Smart Levels indicator
If you want to learn more about the Owl Smart Levels strategy itself and see real examples of how it works, I recommend checking out the following materials:
Recommended for reading
I'm Sergei Ermolov, follow me and don't miss more useful tools for profitable trading on the Forex market.


