
Review of trades of the Owl Smart Levels system for the week from April 20 to 24, 2026

Today I present you an overview of trades made using the Owl trading system - smart levels for the EURUSD, GBPUSD and AUDUSD currency pairs for the week from April 20 to 24, 2026. The report covers all trades generated by the system's signals, taking into account strict risk management and predefined entry and exit levels.
EURUSD review
The first signal on EURUSD was received on April 21 and was a strong one. In this case, the price formed a smooth downward directional movement, without sharp breaks or chaotic pullbacks. This type of structure makes the signal higher quality: the market shows the working direction in advance, while the entry point appears after a correction, allowing entry not during the impulse, but at a more favorable price.
After the signal appeared, a sell trade on EURUSD was opened, as the movement maintained a bearish character and met the system conditions. After opening the position, the market continued to follow the downward scenario, and the trade was closed at TakeProfit.
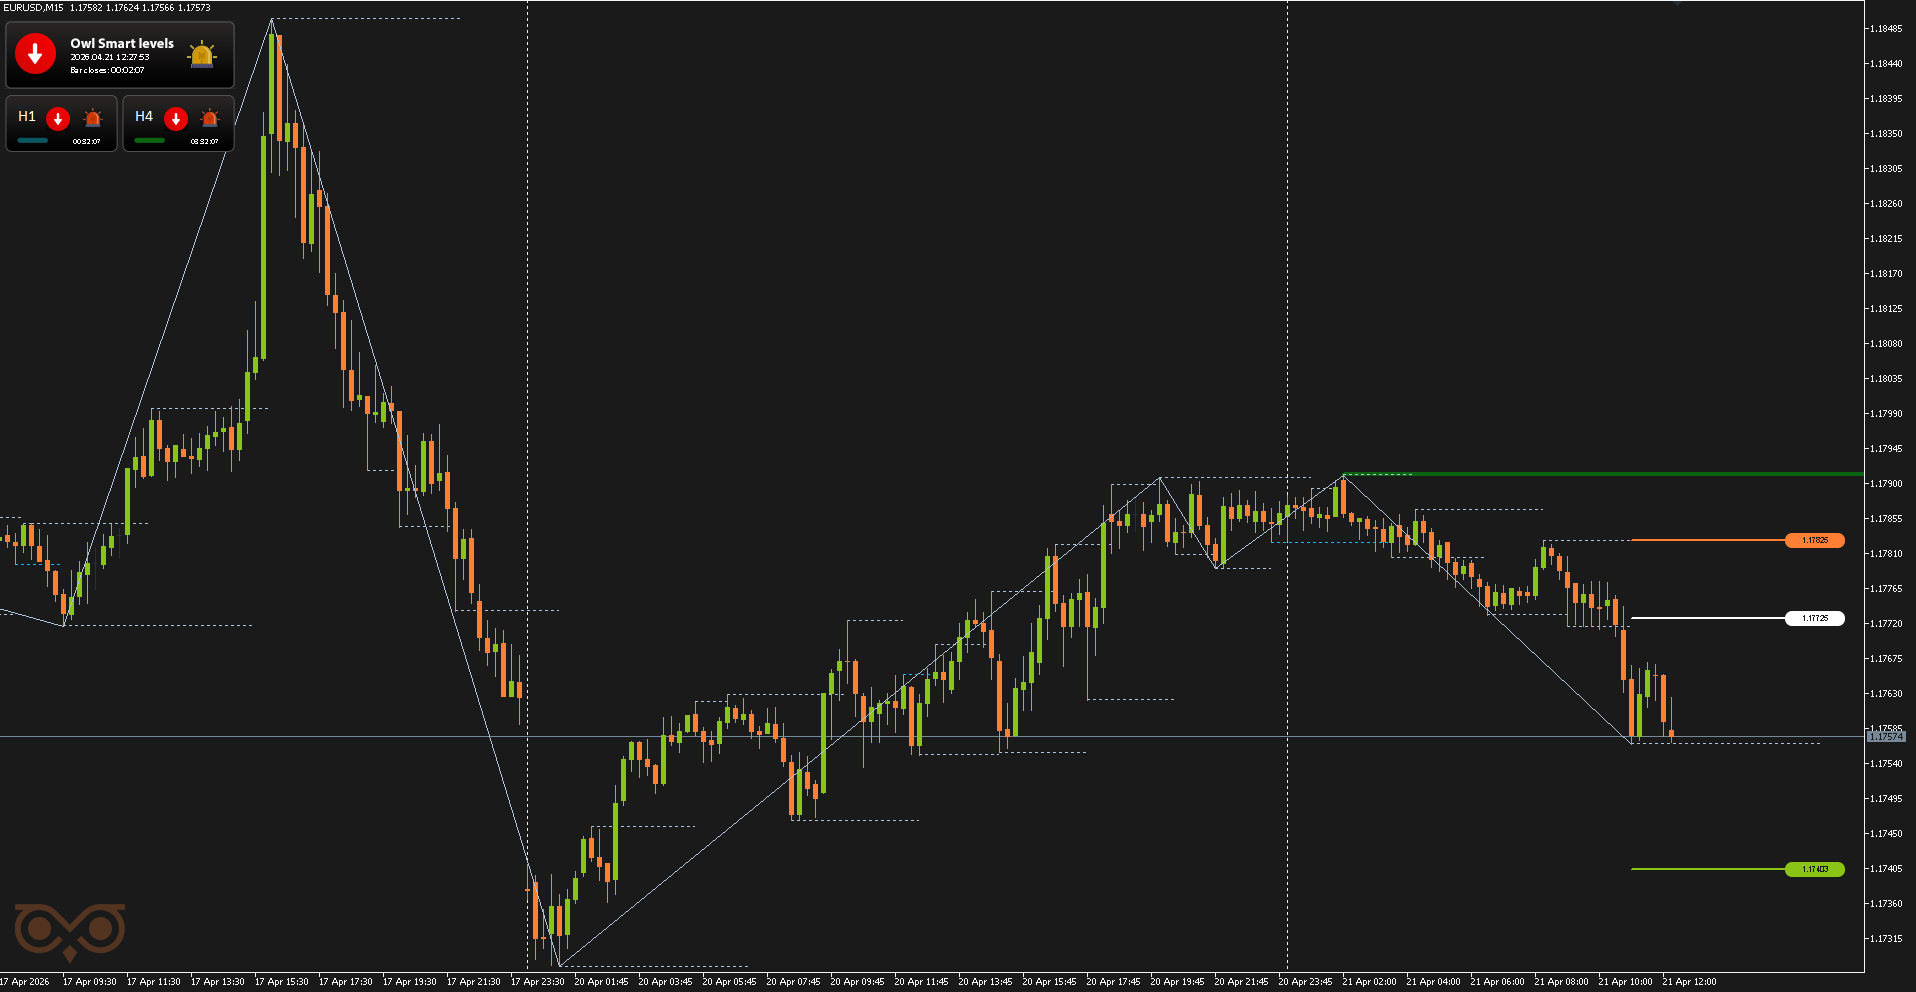
Fig. 1. EURUSD SELL, Lot = 15.00, OpenPrice = 1.17725, StopLoss = 1.17825, TakeProfit = 1.17403, Profit = +$4 830.00
The second signal on EURUSD was also received on the same day and was again strong. In this case, the signal formed near the H1 level, which increases its quality and makes the scenario more valid according to the system. When confirmation appears near a higher timeframe level, the structure becomes clearer: there is an important zone from which the market can react and continue the chosen direction.
After the signal appeared, a sell trade on EURUSD was opened, as the price maintained a bearish context and showed no signs of a full upward reversal. After opening the position, the price continued to follow the downward scenario, and the trade was again closed at TakeProfit.
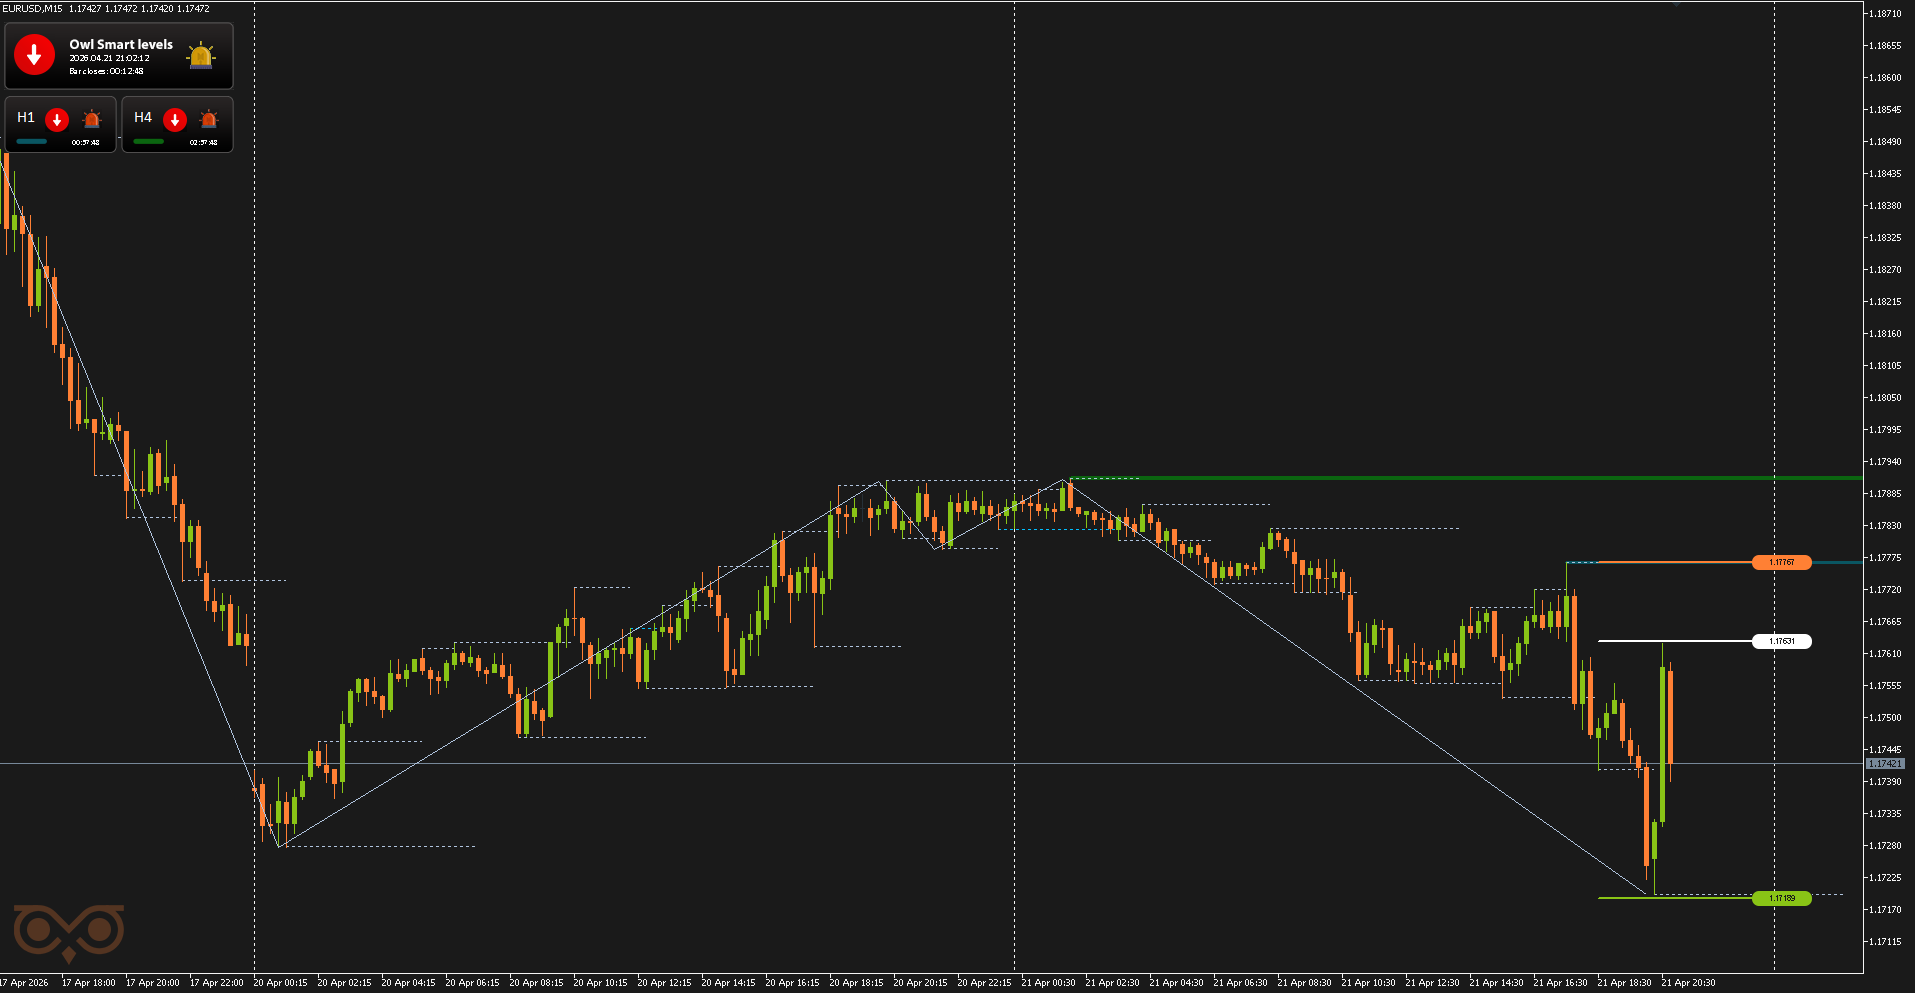
Fig. 2. EURUSD SELL, Lot = 11.03, OpenPrice = 1.17631, StopLoss = 1.17767, TakeProfit = 1.17189, Profit = +$4 875.26

Indicator Owl Smart Levels MT5 | MT4 Version
The third signal on EURUSD was received on April 22, but it belonged to the category of low-probability signals. In this case, the market did not show sufficient directional movement after the signal formation, so the idea did not receive the necessary confirmation to open a position.
Although the signal appeared in a valid zone, the movement structure remained weak: the price did not provide a confident continuation, and the movement looked compressed and uncertain. For this reason, no trade was opened based on this signal.
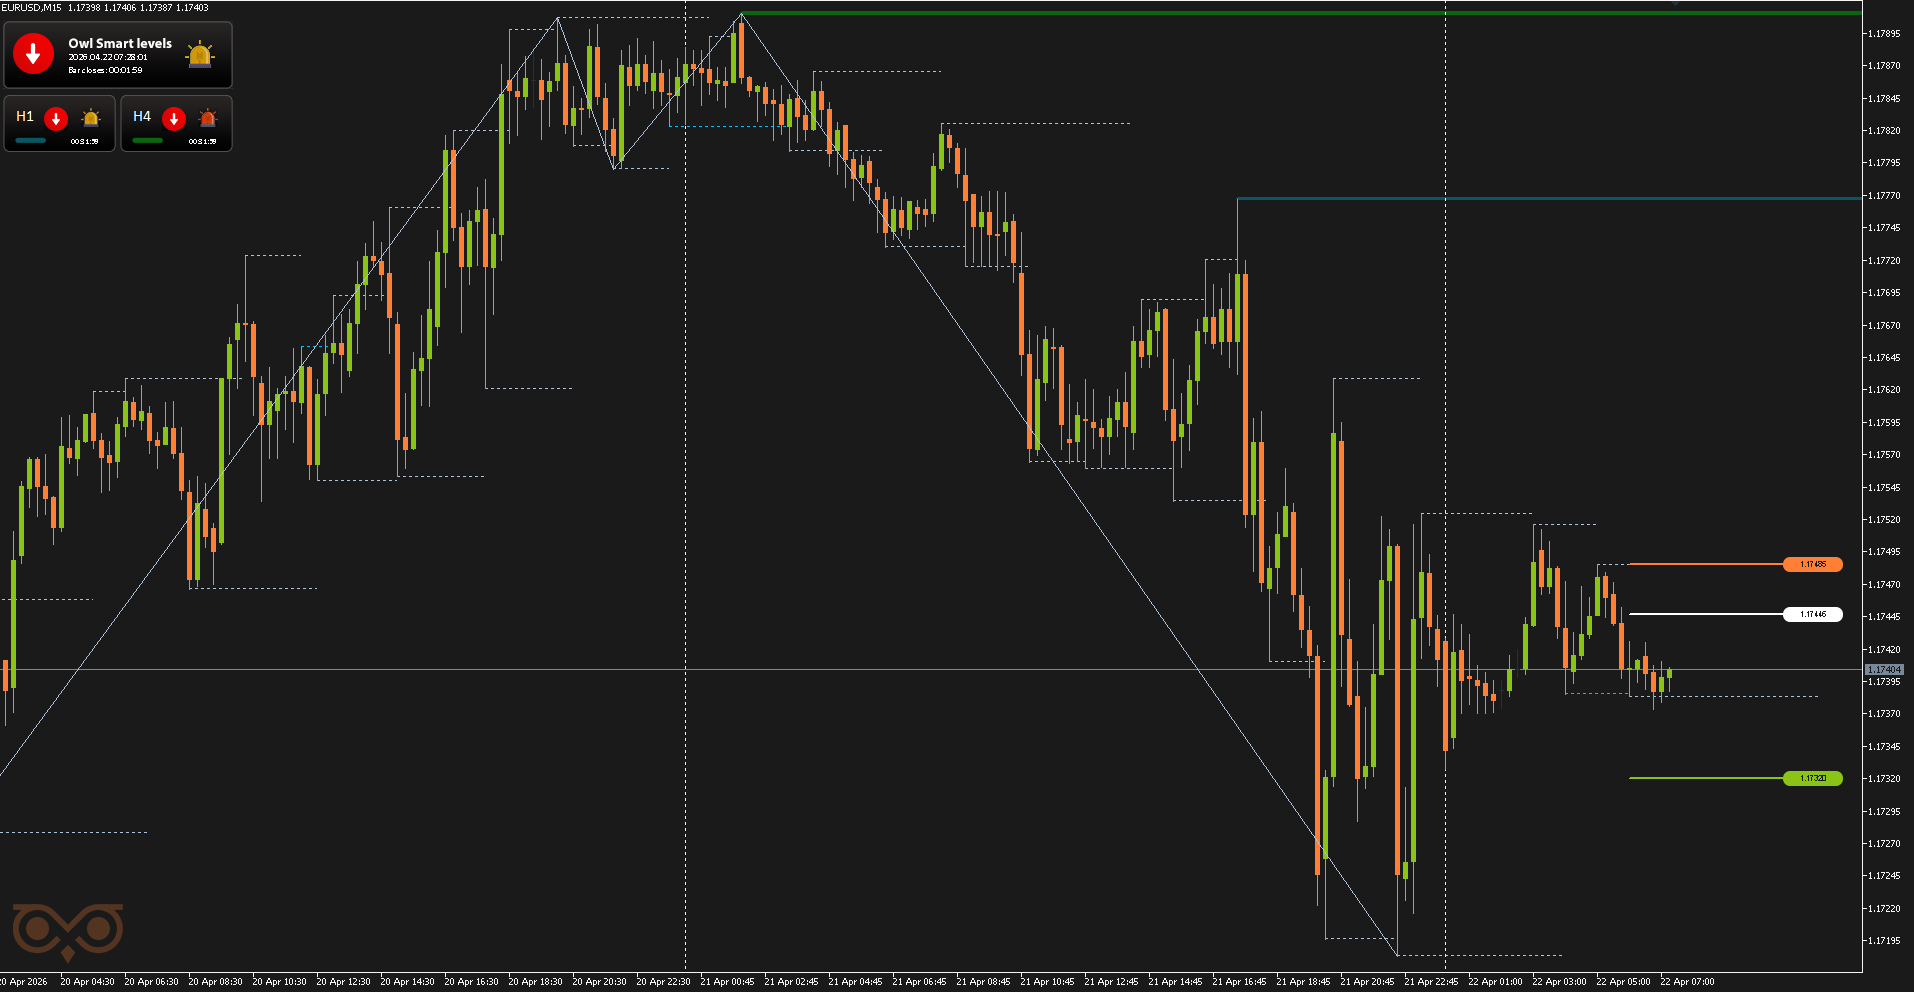
Fig. 3. Low-probability signal — the market did not show sufficient movement to open a trade
The fourth signal on EURUSD was received on April 23 and was a strong one. The key factor here was the signal forming near the H1 level. The price was already in a bearish structure, and the pullback to the higher timeframe level created a logical area to consider a continuation downward. This made the signal valid: it appeared not at a random point on the chart, but in a zone where sellers could take initiative again.
After the signal appeared, a sell trade on EURUSD was opened. The scenario implied further downside continuation after a reaction from the H1 area; however, this time the market did not provide the expected continuation. Instead of moving downward, the price reversed against the position, and the trade was closed at StopLoss.
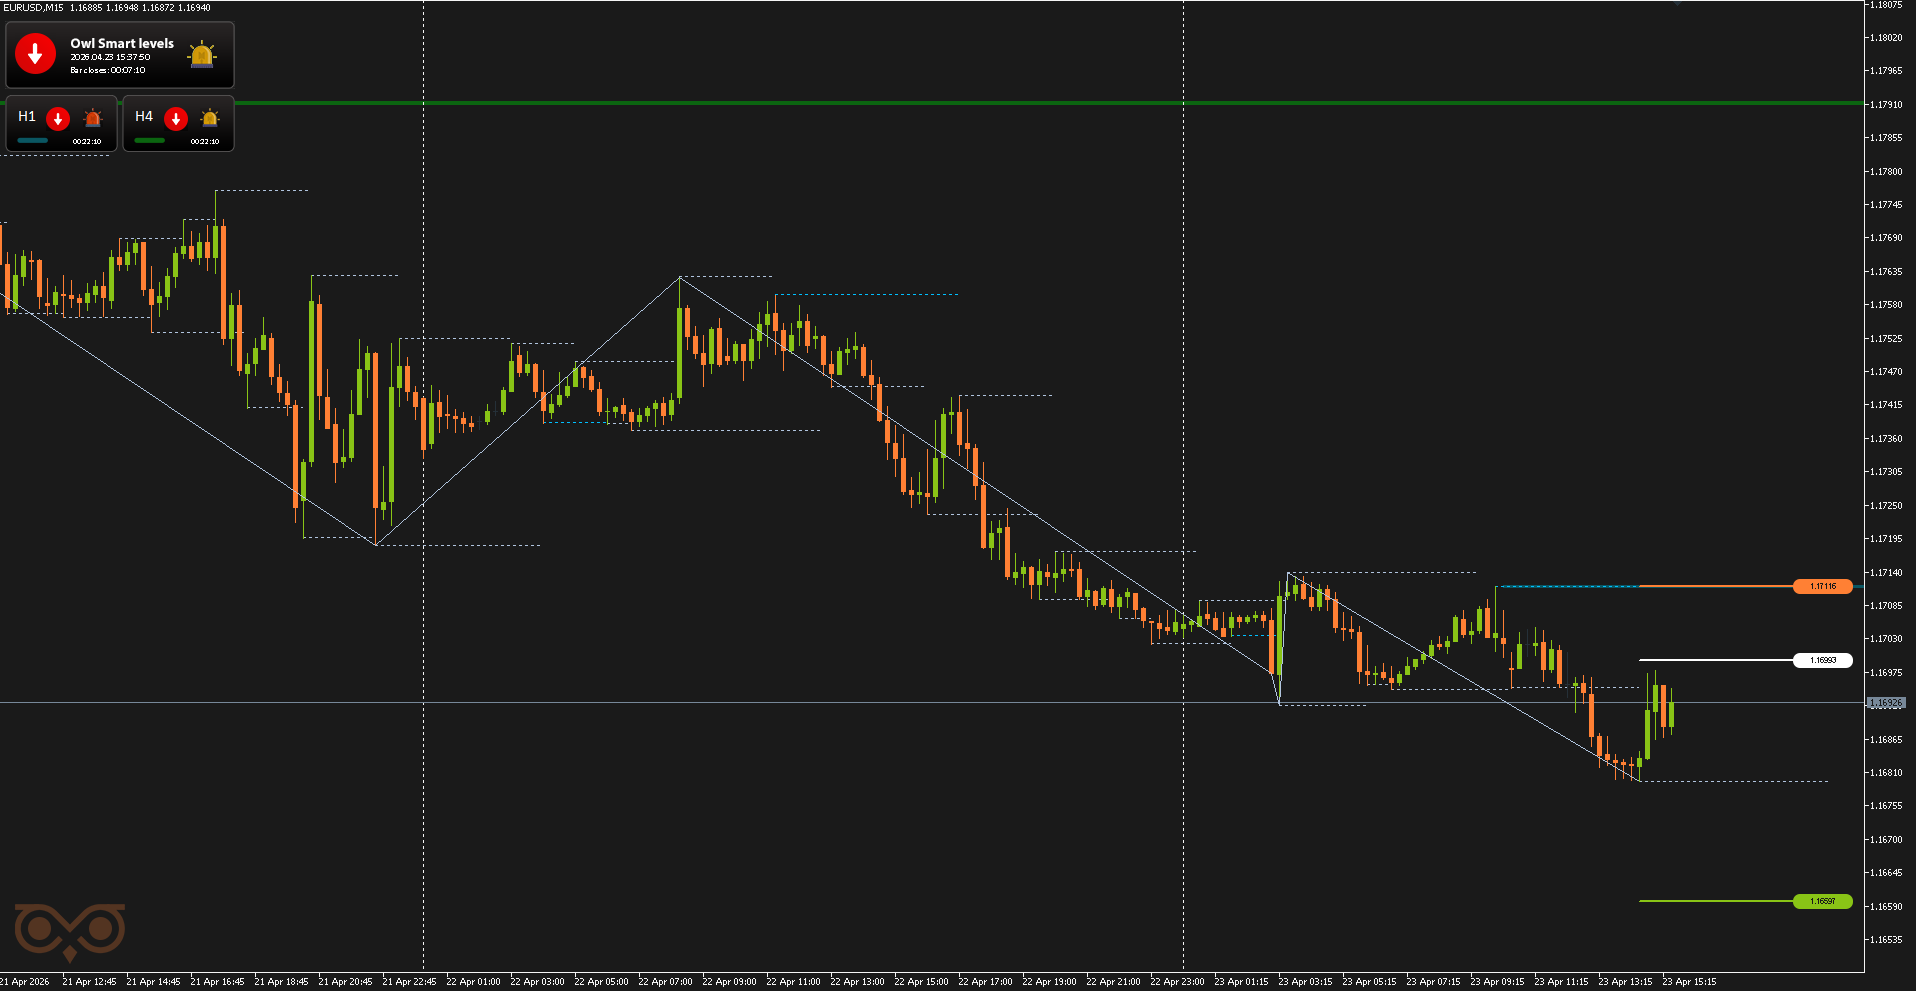
Fig. 4. EURUSD SELL, Lot = 12.20, OpenPrice = 1.16993, StopLoss = 1.17116, TakeProfit = 1.16597, Profit = -$1 500.00
The fifth signal on EURUSD was received on April 24 and was again strong. Here, opening near the H1 level once again played an important role. In this case, the signal looked strong not only due to its proximity to H1, but also because the price was in a zone where sellers could continue the movement after a local correction.
However, the market again did not provide a clean continuation in the direction of the signal. After opening the position, the price moved against the scenario, and the trade was closed at StopLoss. It is important to note that after the previous StopLoss, this trade was opened with an increased risk of 1.75% of the deposit.
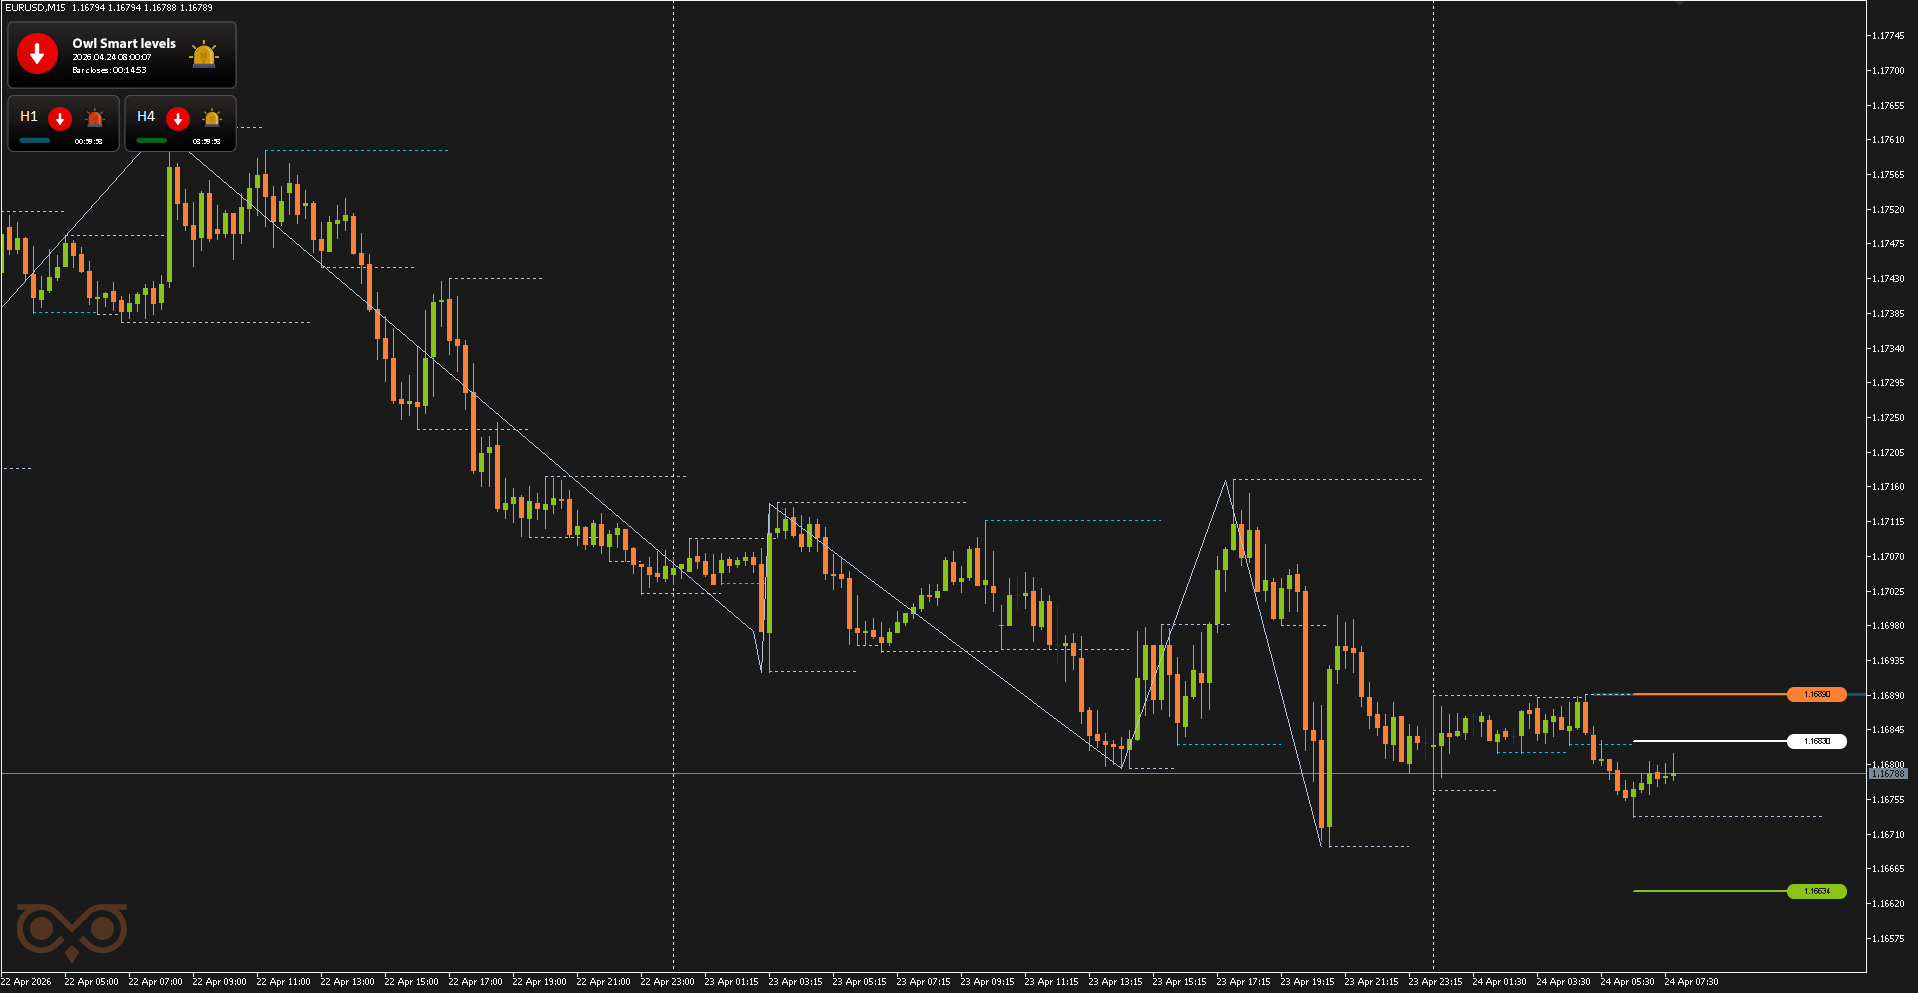
Fig. 5. EURUSD SELL, Lot = 29.17, OpenPrice = 1.16830, StopLoss = 1.16890, TakeProfit = 1.16574, Profit = -$1 750.00
GBPUSD review
The first signal on GBPUSD was received on April 21 and was a strong one. In this case, the signal belongs to the smooth directional movement model: the price formed a clear downward shift in advance, then made a pullback and returned to the working area for entry. Such a signal looks high-quality because the market was not in a chaotic sideways movement, but was already showing a direction that could be considered for continuation.
After the signal appeared, a sell trade on GBPUSD was opened. The main idea was to continue the downward movement after the pullback, and this time the market followed the scenario well. After opening the position, the price continued to move downward, and the trade was closed at TakeProfit.
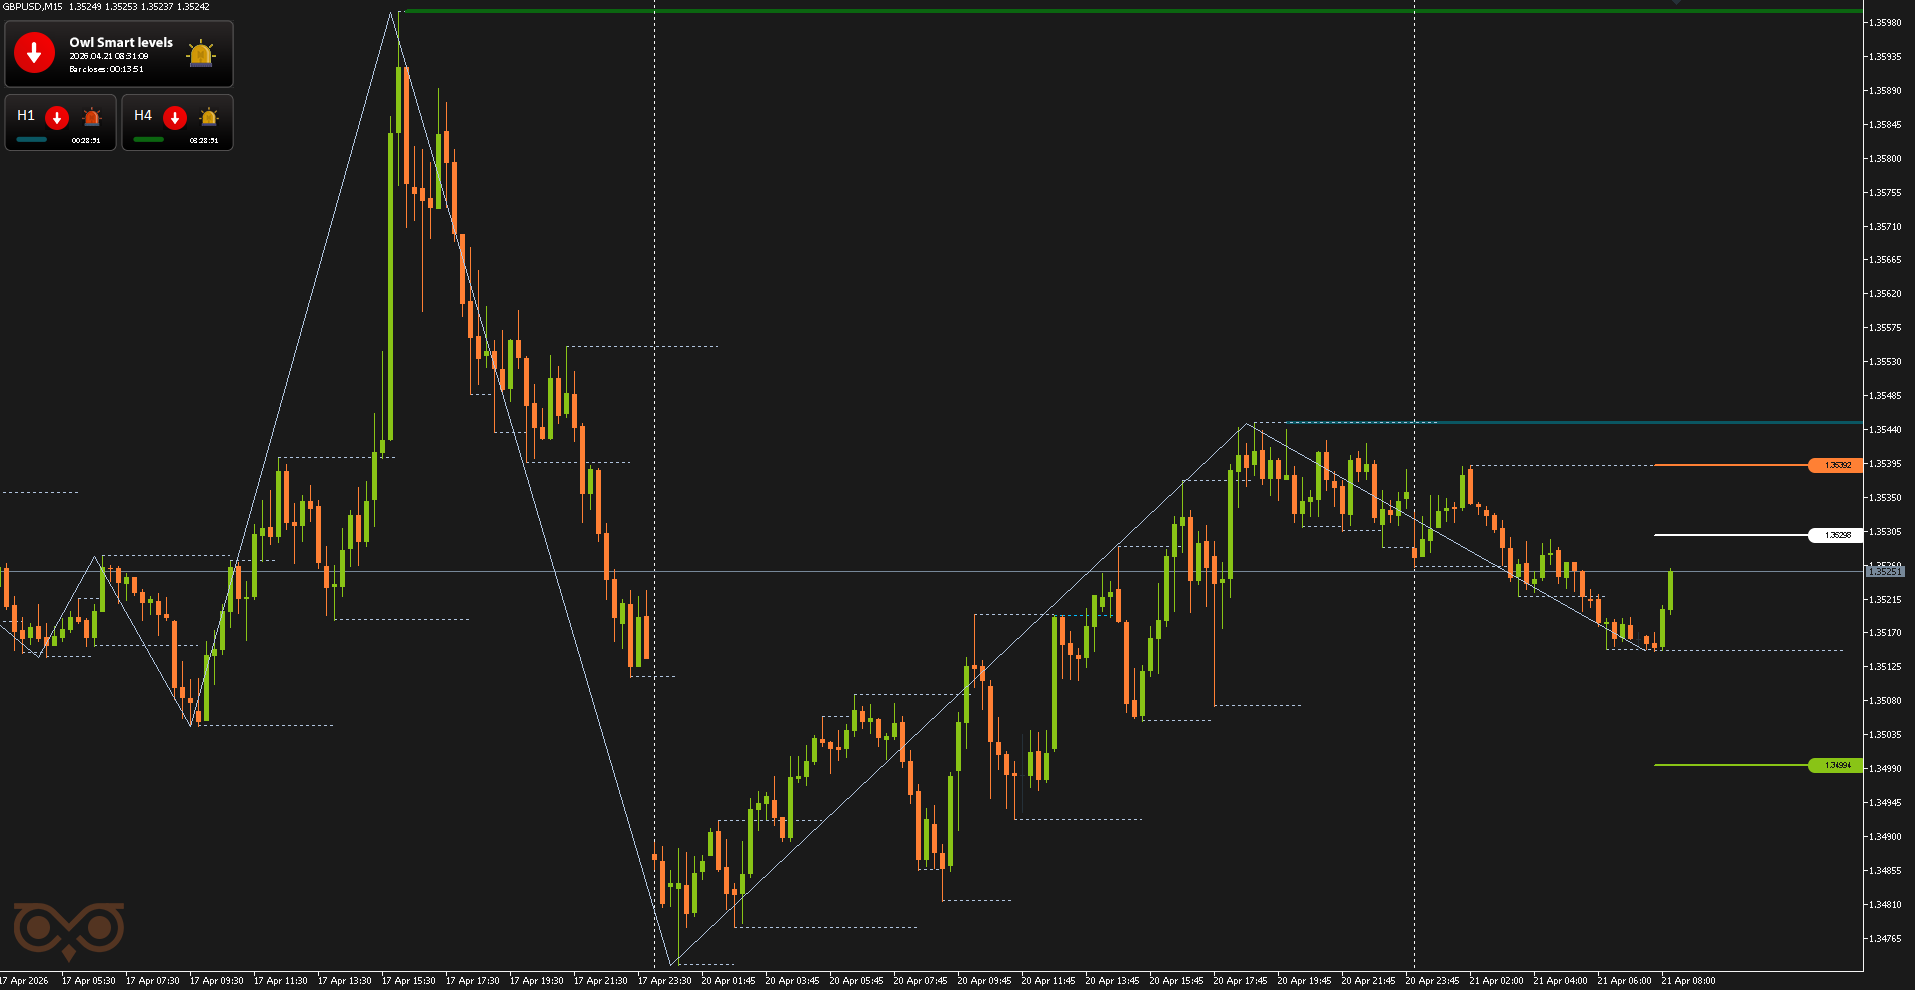
Fig. 6. GBPUSD SELL, Lot = 15.62, OpenPrice = 1.35298, StopLoss = 1.35392, TakeProfit = 1.34994, Profit = +$4 551.84
DON'T MISS THE MAY HOLIDAY SALE!!!

The second signal on GBPUSD was received on the same day and was again strong. In this case, the signal formed near the H1 level, so the overall scenario looked quite solid: the price approached an important higher timeframe area, after which there was an opportunity to consider a continuation of the downward movement.
However, this signal was deliberately ignored. At that moment, a trade on EURUSD based on similar logic and the same system principles was already open, so opening an additional position with an identical market scenario would have been unnecessary risk duplication. Despite the quality of the signal, priority was given to the already active trade.
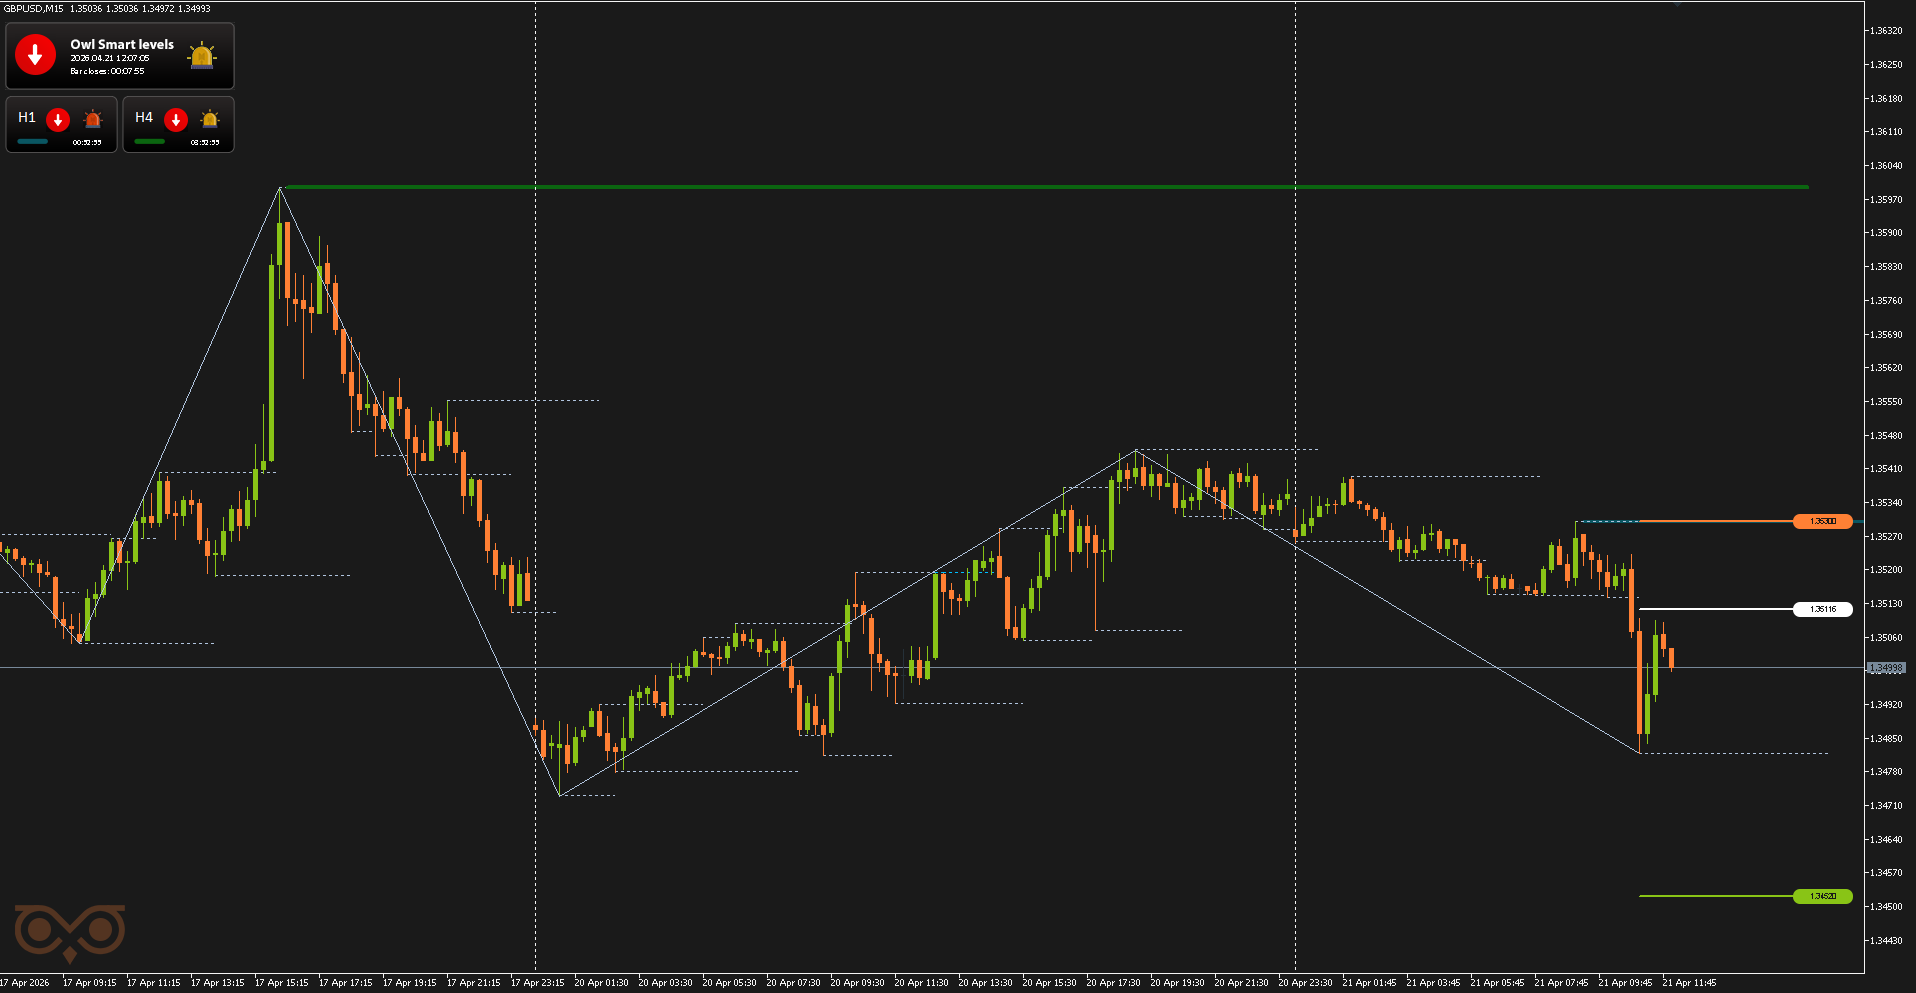
Fig. 7. Strong signal — entry near the H1 level, but the trade was deliberately skipped
The third signal on GBPUSD was received on April 22 and was a strong one. This time, the entry point was also formed near the H1 level, which made the scenario look more confident according to the system. When a signal appears near a higher timeframe level, the trade gets additional confirmation: the market approaches an important area, and the entry is built not just within a local movement, but from a more significant zone.
After the signal appeared, a sell trade on GBPUSD was opened, as the overall structure suggested a continuation of the decline. However, this time the market failed to develop the expected movement. After opening the position, the price moved against the trade, and eventually the position was closed at StopLoss.
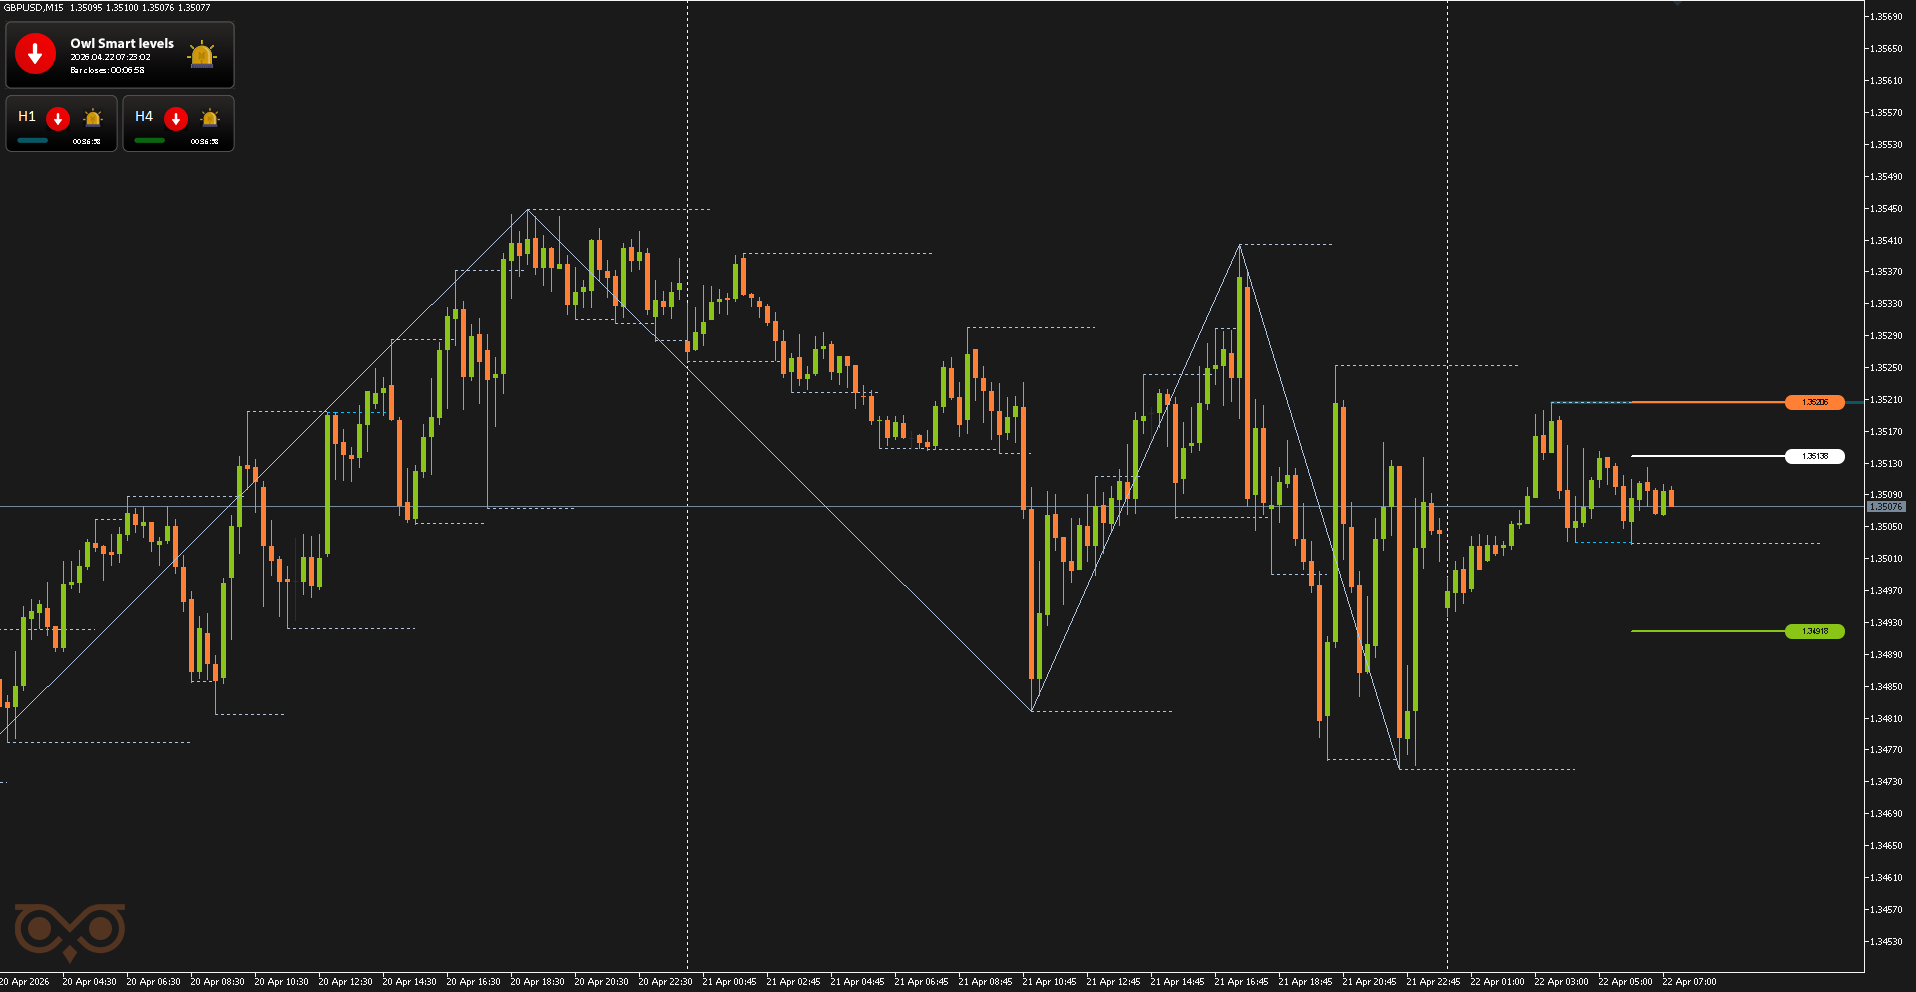
Fig. 8. GBPUSD SELL, Lot = 21.74, OpenPrice = 1.35136, StopLoss = 1.35205, TakeProfit = 1.34918, Profit = -$1 500.00
The fourth signal on GBPUSD was received on April 24 and was a strong one. The signal again appeared near the H1 level, so in terms of quality it matched the system’s valid scenario.
However, no trade was opened based on this signal. The reason was not the quality of the signal itself, but risk management: at that moment, a position on EURUSD based on the same system principles was already open. Opening a second trade with similar logic would have increased exposure to the same market scenario, so the signal was skipped.
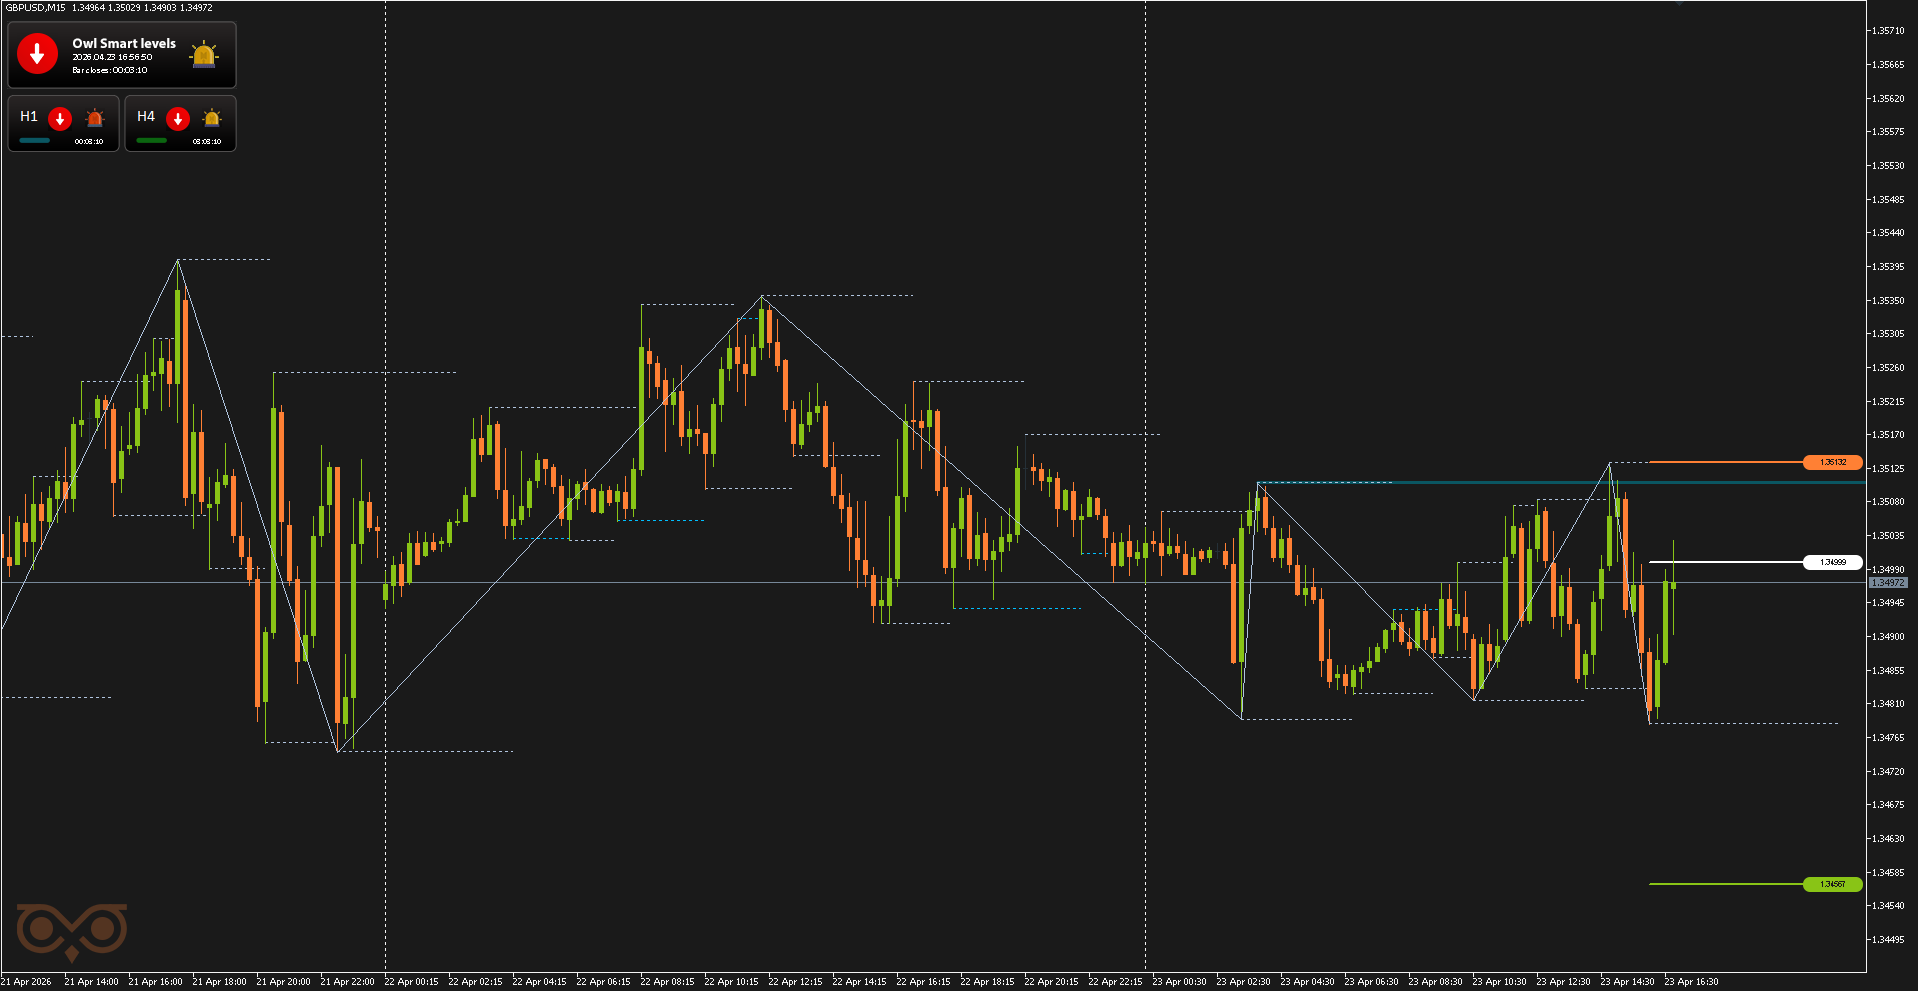
Fig. 9. Strong signal — entry near the H1 level, but the trade was skipped due to an active EURUSD position
AUDUSD review
The first signal on AUDUSD was received on April 20 and was a strong one. Here, the main focus was on the price reaction near the H1 level: the market approached a higher timeframe zone after a local recovery, and the signal itself appeared in an area where a resumption of selling could be expected.
After the signal appeared, a sell trade on AUDUSD was opened. The idea was that after approaching H1, the price would fail to hold above and continue to decline. However, this time the market did not provide the expected reaction from the level: the move against the position was stronger, and the trade was closed at StopLoss.
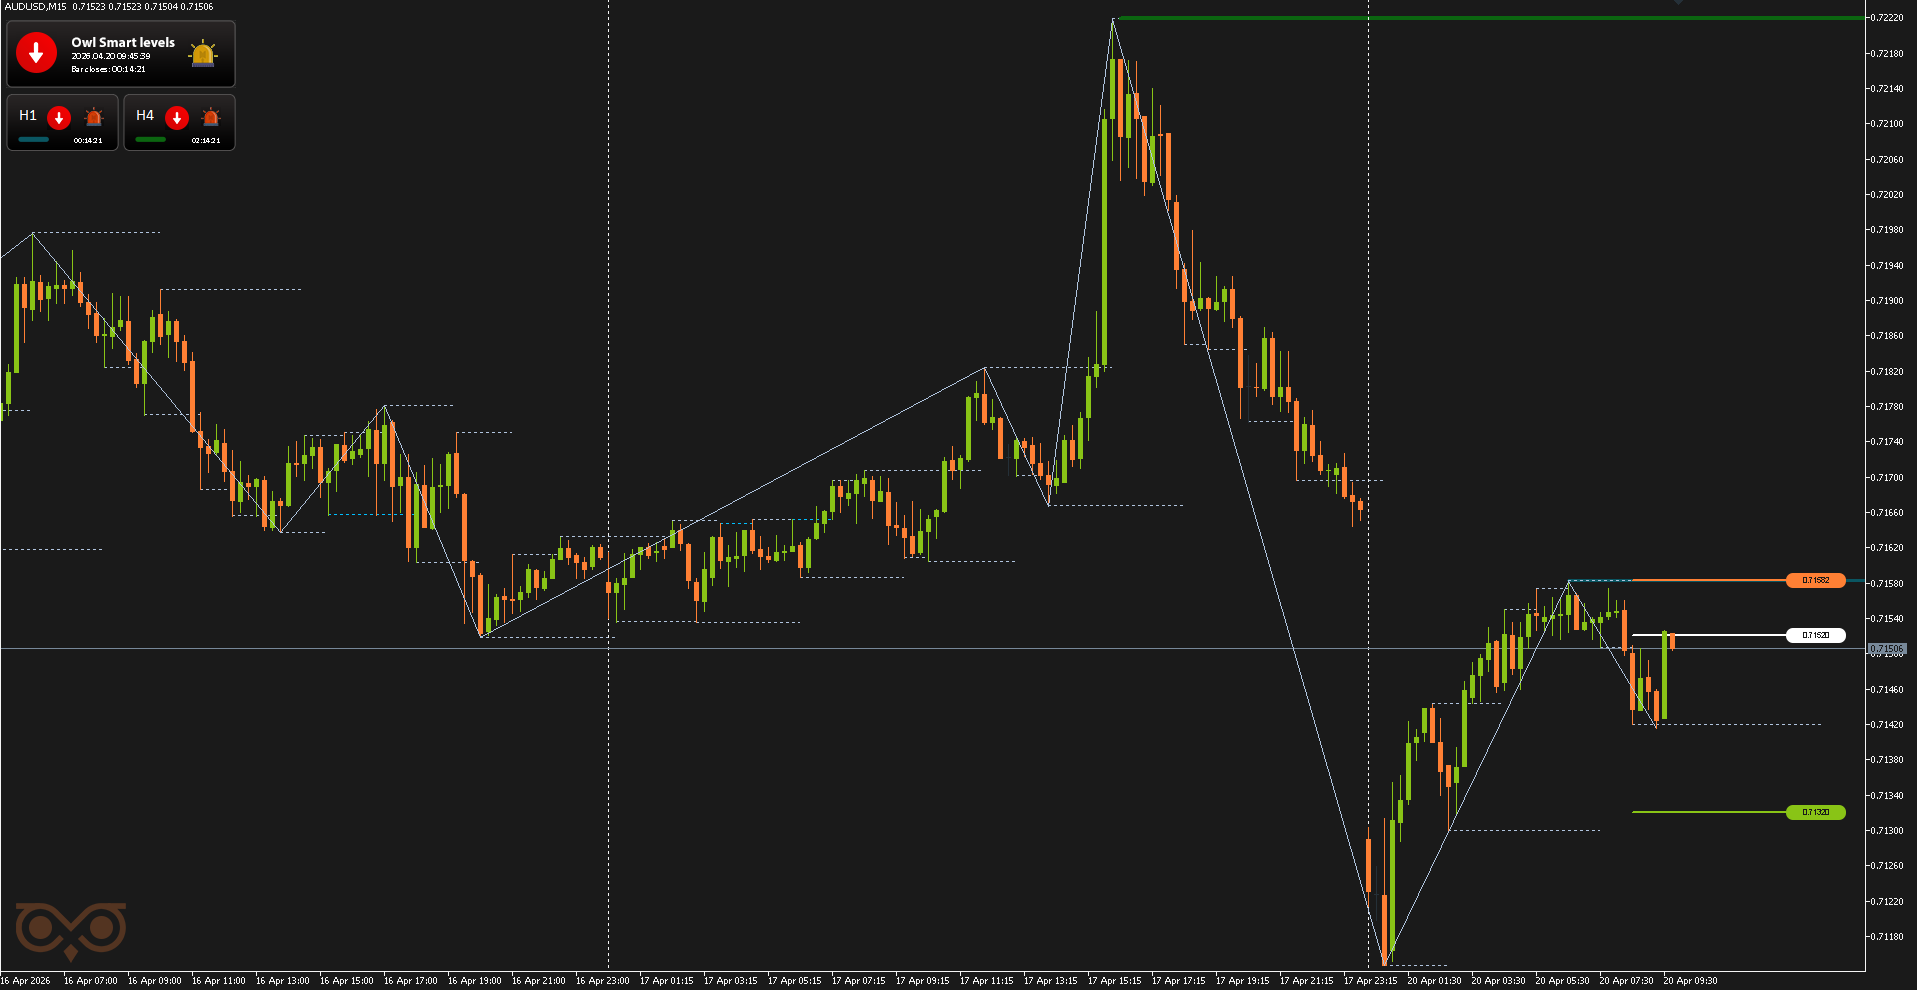
Fig. 10. AUDUSD SELL, Lot = 24.19, OpenPrice = 0.71520, StopLoss = 0.71582, TakeProfit = 0.71343, Profit = -$1 500.00
The second signal on AUDUSD was received on April 21 and was again strong. In this case, the signal belongs to the deep pullback-in-trend model: the price first showed a downward directional move, then made a sufficiently deep pullback, while not breaking the main scenario.
However, no trade was opened based on this signal. At that moment, a position on EURUSD was already active, so an additional entry on AUDUSD would have increased exposure to the same market scenario. Despite the strength of the signal, priority was given to risk management and the already open trade.
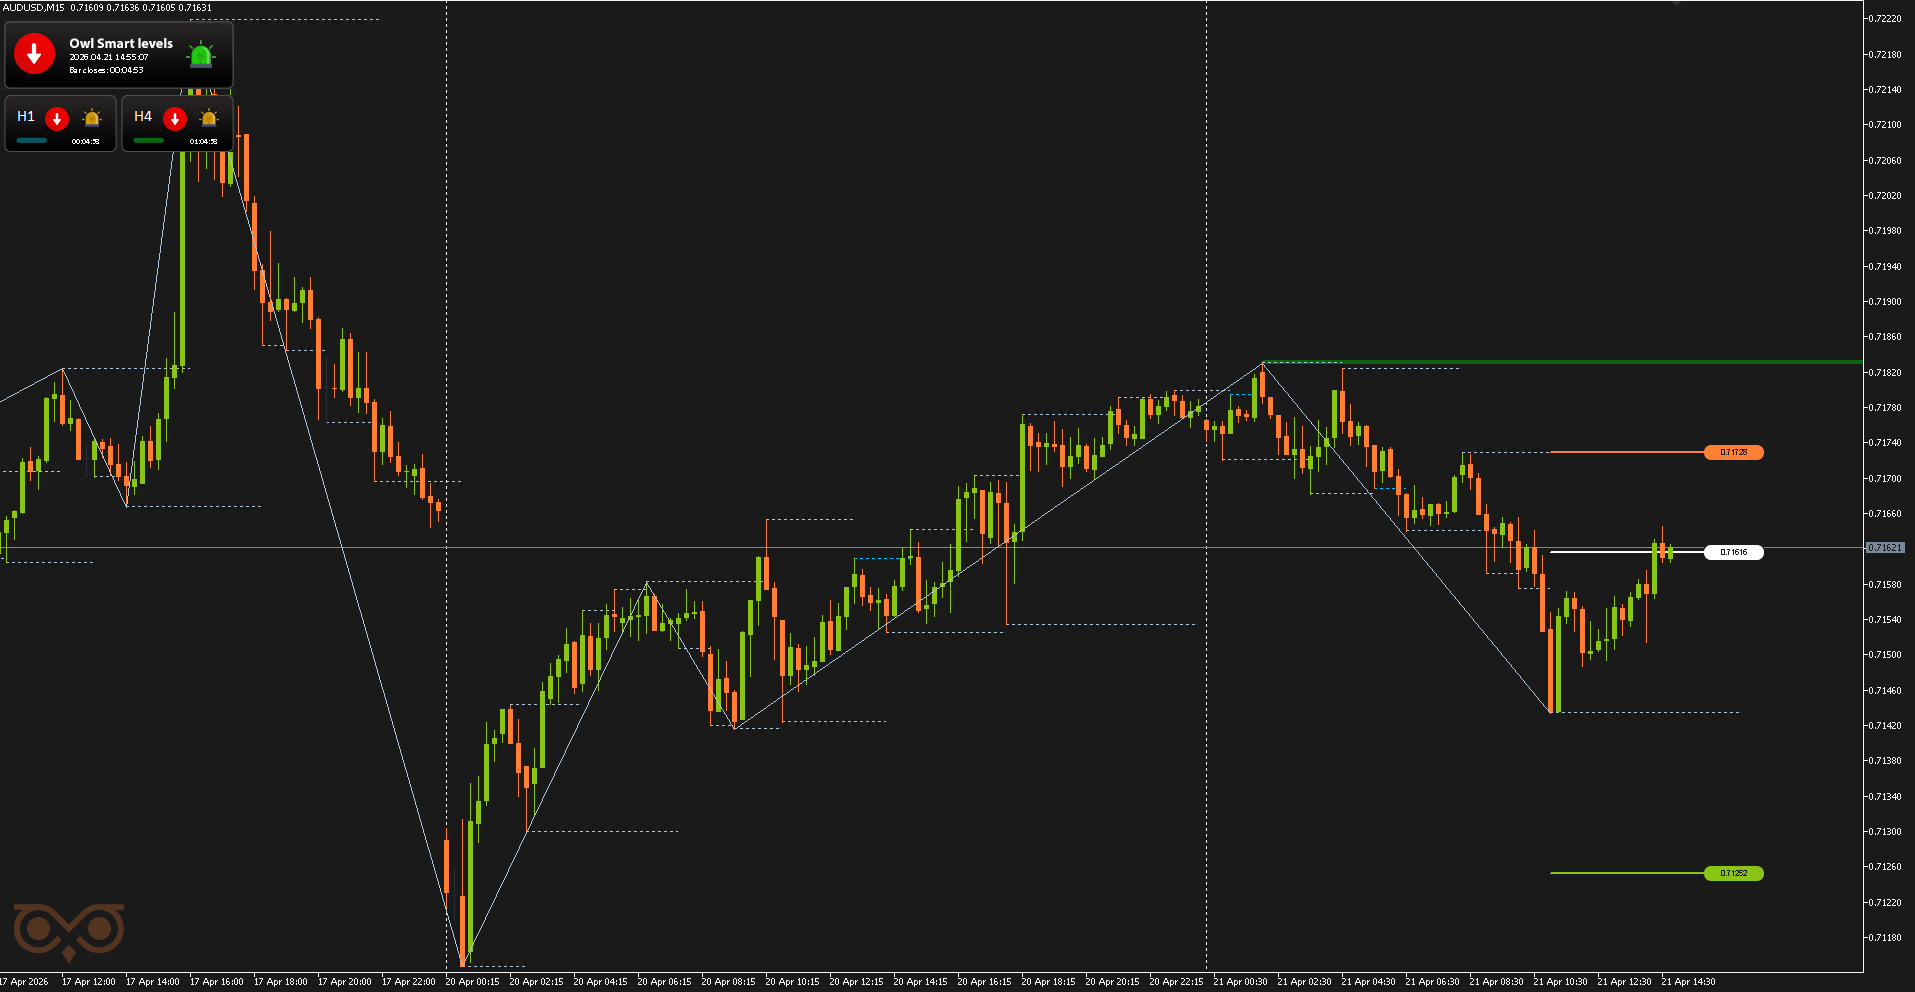
Fig. 11. Strong signal — deep pullback within the trend, but the trade was skipped due to an active EURUSD position
Summary:
The Forex results for the past week show that within Owl Smart Levels, a key role was played not only by the strength of the signals, but also by the ability to correctly filter situations where opening a trade could lead to duplication of the same market scenario.
During the reviewed period, 11 signals were received across currency pairs. Out of these, 10 signals were classified as strong, and 1 signal was low-probability. The low-probability signal was deliberately skipped, as the market did not show sufficient movement for a quality trade entry.
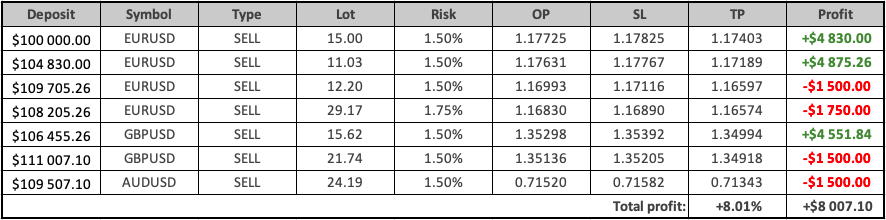
A total of 7 trades were opened during the week. Of these, 3 trades were closed at TakeProfit, while 4 trades were closed at StopLoss. The overall result for all trades over the week was +$8 007.10, which corresponds to +8.01% of the deposit.
This result shows that even with losing trades, the system can remain profitable thanks to a proper risk-to-reward ratio.
If you want to better understand which signals are low probability and which have higher chances of success, check out the following articles:
Detailed data for all positions and final results for each trade are shown in the summary table.

Indicator Owl Smart Levels MT5 | MT4 version
See other trading reviews using the Owl Smart Levels system:
I'm Sergei Ermolov, follow me and don't miss more useful tools for profitable trading on the Forex market.


")
