

Most indicators look like a “black box”: signals appear, but it’s not clear why they form where they do.
At some point, this leads to the key question: is there real logic behind it, or is it just coincidence?
Panther Trade Scenario is built differently.
There is no “signal magic” here — only clear, repeatable price behavior. And once you understand it, it becomes clear why entries form where they do.
Why the intraday range is predictable
Price does not move randomly. Every trading day has its own range — the distance between the high and the low. If you look at historical data, you’ll notice that this distance tends to repeat. It may vary slightly, but it does not change randomly.
In essence, this is the average daily range (ATR).
And this is a key point.
If the market tends to cover roughly the same distance during the day, it means there are boundaries within which price action is more predictable. Market participants operate within this expected daily range, creating repeatable behavior.
Sometimes price moves far beyond this range — and in those zones, the market starts behaving differently. This usually happens on days with major news or external events.
Most impulsive and losing entries happen outside this range: the move looks strong, it feels like “the market is taking off”, and the entry comes after a large part of the move is already done.
The risk-to-reward ratio worsens at this point: the stop remains wide, while the remaining potential is limited. In other words, the entry happens near the end of the move, where the probability of continuation is already decreasing.
The goal is to trade where moves develop within a clear and structured logic, and avoid periods where price is driven by external factors.
This principle is at the core of Panther Trade Scenario.

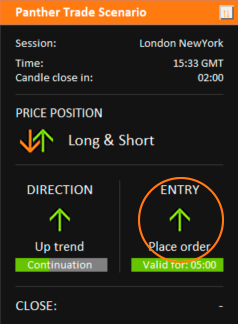
The average range (LONG & SHORT) is used to define the current day’s boundaries — the zone where the market tends to move in a repeatable way.
From the start of the Asian session, the indicator plots the average range above and below, forming a working area. As long as price remains within these boundaries (from the orange line to the green line), the indicator looks for trade setups with a defined entry, risk, and target.
At the upper boundary — Short only, at the lower boundary — Long only, and in the middle of the range both directions are allowed. Outside the range — a non-trading zone (No Trade Above and No Trade Below).
This filter filters out entries when the move is already losing potential and helps avoid trades that come from chasing a move that has already played out.
In practice, it’s hard to track this manually: the range is dynamic, and in real time it’s easy to misjudge its boundaries. The Panther Trade Scenario indicator applies this logic consistently in every trade.
The daily range filter defines the trading boundaries. The next step is to determine the direction within this area.
How direction is determined
To understand direction, we need to understand how price moves.
At its core, price action is built on local highs and lows. This is the fundamental structure behind any market. Trend direction depends on the sequence of these points.
What defines an uptrend.
Lows are progressively higher — price holds above previous levels with each pullback.

What defines a downtrend
Highs are progressively lower — price fails to break previous highs.

As long as this structure holds, the direction remains unchanged.
This is where a common mistake happens. Local pullbacks are often mistaken for reversals, leading traders to enter in the opposite direction — while the trend structure is still intact. As a result, positions are opened against the current move, which is actually still in progress.
Such trades usually end in a stop loss, because the probability of continuation in the direction of the trend is higher than the probability of a reversal before the structure breaks.
What defines a reversal
Only when the last local high or low is broken — can we confirm a change in direction and shift the trading bias.

This logic is used in Panther Trade Scenario.
The indicator does not rely on complex calculations to define direction. It uses the same basic structure of highs and lows.
Trend direction is not predefined or predicted. It forms together with the market and only changes when the underlying structure changes.
As a result, trades are taken only in the direction defined by price structure. This filters out trades against the current move and reduces the need for subjective decisions.
How the indicator determines the entry moment
Direction alone isn’t enough to find precise entry points. It shows where to trade, but does not answer the key question — when exactly to enter.
Even within a trend, price does not move in a straight line. Pullbacks constantly occur within the move. These pullbacks are where entry opportunities form — allowing you to join an established move at a more favorable price.
This is where a common problem in manual trading appears. A trader tries to identify when a correction is ending. At this stage, the entry point is not obvious — the move still looks like a normal continuation of the pullback. As a result, the entry happens too early, the position is opened against the local move, and the market continues correcting.
The key question is — how to tell that the correction is ending and the market is ready to continue the move.
The same structural logic is applied here, but on a lower timeframe.
As long as the lower timeframe shows movement against the main trend — the correction is still in progress. At this stage, Panther Trade Scenario remains in waiting mode — there is no entry signal.
But once the structure on the lower timeframe shifts and highs and lows begin forming in the direction of the main trend — the pullback is considered complete.

Notice how this looks on the main timeframe, where the trend direction is defined. The entry point forms at the end of the correction — right at the beginning of the reversal. This approach allows entering in the direction of the main trend as the move begins.

The indicator detects this structural shift using clear rules for identifying highs and lows, eliminating subjective interpretation. It then displays a signal on the info panel.
As a result, the indicator provides an entry in the direction of the main trend at the moment the correction ends. The trade is opened at the start of the move — not by chasing it — with a more favorable risk-to-reward ratio.
Exiting a trade is an equally important part of the strategy
After opening a position, trade management begins. For most traders, this is the most difficult stage.
Once the entry is made, attention shifts entirely to price behavior. If the market immediately moves in the direction of the position — everything feels clear and controlled. But more often, a different scenario unfolds: price fails to pick up momentum, starts fluctuating, produces pullbacks, or simply stalls.
This is when tension appears. There is a desire to “give the market time”, to wait a bit longer, to sit through it. At the same time, there is already a sense that something is off, but the decision is delayed.
In practice, such trades rarely deliver strong results. If the move does not begin shortly after entry, it usually indicates a lack of momentum — meaning the trade idea is not playing out as expected.
In the opposite scenario, everything unfolds differently. When price immediately starts moving in the direction of the position, it becomes clear that the market is following through. These are the moves that generate the main profit — and they are the ones worth holding.
The principle behind Panther Trend Scenario is not to extract the maximum from every entry — it focuses on capturing momentum moves and quickly filters out situations where that momentum is absent.
As a result, the focus shifts: it is not only about entering correctly, but also about recognizing in time whether the move you entered for is actually developing.
How this is implemented in the indicator
This logic is built into Panther Trade Scenario and is handled through position management, requiring no additional decisions from the trader in real time.
The indicator decides when to close a trade based on ATR volatility of the signal timeframe. In other words, it evaluates what price movement is considered normal for the current market and compares it with price behavior after entry.
If the market shows no activity and price does not demonstrate clear movement in the direction of the position, such a trade is not held. The indicator sends a close signal relatively quickly, because the key element is missing — momentum.
This avoids wasting time on stalled trades and prevents holding positions that have no real potential.
If, after entry, price starts moving in the desired direction, the logic changes. In this case, the trade is considered valid, and the goal is not to exit too early, but to let the move develop. The position is held as long as the market maintains momentum, and the indicator sends a close signal when it becomes clear that momentum is starting to fade.

The strategy does not require guessing the exit point in advance. Decisions are made based on actual price behavior.
As a result, the entire logic of the indicator comes down to a simple and clear process. Direction is defined by price structure, while the entry point is determined by the completion of a correction on a lower timeframe.
Even with a clear understanding of the logic, applying it consistently in real time is difficult — structure forms dynamically, and the moment it shifts can easily be missed or interpreted differently.
Panther Trade Scenario solves this problem by capturing all system conditions in real time and displaying them objectively, allowing the same logic to be applied consistently in every trade without distortion.
This is where the real edge comes from — eliminating errors caused by subjective decisions in the moment.
Panther Trend Scenario Indicator


 & AMD Framework")
")