
Brute force approach to pattern search

Introduction
In this article, we will search for market patterns, create Expert Advisors based on the identified patterns, and check how long these patterns remain valid, if they ever retain their validity. I think this article will be extremely useful for those who create self-adapting trading systems. I would like to start with an explanation of what I mean by the concept of brute force in the context of forex trading. In general, in the brute-force approach we want to determine some sequence of numbers for a code or any other purpose, which ultimately will allow to achieve the desired result with the maximum probability or with the maximum available probability, using this sequence. The desired result can be to get cryptocurrency or to hack an account or Wi-Fi password. The application area is very wide. In the case of forex, our sequence should give the maximum profit, while working as long as possible. The sequence can be of any type and length. The only required condition is its efficiency. The sequence type ultimately depends on our algorithm
What is so special about this technique that I decided to consider it?
I always try to express my thoughts so that they have the maximum practical application for other traders. Why am I doing this? That is a good question. I want to share my experience with other traders. I would be glad if someone could utilize my ideas and implement something interesting and profitable, no matter whether I get anything from it or not. I certainly understand that the ideas may not be completely mine and that I might be reinventing the wheel. I believe that we should share experiences and collaborate as productively as possible. Perhaps this is the secret of success. It is hard to achieve any significant alone, working in isolation from all others. In my opinion, the topic of patterns is of fundamental importance for understanding the physics of the market. You career as trader can depend the very understanding of basic ideas, even though the phrase "career as a trader" may sound funny. I hope that I can be useful for the people who research these questions.
About Brute Force and its differences from Neural Networks
A neural network is essentially also a kind of brute force. But its algorithms are very different from simple brute force algorithms. I will not provide the details of specific neural network architectures and their elements, but will try to provide a general description. I think, if we stick to a certain architecture, we limit the capabilities of our algorithm in advance. A fixed architecture is an irreparable limitation. A neural network is a kind of architecture of a possible strategy in our case. As a result, the configuration of a neural network always corresponds to a certain file with a network map. This always points to a collection of certain units. It is like with a 3D printer: Set item parameters and the printer will produce it. Thus, a neural network is a general code that does not make sense without a map. This is like taking any advanced programming language and simply creating an empty project without utilizing all its capabilities. As a result, the empty template does nothing. The same is with the neural network. Unlike brute force, a neural network can provide almost unlimited variability in strategies, any number of criteria and higher efficiency. The only disadvantage of this approach is that the efficiency greatly depends on the code quality. An increasing system complexity may lead to increased resource intensiveness of the program. As a result, our strategy is converted into a network map, which is its equivalent. The same is done in the brute force approach, but here we work with a simple sequence of some numbers. This sequence is much simpler than a network map, it is easier to compute, but it also has a limit in terms of efficiency. The below scheme displays the above explanation.
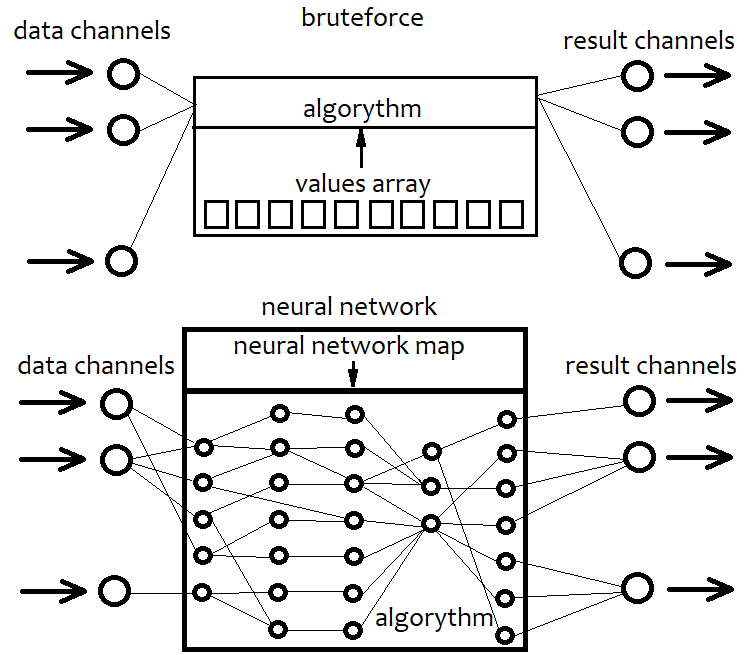
In other words, with a brute-force approach, we select a sequence of numbers that interacts with our code and produces different results. But since the algorithm is fixed, its entire flexibility is contained in the array of numbers. Its length is fixed and the structure is very simple. When working with a neural network, we search for a network map that will give the best result. In any case, we search for a certain sequence of bytes, or the data which are eventually converted into the resulting algorithm. The only difference is in their capabilities and complexity.
My brute force and optimization algorithm
I used multivariate Taylor expansion in my algorithm. Here is why I have selected this approach. I wanted to provide an algorithm that would be as variable as possible bur very simple. I didn't want to stick to any specific formula, since any function can be eventually expanded into a Taylor series or a Fourier series. I think the Fourier series is not very suitable for this purpose. Moreover, I am not familiar with the multidimensional equivalent. That is why I decided to use the first variant. Furthermore, its implementation is much easier. A one-dimensional Taylor series looks like this:
Y = Cs[0]+Cs[1]*(x-x0)^1 + Cs[2]*(x-x0) ^2 + ... + Cs[i]*(x-x0)^n
where the coefficients before powers serve as derivatives of the order from 0 to n. This can be converted to a simpler form by expanding the brackets:
Y = C[0]+C[1]*x^1 + C[2]*x^2 + ... + C[i]*x^n + ...= Sum(0,+infinity)(C[i]x^i)
In this case, we only have one variable. This series can imitate any continuous and differentiable function near any selected x0 point. The more terms the formula has, the more accurately it describes our function. If their number is equal to infinity, then this is the absolute equivalent of our function. I will not show here how to expand any function into a Taylor series in near any point. This information is available in any maths book. But the one-dimensional variant is not enough for us, as we want to use the data from multiple bars in order to increase the variability of the general formula. That is why the multidimensional variant should be used:
Y = Sum(0,+Infinity)( C[i]*Product variant(x1^p1*x2^p2...*xN^pN) )
Other variants of the formula are rather difficult. It has the same logic as the one-dimension variant. We must provide all possible partial derivatives. If we limit the highest power of the terms, then we can calculate the total number of such terms using combinations and sums. Our algorithm will use the limitation of the highest degree in order to limit the consumption of computing resources.
But this is still not enough to make our brute-force function more convenient. It is better to remove the first term C[0] and let the function have maximum symmetry with respect to negative or positive values that we will feed into it. Also, a convenient solution would be to interpret a positive function value as a buy signal, and a negative value as a sell signal. An increase in the lower limit of the modulus of this signal should ideally lead to an increase in the expected payoff and profit factor, but will also inevitably lead to a decrease in the number of signals. The closer the function is to these requirements, the better. We will input to the functions (Close[i]-Open[i]) values of a specific candlestick as variables.
What we need to do now is to randomly generate variants of these coefficients and check how the variant behaves in the tester. Of course, no one will iterate these coefficients manually. So, we need an Expert Advisor which can produce such variants while maintaining thousands of such variants, or a third-party solution implementing some of the strategy tester functions. Initially, I had to write such an Expert Advisor in MQL4 - this EA is attached to the article along with instructions, so it can be used by everyone. But I will use another application, which I have developed in C#. Unfortunately, I cannot provide this application for free access for obvious reasons. Its capabilities go far beyond the area of research. But I will describe and demonstrate all its capabilities, so that everyone who knows how to program can reproduce this application. The screenshots will be provided later in the article, where we will analyze the operation results.
Here are the main features of the application. Search for arrays of coefficients is performed in 2 stages. The first stage simply searches a loaded quote for the arrays that produce either the maximum expected payoff or the maximum profit factor on the next candlestick. Passes similar to the strategy tester are executed. In fact, it is simply trying to find a formula that predicts the direction of the next bar with maximum accuracy. A certain number of the best results are stored in memory and on disk as array variants. Only part of quote can be tested - percent relative to the loaded quotes file should be specified here. This is used to allow discarding of random values in the second stage. The second stage simulates market orders and a balance curve - this is done for the entire loaded area. At the same time, a smooth increase in the signal magnitude is performed, along with a search for better quality options. This stage also has various filters by using which we can obtain smoother charts. The smoother the chart, the better the found formula. Upon completion of the second search stage, there is a certain number of the best options that can be visually seen in the list. Having selected the desired option, it will be possible to generate in the third tab a trading robot for MetaTrader 4 and MetaTrader 5. The EA is generated according to a pre-compiled template, in which the received numbers are specified in certain places.
Building a simple template for the task
The template was originally created in MQL4, and then converted into MQL5. The code is adapted for both platforms (similarly to the code in the previous article). I try to provide this compatibility in order to spend less time for solution adaptation. To use predefined arrays as in MQL4, some extra code should be added to the Expert Advisor, which was described in my previous article. So kindly check that article for details. This knowledge is required for this article. Actually, it is not difficult, and any developer can implement such compatibility. Let us start by describing the variables and arrays that will be filled automatically at the robot generation time.
double C1[] = { %%%CVALUES%%% };//array of coefficients
int CNum=%%%CNUMVALUE%%%;//number of candlesticks in the formula
int DeepBruteX=%%%DEEPVALUE%%%;//formula depth
int DatetimeStart=%%%DATETIMESTART%%%;//start point in time
input bool bInvert=%%%INVERT%%%;//inverted trading
input double DaysToTrade=%%%DAYS%%%;//number of days into the future to trade
Here C1 is the array of coefficients in front of the degrees, which we selected. CNum is the number of recent candles on the price chart that will be used to calculate the polynomial value. Next comes the depth of the formula, which is the maximum degree of the multidimensional polynomial. I usually use 1, because, unlike the one-dimensional Taylor series, the multidimensional one has much greater calculation complexity with and increasing degree, because the total number of coefficients increases significantly with an increase in the degree. The starting point in time is needed in order to limit the EA operation time, because such limitation uses information about where operation started. The inversion function is used to ensure that the polynomial works in the right direction. If we invert all signs in front of the degree coefficients, then the polynomial itself will not change, while only the numbers that outputs by the polynomial will have a different sign. The most important part here is the ratio of the coefficients. If a negative value of the polynomial indicates selling, and a positive value means buying, then the inverse = false. If not, then true. Thus, we instruct the algorithm "to use the values of the polynomial with an inverted sign". Also, it is better to make this variable an input value, since we may need to be able to invert trading, as well as the number of days for trading in the future.
If you need to calculate the size of an array with coefficients, this can be done as follows:
int NumCAll=0;//size of the array of coefficients
void DeepN(int Nums,int deepC=1)//intermediate fractal
   {
   for ( int i=0; i<Nums; i++ )
      {
      if (deepC > 1)
         {
         DeepN(Nums,deepC-1);
         }
      else
         {
         NumCAll++;
         }
      }
   }

void CalcDeepN(int Nums,int deepC=1)//to launch calculations
   {
   NumCAll=0;
   for ( int i=0; i<deepC; i++ )
      {
      DeepN(Nums,i+1);
      }
   }
The intermediate fractal function counts the number of the terms that have the same total degree of all factors. This is done for simplicity, because it is not so important for us in which order the terms are summed. The second function simply calls the first one in a loop as many times as there are types of terms. For example, if the multidimensional series expansion is limited to, let's say, 4, then we call the first function with all natural numbers from 1 to 4.
The function that will calculate the polynomial value is almost identical. However, in this case the array is generated by itself and its size does not need to be set. Here is how this looks like:
double ValW;//the number where everything is multiplied (and then added to ValStart)
uint NumC;//the current number for the coefficient
double ValStart;//the number where to add everything
void Deep(double &Ci0[],int Nums,int deepC=1,double Val0=1.0)//calculate the sum of one degree
   {
   for ( int i=0; i<Nums; i++ )
      {
      if (deepC > 1)
         {
         ValW=(Close[i+1]-Open[i+1])*Val0;
         Deep(Ci0,Nums,deepC-1,ValW);
         }
      else
         {
         ValStart+=Ci0[NumC]*(Close[i+1]-Open[i+1])*Val0/Point;
         NumC++;
         }
      }
   }

void CalcDeep(double &Ci0[],int Nums,int deepC=1)//calculate the entire polynomial
   {
   NumC=0;
   ValStart=0.0;
   for ( int i=0; i<deepC; i++ )
      {
      Deep(Ci0,Nums,i+1);
      }
   }
Everything calculated will be added to ValStart, that is, the result will be added to a global variable. Another global variable is needed - ValW. It is used to multiply the already existing product by some value. In our case, this is the movement of the corresponding bar in points. The movement can be both up and down, which is shown by the sign. So, these functions have a very interesting structure. They call themselves inside, and the number and structure of these calls is always different. This is a kind of a call tree. I really like to use these functions as they are very variable. This time we have implemented the multidimensional Taylor series in a simple and elegant way.
It is also possible to implement an additional function for the case when only one-dimensional version of the polynomial is used. In this case, the entire series is greatly simplified. It turns into a sum of coefficients multiplied by the movement of one of the bars in the first degree. Their number becomes identical to the number of used bars. This simplifies all calculations. If the degree is one, then a simplified version is used. Otherwise a more universal method for any degree is used.
double Val;
double PolinomTrade()//optimized polynomial
   {
   Val=0;
   if ( DeepBruteX <= 1 )
      {
      for ( int i=0; i<ArraySize(C1); i++ )
         {
         Val+=C1[i]*(Close[i+1]-Open[i+1])/Point;
         }
      return Val;
      }
   else
      {
      CalcDeep(C1,CNum,DeepBruteX);
      return ValStart;
      }
   }
When a simple variant is used, the results are added to the Val variable.
Now let's write the main method that will be called when a new bar appears:
void Trade()
   {
   double Value;
   Value=PolinomTrade();

   if ( Value > ValueCloseE)
      {
      if ( !bInvert )
         {
         CloseBuyF();
         }
      else
         {
         CloseSellF();
         }
      }

   if ( Value < -ValueCloseE)
      {
      if ( !bInvert )
         {
         CloseSellF();
         }
      else
         {
         CloseBuyF();
         }
      }

   if ( double(TimeCurrent()-DatetimeStart)/86400.0 <= DaysToTrade && Value > ValueOpenE && Value <= ValueOpenEMax )
      {
      if ( !bInvert ) SellF();
      else BuyF();
      }

   if ( double(TimeCurrent()-DatetimeStart)/86400.0 <= DaysToTrade && Value < -ValueOpenE && Value >= -ValueOpenEMax )
      {
      if ( !bInvert ) BuyF();
      else SellF();
      }

   }
This function is very simple. All you need to do is to implement our desired position opening and closing functions.
The bar emergence can be detected as follows:
void CalcTimer()
   {
   if ( Time[1] > PrevTimeAlpha )
       {
       if ( PrevTimeAlpha > 0 )
          {
          Trade();
          }
       PrevTimeAlpha=Time[1];
       }
   }
I think the code very simple and clear.
The coefficients generated by my code are created using four models explained above. For convenience, all these coefficients lie in the range [-1,1], because the ratios of values are more important than the values themselves. The function that generates these numbers from my MQL5 program prototype looks like this:
   void GenerateC()
      {
      double RX;
      if ( DeepBrute > 1 ) CalcDeepN(CandlesE,DeepBrute);
      else NumCAll=CandlesE;
      for ( int j=0; j<VariantsE; j++ )
         {
         ArrayResize(Variants[j].Ci,NumCAll,0);
         Variants[j].CNum=CandlesE;
         Variants[j].ANum=NumCAll;
         Variants[j].DeepBruteX=DeepBrute;
         RX=MathRand()/32767.0;
         for ( int i=0; i<Variants[j].ANum; i++ )
            {
            if ( RE == RANDOM_TYPE_1 ) Variants[j].Ci[i]=double(MathRand())/32767.0;
            if ( RE == RANDOM_TYPE_2 )
               {
               if ( MathRand()/32767.0 >= 0.5  )
                  {
                  Variants[j].Ci[i]=double(MathRand())/32767.0;
                  }
               else
                  {
                  Variants[j].Ci[i]=double(-MathRand())/32767.0;
                  }
               }
            if ( RE == RANDOM_TYPE_3 )
               {
               if ( MathRand()/32767.0 >= RX  )
                  {
                  if ( MathRand()/32767.0 >= RX+(1.0-RX)/2.0  )
                     {
                     Variants[j].Ci[i]=double(MathRand())/32767.0;
                     ///Print(Variants[j].Ci[i]);
                     }
                  else
                     {
                     Variants[j].Ci[i]=double(-MathRand())/32767.0;
                     }
                  }
               else
                  {
                  Variants[j].Ci[i]=0.0;
                  }
               }
            if ( RE == RANDOM_TYPE_4 )
               {
               if ( MathRand()/32767.0 >= RX  )
                  {
                  Variants[j].Ci[i]=double(MathRand())/32767.0;
                  }
               else
                  {
                  Variants[j].Ci[i]=0.0;
                  }
               }
            }
         }
      }
The brute force prototype in MQL4 and MQL5 is available in the article attachment. I do not provide here my trading function implementations, as the purpose is only to show how the approach can be implemented within the framework of a template. If you are interested in viewing the entire implementation, please check the attachment. All Expert Advisors and other required materials are available in the attachment to this article. General my template has quite a lot of excessive things, including unnecessary functions or variables and could be somehow optimized. Personally, I don't bother with that. If anything interferes with the operation, I will remove it. What is more important for me is that everything works well now. I am constantly developing something, so I don't have time to bring every detail to perfection. I also see no reason in storing all procedures and variables in classes, while this could improve the code order and readability. The template is very simple. The files with quotes, which will be used by the program, will be generated by a special Expert Advisor, which runs on history and writes the bar data to a text file with a structure that can be easily read by the program. I will not provide this EA's code here, as it can be easily developed.
Using the program for finding and analyzing patterns
I selected three market areas for analysis, they have a month length each and follow each other. EURUSD, M5.
- First interval: 2020.01.13 - 2020. 02.16
- Second interval: 2020.02.13 - 2020.03.15
- Third interval: 2020.03.13 - 2020.04.18
The intervals have been selected so that the last day is always Friday. And Friday, as you know, is the last trading day of the week. Selection of intervals in this way allows having two whole days to search for patterns, until the exchange starts trading again. This is kind of a small life hack. In our case this does not matter, because we test the EA in a tester. I decided to describe here 12 variants of the found patterns. Six of them will be polynomials with a maximum degree of 1. The other six will have the maximum degree of 2. I think this is enough.
Here is how the first tab of my program looks like:
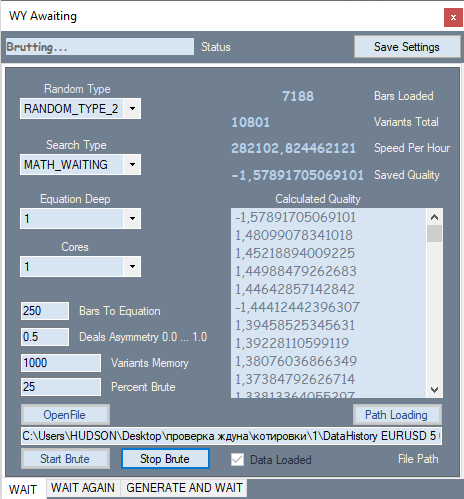
It provides the possibility to change the number generation type, for example, only positive, positive and negative, positive and zeros, positive and negative and zeros. The search criterion is configured in the second ComboBox. There two possible options: expected value in points and my analog of the profit factor formula. In my formula, this value ranges from -1 to +1. Also, it cannot have cases when profit factor cannot be calculation due to zero divide error.
P_Factor=(Profit-Loss)/(Profit+Loss).
Then comes the maximum degree of the polynomial and the number of processor cores to be used for calculations. In text blocks, specify the number of bars for the polynomial or the number of calculations, and my own invented deal asymmetry coefficient which is very similar to the previous formula
D_Asymmetry=|(BuyTrades-SellTrades)|/(BuyTrades+SellTrades).
Its values are in the range from 0 to 1. This filter is needed when we need to instruct the program to have a similar number of buy and sell signals in order to avoid situations when all trades are performed in the same direction during a global trend. Next is the number of the best variants from all found ones, which should be stored in memory, as well as what percentage of the loaded quote will be used for brute force iteration. This section is measured from the last bar by the open time, and the section behind it will be used for optimization. I will not explain the rest of the indicators and the list with variants, as they are simple enough.
The second tab looks like this:
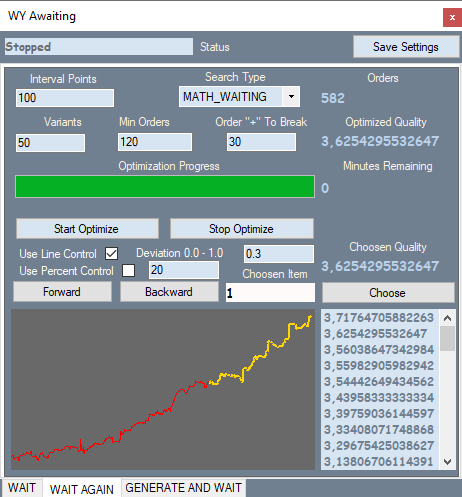
The tab corresponds to the first variant for the first section of the robots. You can compare the graph in my program with the tester graph. This will be presented below. Orders in the part of the quote where the brute force was performed are shown in yellow, others are shown in red. I will not provide screenshots of all the variants here - all of them are available in the attachment.
Let us see what is in the tab. Interval Points — splitting the interval of values of our polynomial. When we brute force on the first tab, it calculates the main parameters of the variant as well as the modulo maximum value of this polynomial. Thus, we know the window of values of the polynomial and can split this window into equal parts, gradually increasing value, trying to detect stronger signals. This is done in the second tab. This tab also has search type and the number of best variants which are stored in the optimization memory. Further filters allow us to filter out unnecessary variants which that do not fit into our definition of a pattern. Line Control enables an additional run for each variant, in which it calculates the relative deviation of the graph line from the straight line connecting the beginning and end of the graph.
Deviation = Max(|Profit[i]-LineProfit[i]|)/EndProfit.
Here Profit[i] is the value of the balance curve at the i-th order, LineProfit[i] is the same value on the straight line, EndProfit is the value at the end of the chart.
All values are measured in points. Use Percent Control is a percentage of the red part of the chart (I didn't use this filter in this case). There is also a filter for the minimum number of orders.
The below figure shows the bot generation tab:
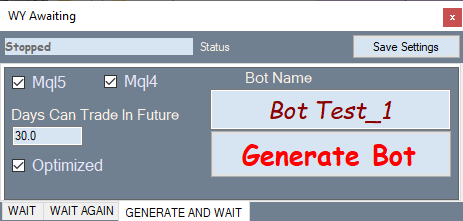
How it works: select the desired variant in the optimization tab, switch to this tab and generate an Expert Advisor.
Now, let us test the generated robots in the MetaTrader 4 Strategy Tester. I have chosen it, because it allows setting spread equal to 1 and thus to practically eliminate its influence on the chart display. Actually, the expected payoff of the majority of robots found in this way will be slightly higher than the average spread on a pair, so we would not be able to visually analyze patterns with a small expected payoff. Each variant was brute forced and optimized during about two hours, which is not enough for finding a high-quality pattern. It is better to spend a day or two. But this is enough for this article, which aims at analyzing found patterns rather than finding the best of them. If you are going to test my robots in the tester, please pay attention to the DaysToTrade variable. Its value is set to 3 days by default. Therefore, there may be almost no deals after the brute force section.
First, consider robots generated based on a first degree polynomial.
First section. 2020.01.13 - 2020. 02.16
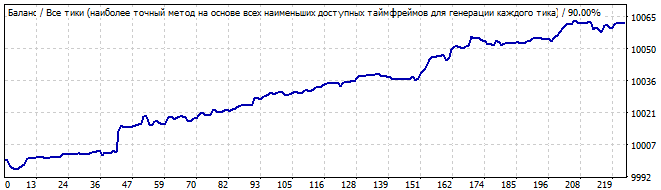
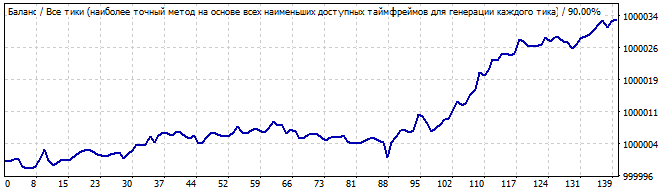
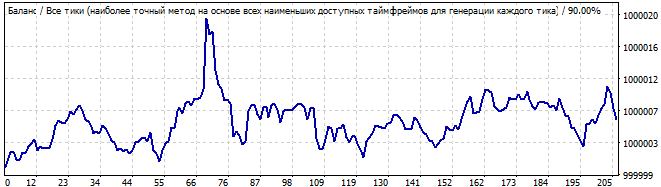
Robot 1:
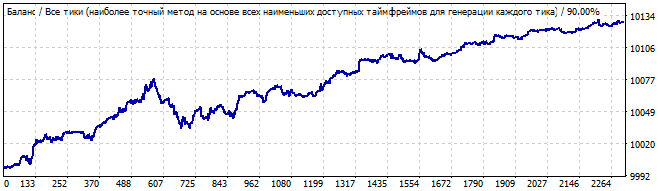
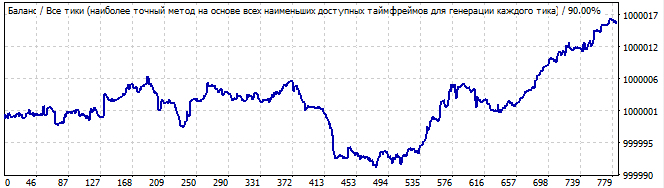
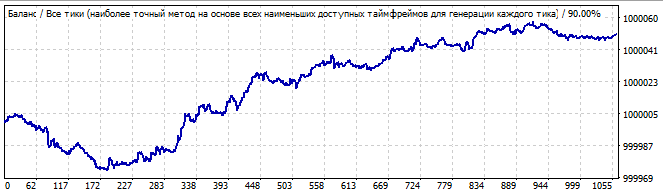
Brute force section
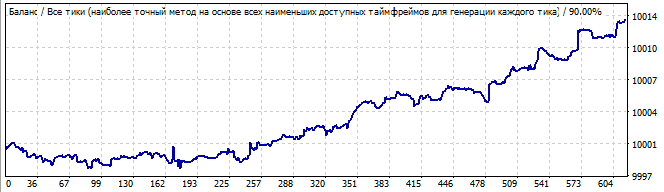
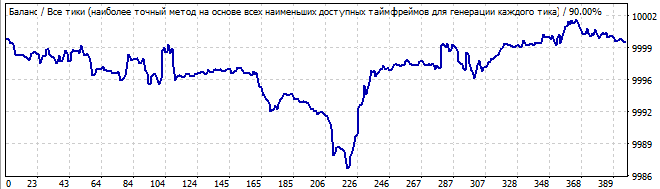
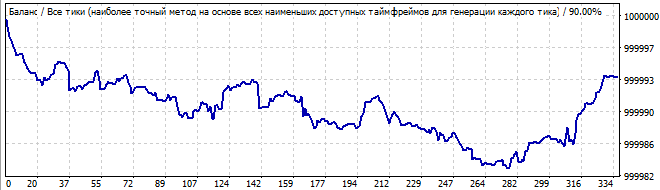
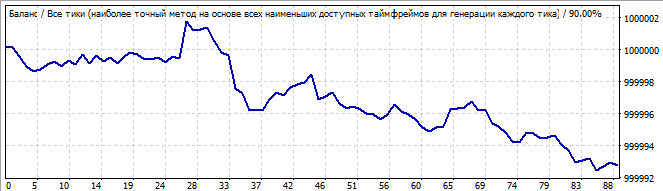
10 days into the future
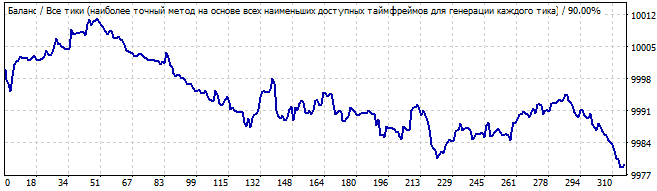
The first graph shows a variant from the screenshot of the second tab of my program. The second graph is testing of the same robot in the future for 10 days. I think 10 days are enough to see how it works. As you can see, the pattern continues for some time, and then it suddenly turns and goes in the opposite direction. It might seem that this pattern would be enough for generating profit for two or three days. Let us view the second robot in the same market area section:
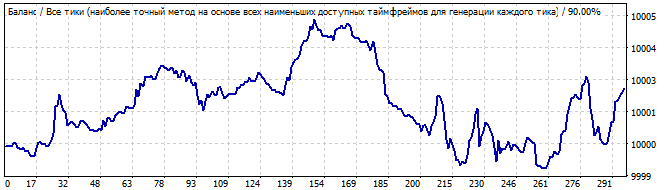
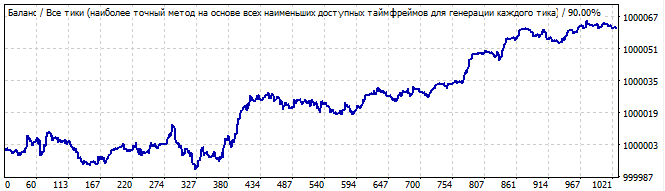
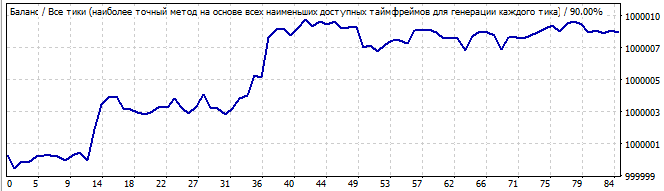
Brute force section
10 days into the future
Here the result is not so smooth. Why? It was expected that the pattern would work for a day or two, but it starts going down from the very first second, although the reversal is quite smooth. Probably this is not the result that you expected. But it can be explained. We will get back to it later.
Now, move on to the second testing interval. 2020.02.13 - 2020.03.15
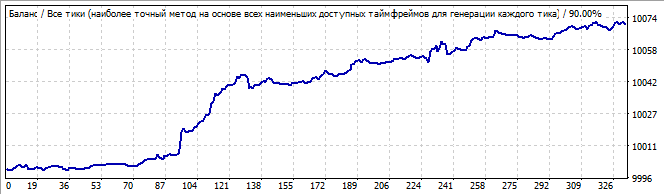
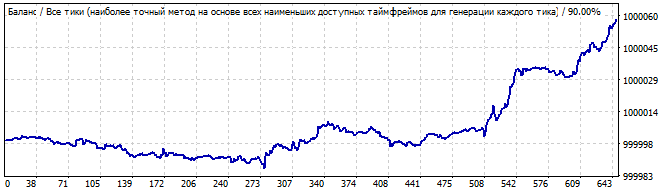
The third robot:
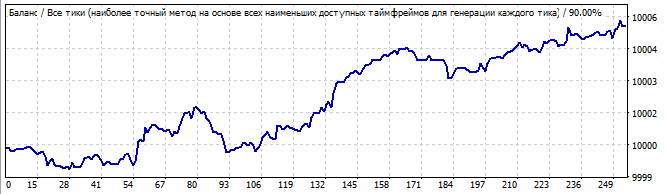
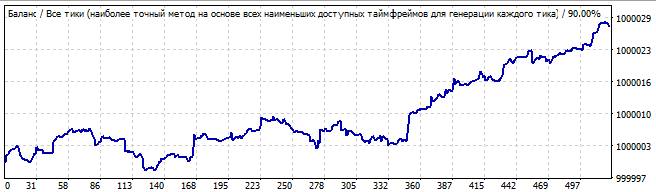
Brute force section
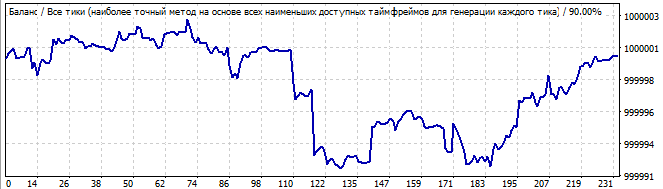
10 days into the future
This time the situation looks better. The graph is flat and is very close to a straight line. This indicates that the patter is stable and is likely to continue for some time. And it did continue. The movement in the future also resembles a line, which means that the many of the pattern parameters continued to work in the future.
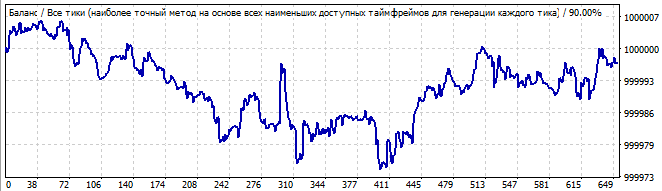
Here is the fourth robot:
Brute force section
10 days into the future
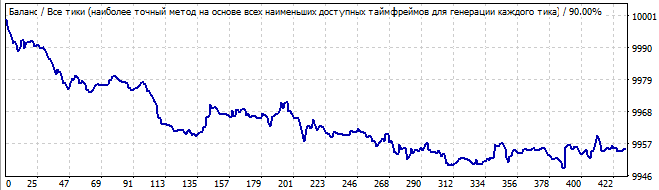
It has a pretty good upward movement, and everything looks smooth and stable, except for the sharp rise at the beginning of the chart. But this rise shouldn't be ignored: this asymmetry suggests that this can be just a coincidence or an accidental result. Naturally, in the future we see reversal of the entire pattern in the opposite direction.
Now go to the third testing interval. 2020.03.13 - 2020.04.18
Fifth robot:
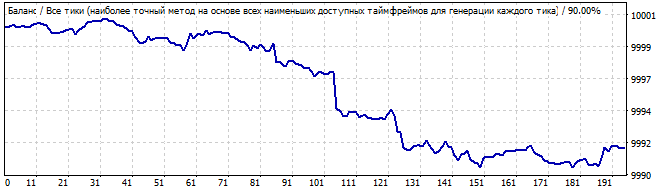
Brute force section
10 days into the future
The situation is similar. It shows visible asymmetry, waves at the beginning and attenuation at the end. This does not look like a reliable pattern. I would not trade pattern continuation. Again, in the future we see immediate graph reversal and inversion of the entire formula. I will not show the sixth robot here - its graph is available in the archive. It is very similar to the above graphs.
Now, let us test the robots based on a second degree polynomial.
First section. 2020.01.13 - 2020. 02.16
The seventh robot is as follows:
Brute force section
10 days into the future
The specific feature of these robots is that they work better in the brute force interval. The results are not so good at the interval preceding the brute force part. The brute force interval always shows a sharp positive half-wave. But the remaining interval is a mess. These are the results of a certain formula, the behavior is similar. There is a little randomness at the beginning followed by a movement in the opposite direction.
The eights variant:
Brute force section
10 days into the future
It is much worse. There are no global patterns, but it still shows an upward movement in the brute force interval. It is not a pattern, so the graph turns down.
Now check the second testing interval. 2020.02.13 - 2020.03.15
The ninth robot:
Brute force section
10 days into the future
I see the beginning of a wave in the first graph and its end in the future. There is not any global pattern, but the reversal is smooth enough to try to profit from it.
The tenth robot is as follows:
Brute force section
10 days into the future
The graph is better this time. This time it resembles a pattern. The pattern lasts for a day or two maximum. However, I would not risk trading such a graph. It has a significant deviation from the straight line.
Now go to the third testing interval. 2020.03.13 - 2020.04.18
Eleventh robot:
Brute force section
10 days into the future
The graph is not very beautiful, but there is some resemblance to the straight line. The pattern continues into the future, but I think it is luck rather than the regular results as it has too much random noise. Or this can be not quite noise, but small waves.
Twelfth robot:
Brute force section
10 days into the future
Quite an ugly graph, but it has a pronounced end of one wave and another huge one following it. In the future, this huge wave slowly reverses and finally inverts at some point. It seemed to me that the trend reversal occurred more smoothly on robots with a polynomial higher than degree 2. So they show less surprises. I think it makes sense to spend some time and to test the third degree. Regularities can be better described by the polynomial having a higher highest total power of the factors in the terms.
Conclusions and mathematical truths from our research
Now we can summarize all the test results of our Expert Advisors. This might seem difficult to do, since brute force and optimization intervals show patterns, while future segments show an unclear picture. Not really:
- In each of the future tests, there is always a point where the chart reverses and the formula is inverted.
- A reversal can occur smoothly or instantly, but it is always there.
- The vast majority of graphs generally go down in the future.
- Sometimes the pattern continues for a while at the beginning.
- All tests in the future have shown that the pattern works in an opposite direction.
- If the balance curve deviates from the straight line, then the chances of continuation are much lower.
- In the best of the found variants, the pattern continues to work for a day or two.
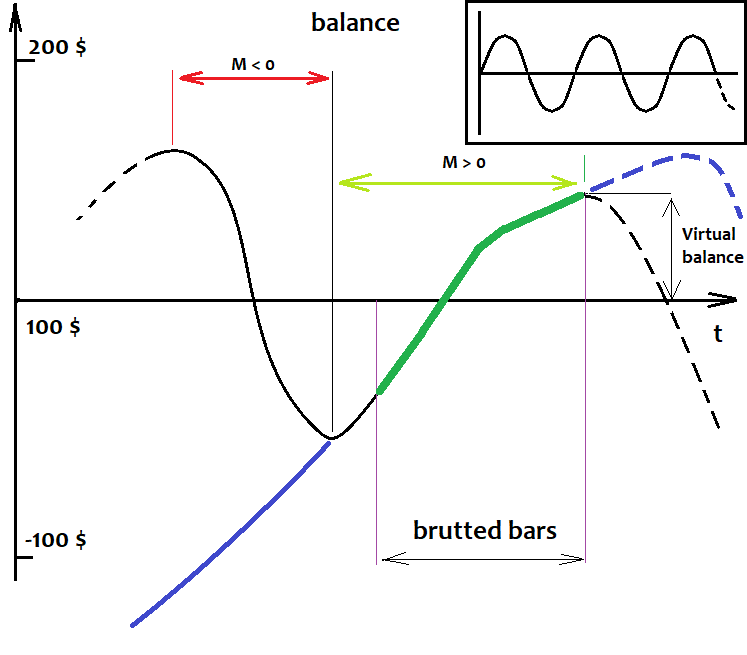
I will try to explain these facts now. I discovered the first and most important fact a long time ago, when I didn't yet have such programs. This is a simple mathematical truth. I have drawn below a balance graph of an arbitrary strategy. The black line is the one with a small pattern, and the purple line has a pattern. The graph shows their approximate behavior, if we traded them throughout history, and not only on the brute force interval:
I do not insert quotes here, as the analyzed basis in our case is the balance graph. No matter how this quote is drawn. We will not see more in the quote than our strategy.
Imagine if we tested all our robots from the very beginning of history and further, into the future. Even though we don't have future quotes, we can still assume what will happen with 100% accuracy. Sounds like nonsense? No, it is not nonsense. First, let's imagine that we are testing robots using the entire available history of quotes. What will we see? Some confusing movements, up and down and so on. What can should we recognize here? Waves. Their shape, wavelength and amplitude are not important. It is not a sinusoid, but we don't care. What matters is that this process is periodic. Furthermore, based on my mathematical research which I presented in my previous article, the expected value of a strategy based on a random formula will tend to zero if the number of historical data tends to infinity. What is the effect of this? Based on the above assumption, we can say that any balance curve with an infinite number of deals will cross the starting balance line an infinite number of times. Even if, for some reason, the balance immediately goes up or down and stays there all the time, we can slightly shift this line down or up and find this equilibrium point, near which the balance fluctuates.
We will not take into account the formulas that lead to a pronounced gain or loss throughout history, although these variants can also be attributed to this category - it is just the positive or negative half-wave of a huge wave, which is larger than our entire history. According to these assumptions, the found patterns are only parts of positive half-waves. The larger the found part, the more likely it is that the equilibrium point is far below. According to this, if now there is a positive half-wave, then a negative one should appear soon. From the mathematical point of view, the greater the detected half-wave, the greater the probability of movement in the negative direction. And vice versa, if we detect a negative half-wave, then the larger this half-wave, the greater the probability that a positive half-wave will begin. It can be simpler: if we have a strategy with zero expected payoff throughout history, then this whole story consists of segments with negative and positive expected payoffs, which follow each other and constantly alternate. I have an Expert Advisor that implements this principle, which works for any currency pair throughout the history of quotes. So, the above assumptions are also confirmed by Expert Advisors. In general, this principle can not only be scaled, but also infinitely layered, increasing the efficiency of the system. Of course, it is possible to trade the trend continuation, but I recommend doing this only if the pattern is very pronounced and even, and trading up to 5-10% of the found pattern into the future. The risks are very high. Moreover, it is stupid to trade against math. You could try, if it were somehow possible to estimate the approximate remaining lifetime of this pattern. But this is impossible as the nature of the pattern is not clear. And even if the nature of the pattern is clear, such an analysis is extremely difficult to conduct.
How to determine the level relative to which fluctuations occur?
As for fluctuations, I will try to answer how to define the level, relative to which you the waves and their movement should be determined. The answer is very simple. There is no way to determine it. This does not mean that the level does not exist and that we cannot perform a proper trade. This level is not fixed, and it exists only in our head. It is even more important to understand the following: when the size of a half-wave tends to infinity, the ratio of the size of this half-wave to the distance of the level from the starting balance tends to infinity. In other words, the stronger the half-wave, the less we can think about where this level is, since with an increase in the number of trades this level tends to the zero point. All we need to do is to find very strong half-waves. Another fact showing the same, is that the larger and better the half-wave, the less likely it is that a wave with a comparable size can be found in the rest of the virtual test. I will try to visually show what was said in the figure:
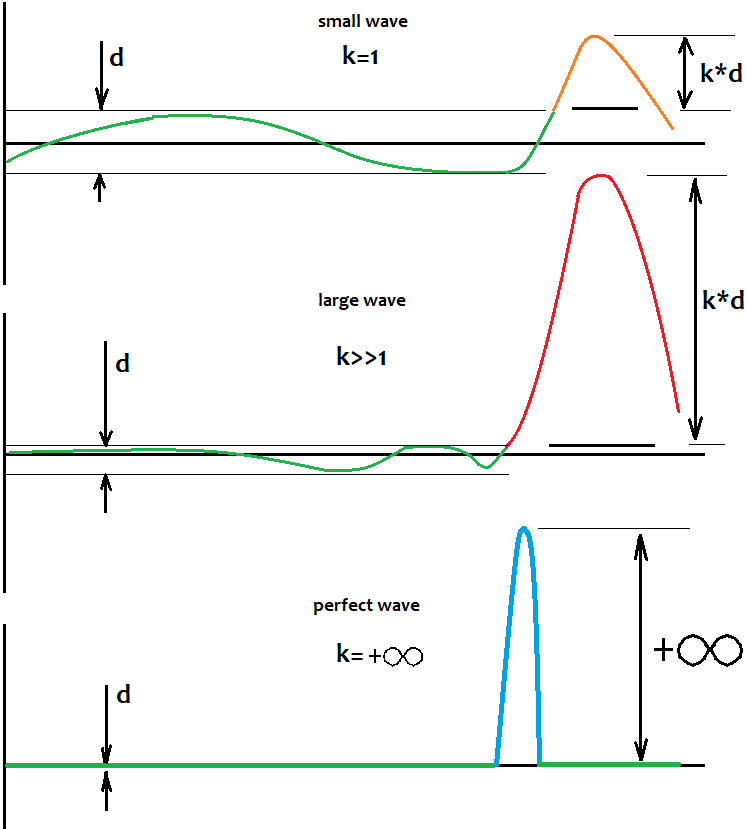
This level does not guarantee that the pattern will turn with 100% probability. More importantly, the very fact of the existence of a pattern that is part of the half-wave tells us that most likely there will be more than one such wave, and they might even exist throughout the history. In this case, there is a large chance that there will be a large pullback movement. We should try to catch it. Even when I tested various Expert Advisors that did not work on a global scale, this worked locally in a direct or inverted way. There were vivid waves and the chart was clearly structured.
To complete the picture
I will try to show how, in my opinion, these waves should be traded in the most efficient way. Let me first give you some illustrations:
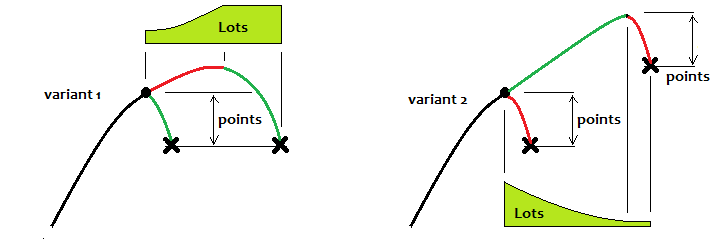
The first option is trading on the pattern reversal, and the second one is trading the continuation. If we consider the first option, then ideally you should always reach a certain level and stop the trading cycle there, and then wait for the next one. When using a partial martingale, there will be an improvement, but if it is known that the chart should soon reverse. If not, the expected payoff will still be "0". You can trade trend continuation only when the pattern is close to ideal. But this trading should be for a short time. In the second variant, in my opinion, you can use the reverse martingale. To be honest, all the strategies that I have tested prove that mathematical fact: if you trade a fixed lot and you do not know how the price will behave in the future (and this is almost never known), then the result will always be "0".
But there are situations when we accidentally catch a global pattern and it works very far. However, in my opinion, it is better not to wait for such situations. It is better to choose one trading scheme and follow it. There are no unified solutions. I have not yet had time to test this even on demo accounts, since this will take 2-3 months. There are four weeks in a month, and every weekend the two-day brute force should be run. And then it should be tested on some computer that works around the clock. I do not have possibility to do this now. Perhaps in the future, I will experiment on a demo account and make a separate signal.
Conclusion
In this article, we have made simple, but very important conclusions about the patterns and their physics as applied to the market. They are as follows: the market is not chaotic and there are many patterns hidden inside it on different periods of the charts. They overlay and create the illusion of chaos. A pattern is a periodic process that can repeat and reverse. Since the patterns are repeated, then these waves may have a limited amplitude, which can be used in trading strategies. I tried to make this article as clear as possible and to provide a minimum of mathematics. I hope that this information will help you in developing trading systems. If you have any other conclusions, please add your comments. Unfortunately, I was not able to brute force on higher timeframes because this takes too much time. If the readers are interested in deeper analysis, I am ready to continue this topic in further articles. This article provides rather a topic introduction and demonstration.
Translated from Russian by MetaQuotes Ltd.
Original article: https://www.mql5.com/ru/articles/8311
Warning: All rights to these materials are reserved by MetaQuotes Ltd. Copying or reprinting of these materials in whole or in part is prohibited.
This article was written by a user of the site and reflects their personal views. MetaQuotes Ltd is not responsible for the accuracy of the information presented, nor for any consequences resulting from the use of the solutions, strategies or recommendations described.

 Grid and martingale: what are they and how to use them?
- Free trading apps
- Over 8,000 signals for copying
- Economic news for exploring financial markets
You agree to website policy and terms of use
I just need to reply this article. Patterns are just a small piece of the overall picture.
The first degree polynomial looks better.
The ratio of optimisation period to profitability is 4 to 1, I have seen it not for the first time.
Half-waves, this is from probability theory, there are formulas for the maximum spread, the number of crossing 0, the probability of returning to 0.
Look at the link, by leaving only 1 degree you do linearisation, you can replace bruteforce with solving equations.
leaving the second degree we work with the regression channel, with the 3rd degree we start to take into account deviations within the channel.
That's how it is, without details and fanaticism.
The first degree polynomial looks better.
The ratio of optimisation period to profitability is 4 to 1, I have seen it not for the first time.
Half-waves, this is from probability theory, there are formulas for the maximum spread, the number of crossing 0, the probability of returning to 0.
Look at the link, by leaving only 1 degree you do linearisation, you can replace bruteforce with solving equations.
The classical Taylor series is made for a function of one variable, I am using a version for a function with an unlimited number of dimensions. Although to be honest I certainly use only the first degree. simply the polynomial becomes the sum of the coefficients multiplied by the price shifts at each bar. In the end, the deciding factor is not the type of formula itself, but the frequency of the search. In general, it doesn't matter, it gives the result. Further you can roll out modifications, correct something.
Hi, your work and especially your thoughts are very interesting. You wrote, that both versions mt4 and mt5 are attached. I can't find a mt5 version! ?
Please add if possible.
Many thanks