

Developing a Multi-Currency Expert Advisor (Part 31): Secrets of the Optimization Project Creation Step (I)
 36
36
 0
0

Introduction
In the previous article, we reviewed the full cycle of using the system we developed for creating multi-currency Expert Advisors based on the idea of combining many individual instances of simple trading strategies. The article turned out to be quite lengthy, but there was no other way to provide a comprehensive overview of how to use the tools we developed. However, many nuances still remained behind the scenes, and you are very likely to encounter them when using the Adwizard library. While writing our previous article, we ourselves encountered some things we did not understand, so we decided to put off analyzing the reasons behind them until later. Let's not put this off for too long.
Let's take a closer look at the intricacies of the proposed approach and examine its potential pitfalls. In this article, we will take a closer look at the step of creating optimization projects, which was Step 2 in the previous part. Some of the necessary actions at this step had already been performed in advance, and we simply used the resulting data to complete this step. Now let's take a look at how to select the optimization parameters for Expert Advisors before creating a project.
Planning Our Route
Let's start by analyzing why the database for the final Expert Advisor of the first stage was not created. To recap, here is what happened: we created three different optimization projects and ran them through the automated optimization pipeline. As a result, we expected to receive three databases for the final Expert Advisors, but we received only two. No database was created for the first project. We suspect that the most likely cause may not be related to errors in the program code. But this may not be the only reason.
Next, let's look at what preparatory work should be done before the project creation step. After all, in the previous article, we used almost everything off the shelf — the trading strategy, specific ranges of parameters to be optimized, the time frame for optimization, and other elements. And behind each such item lies a certain amount of work involved in obtaining the necessary values and justifying the validity and effectiveness of those choices.
Let's imagine that we have just implemented a new trading strategy and want to use it for automatic optimization. In other words, we will consider Step 1 of developing a trading strategy to be complete, but we have not yet begun to analyze how this strategy behaves under different input parameter values. Without at least a cursory study of this kind, it will be impossible to complete the second step. Therefore, let's perform some preliminary optimization runs of the Expert Advisor for the first optimization stage, outside the automatic optimization pipeline.
What Is Wrong with the First Project
Once the automatic optimization pipeline had completed after running three projects, we obtained the following files in the terminal's common data folder:
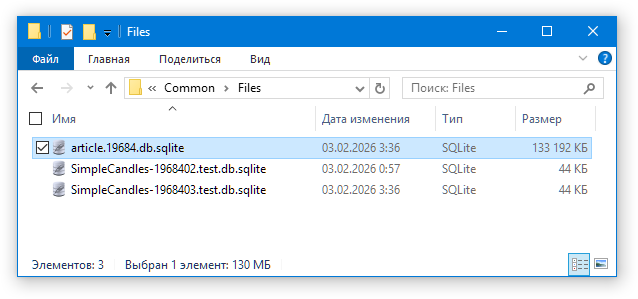
For this illustration, we specifically cleared the common folder of any other files that were unrelated to the process we are discussing. If there are other files in this folder as well, that is fine.
Let's open the optimization database, article.19684.db.sqlite, in SQLiteStudio. The creation of the final Expert Advisor database was supposed to take place during the third stage. Therefore, we need to find the record in the tasks table that corresponds to the job being executed at the third stage. Open the contents of the stages table and find the record for the first project (id_project = 1) with the third stage (expert = Stage3.ex5 or name = "Save to library"):
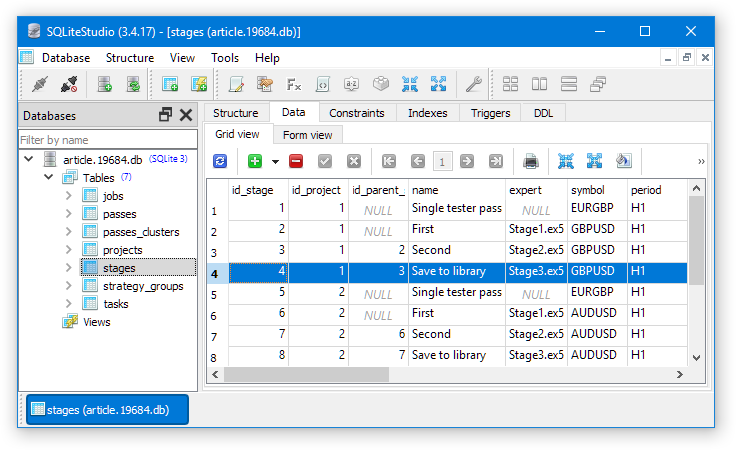
We note the row ID for the third stage (id_stage = 4), go to the jobs table, and find the job row corresponding to this stage:
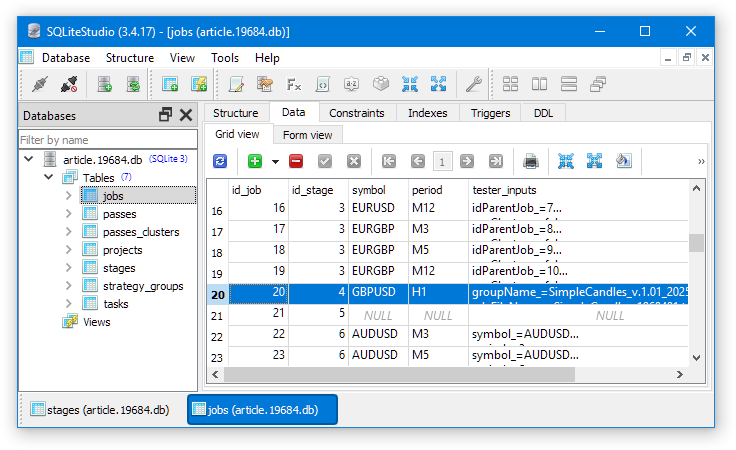
From this row, we take the job ID (id_job = 20), go to the tasks table, and find the row for the task associated with this job. In the third stage, our job consists of a single task:
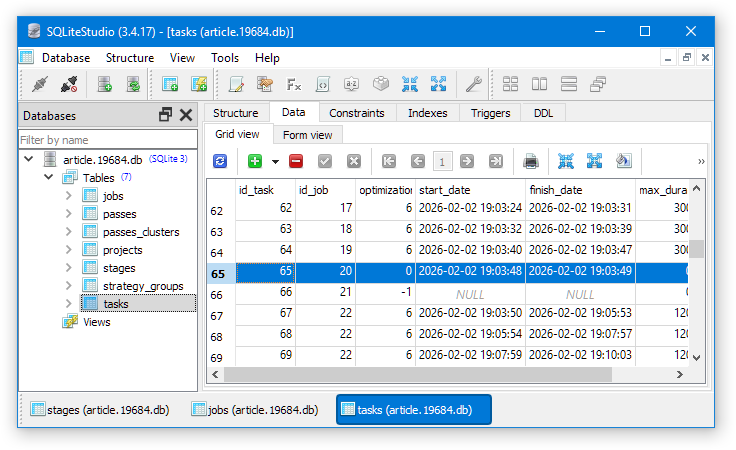
Let's look at the start and end times for this task: the difference between them is just one second. This means that the Strategy Tester did not execute a pass for the third-stage Expert Advisor, since it would have taken much longer to do so. You can verify this by looking up the entry corresponding to this task's ID (id_task = 65) in the passes table. There is no such entry.
Let's now take a look, in the same way, at the jobs and tasks for the second stage (id_stage = 3). First, we will determine the job IDs for the second stage:
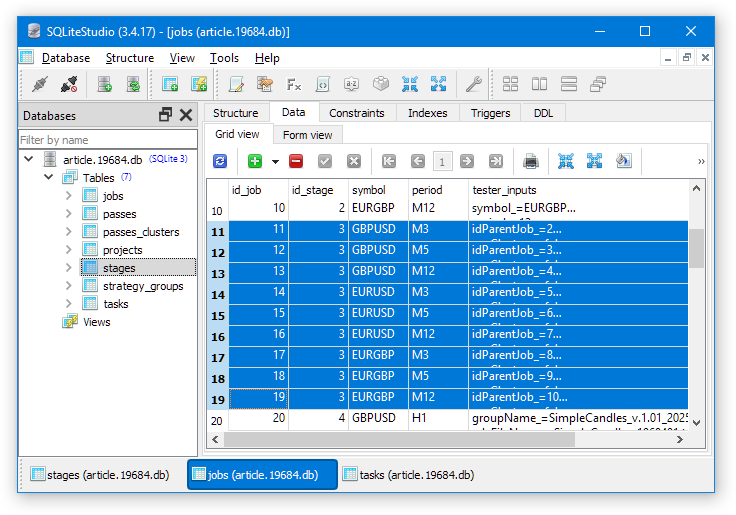
Next, we'll use them to select the tasks related to these jobs. In the second stage, we also used only one task per job:
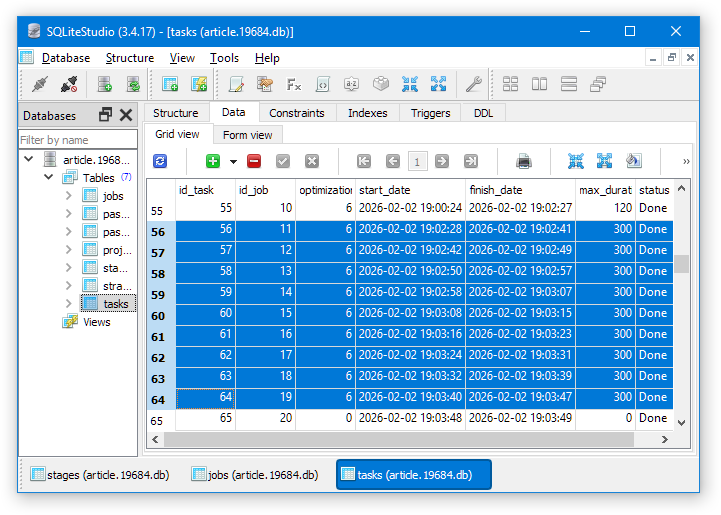
As can be seen, the execution time for these tasks was less than 10 seconds (finish_date - start_date), which is significantly less than the 300 seconds (max_duration) allocated for this stage. If you look at the passes table, you will see that it contains no passes for these tasks.
Let's move further up the sequence of stage execution and take a look at the first stage of the automatic optimization pipeline. At this stage, six optimization tasks are performed for a single job, so there will be more of them. Once we reach the tasks table — just as we did for the third and second stages — we will see the following:
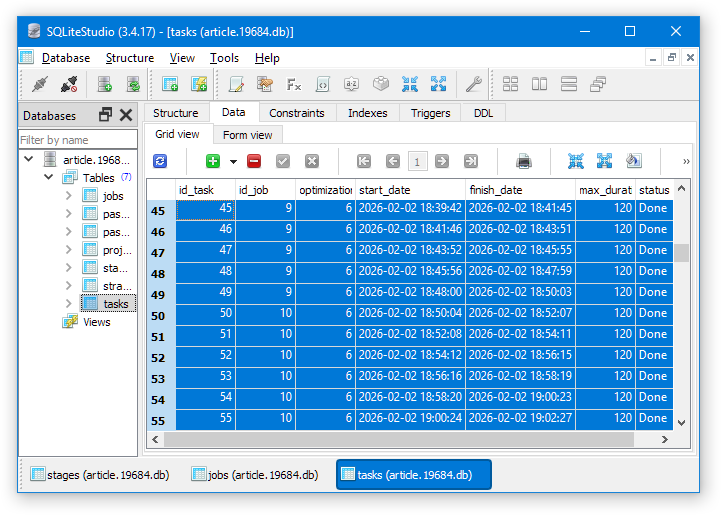
Here, the difference between the start and end times of the task corresponds to the specified maximum duration (max_duration = 120). So, at this stage, it seems everything was fine. Time to go back to the second stage.
Let's try restarting it. To do this, we need to change the status of the second stage in the database from Done (completed) to Queued (queued):
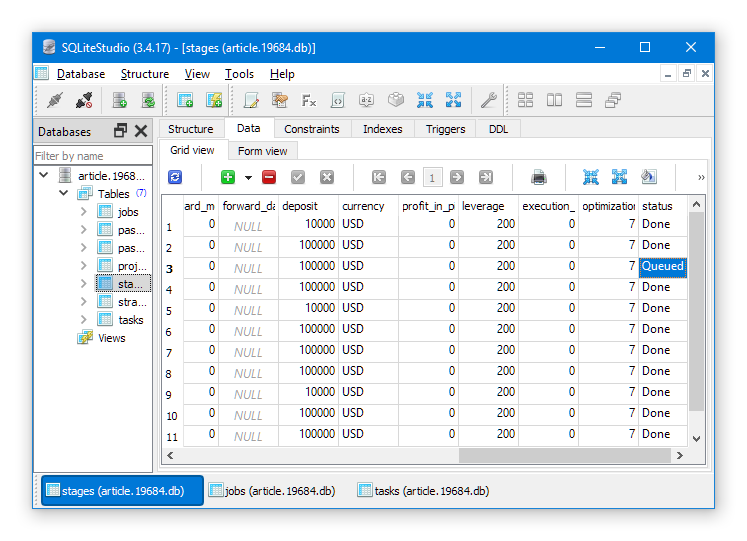
Thanks to the triggers implemented in Part 20, this change in the stage status will automatically change the status of all the jobs and tasks within that stage. They will also switch to the Queued (queued) status. Next, run the automatic optimization Expert Advisor in the terminal:
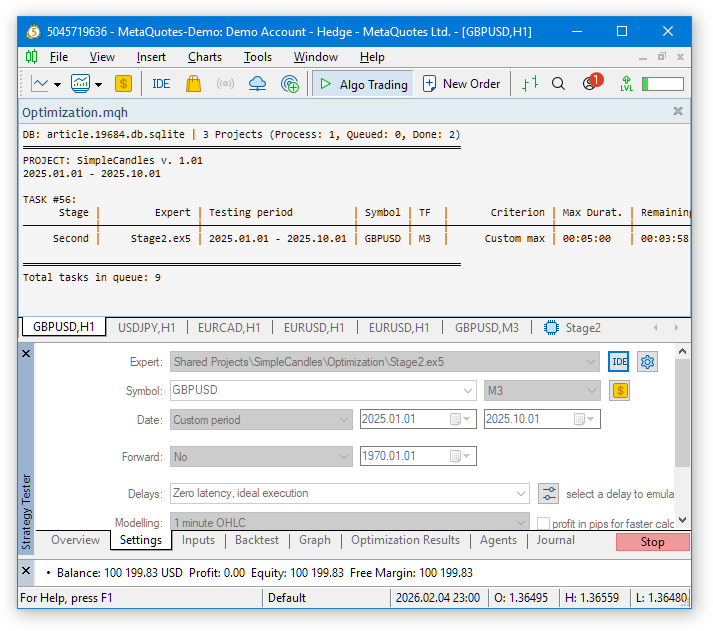
The optimization has started successfully; we can see that the total number of optimization tasks in the queue is 9 (Total tasks in queue: 9). With a time limit of 5 minutes per task, it will take approximately 45 minutes to complete all of the tasks. If you switch to the results tab for the current optimization, you will see a fairly large number of successfully completed passes with a fairly good average annual profit (ranging from USD 2000 to USD 8000 for an initial deposit of USD 10,000):
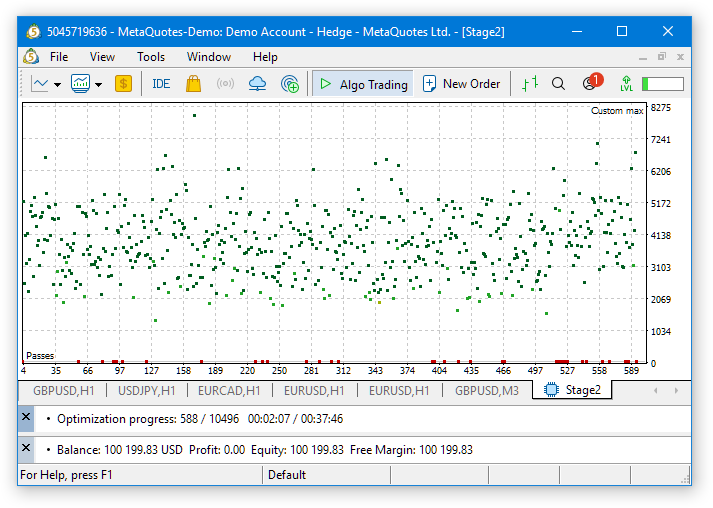
So let's wait for this restart to finish. Ultimately, the run completed successfully, and all optimization tasks were completed. You can now restart the third stage of the automatic optimization pipeline.
Let's change the status of the third stage of the first project in the stages table, just as we did a moment ago with the status of the second stage. If we have not removed the automatic optimization Expert Advisor from the terminal chart, it will immediately begin performing the assigned task. If you have already removed it, you will need to attach it to the terminal chart again. In this case, the Expert Advisor will locate the task in the queue on its own and begin executing it:
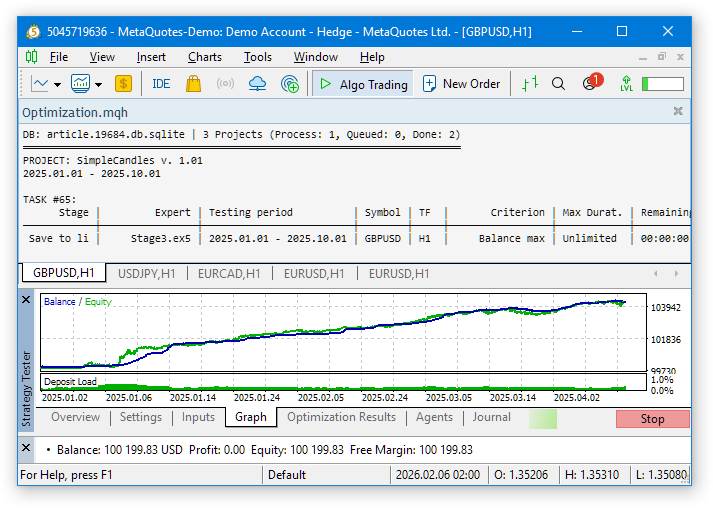
At this stage, optimization is no longer performed; instead, a single pass of the Stage 3 Expert Advisor Stage3.ex5 is started. As a result, we will have a database for the final Expert Advisor for the first project:
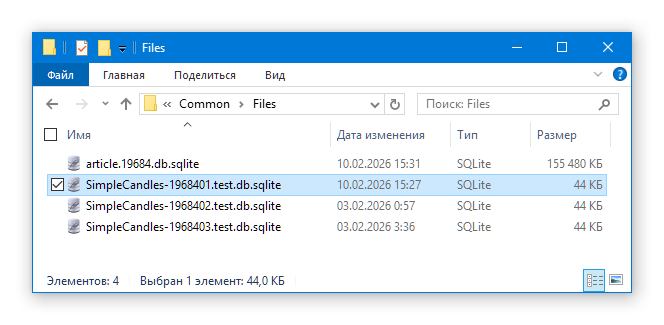
Well, we were not able to reliably determine the cause of the earlier error, but we did demonstrate which steps can help eliminate its consequences. For now, it's quite inconvenient to restart project stages. If we find ourselves needing to use this operation more often, it probably makes sense to consider implementing a more user-friendly interface. But let's not get ahead of ourselves just yet.
It is possible that the optimization at the second stage failed that time because the quote history could not be loaded from the MetaQuotes servers. Reports of such errors were appearing on the MQL5 forum at that time. Or perhaps some other bug in the latest beta version at the time — one that has already been fixed in the current beta version used now — played a role. At that time, very intensive work was underway to implement new features in the terminal, and new beta versions were being released almost every day.
There were also a couple of instances where the optimization Expert Advisor attempted to interrupt the current optimization process once the allotted time had elapsed, but the terminal entered a state where it was impossible to stop the optimization. The "Stop" button duly changed into the "Start" button, but the optimization continued. The Expert Advisor's attempts to start a new optimization failed. After the testing agents were forcibly restarted, the problem did not recur, so it is unclear how it can be prevented in the future. It is quite possible that it will not occur at all in newer builds.
In any case, we can always rerun the required stage of the project's automatic optimization. However, as it turned out, we cannot restart the execution of a single fixed task in this way by changing its status to Queued. The fact is that when we were developing triggers to automatically change the statuses of child objects when the statuses of parent objects changed, this scenario was not taken into account. Therefore, the trigger required for this work has not yet been implemented. We will add it later or implement the necessary status changes using tools external to the database.
Testing the Final Expert Advisor
Let's see what results the final Expert Advisor will produce for the first project. To do this, we will need to perform the following steps:
- Check the name of the final Expert Advisor for the first project and the magic number set in its default parameters. We named it SimpleCandles-MQ-100K-10.mq5, and its magic number is set to 1968401.
- Rename or copy the final Expert Advisor's database to a file named according to the following template: <Expert_Advisor_name_without_extension>-<magic_number>.test.sqlite, that is,
- SimpleCandles-MQ-100K-10-1968401.test.db.sqlite
- Compile the final Expert Advisor if this has not already been done.
- Run testing to evaluate the results.
In the first project, we set the maximum calculated drawdown to 10% and enabled the use of all funds available in the trading account for trading. At the same time, the Risk Manager and Close Manager are enabled, but their parameters are set with a significant margin. For example, the maximum daily loss is 20%. This value should not be reached if market conditions continue to resemble those observed during the optimization interval. For the Close Manager, we set the total profit threshold at which all positions are closed and trading resumes from scratch to 200%.
The test results for the period from January 1, 2025, to October 1, 2025, using the default settings were as follows:

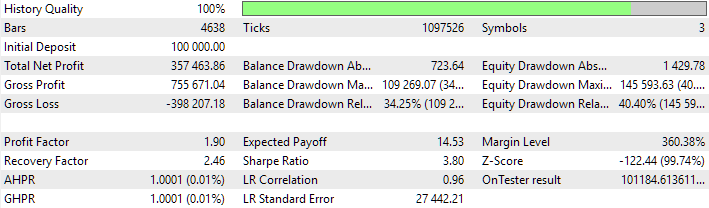
As you can see, the drawdown was more than 40% instead of the expected 10%. This is the effect of the Close Manager and the risk manager. The risk manager closed all positions on April 9, 2025, after a profit of 200% of the initial balance of USD 100,000 was achieved. This point in time for starting trading turned out to be unfortunate, which led to the risk manager being triggered several times and closing positions when the drawdown exceeded 20% before the start of the next day. This behavior will be the subject of further research, since we previously used the risk manager in situations where the deposit growth was in the single-digit percentage range, rather than in the hundreds. It is possible that adjustments will need to be made to its operation.
When both the risk manager and the Close Manager are disabled — or just the latter — the results look closer to what was expected:
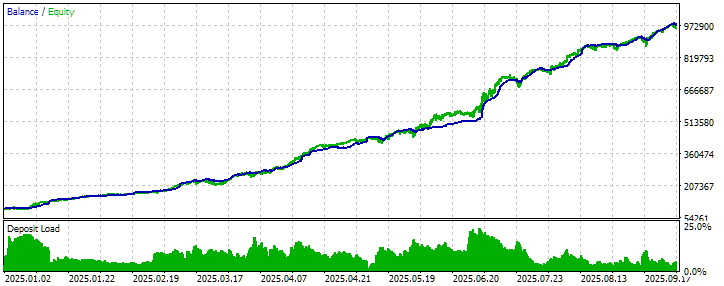
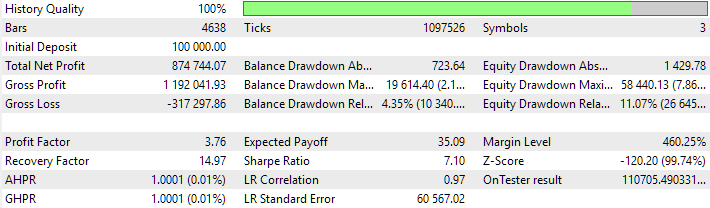
The drawdown here is only slightly higher: 11% instead of 10%. This difference is most likely due to the fact that, during normalization at the third stage, a fixed-lot mode was used (more precisely, a fixed deposit amount allocated for calculating lot sizes), whereas now we tested in a variable-lot mode (the entire growing account balance was available to the Expert Advisor for calculating position sizes).
Launching the Final Expert Advisor
To run the final Expert Advisor on a trading account, we will need to perform similar steps:
- Rename or copy the final Expert Advisor database to a file named <EA_name_without_extension>-<magic_number>.sqlite, that is, SimpleCandles-MQ-100K-10-1968401.db.sqlite
- Compile the final Expert Advisor if this has not already been done.
- Copy the compiled Expert Advisor to the Experts folder of the terminal in which it is to run. This step is not necessary if the compilation was already performed in the terminal installation where the Expert Advisor is intended to run.
- Run it on a terminal chart for any symbol and timeframe using the default settings.
It is worth noting once again that, if you wish to change the parameters of the final Expert Advisor, it is recommended to do so not in the parameter setup dialog, but in the Expert Advisor's source code. This is a more reliable method, and it's always available, since we have full access to the source code of the final Expert Advisor.
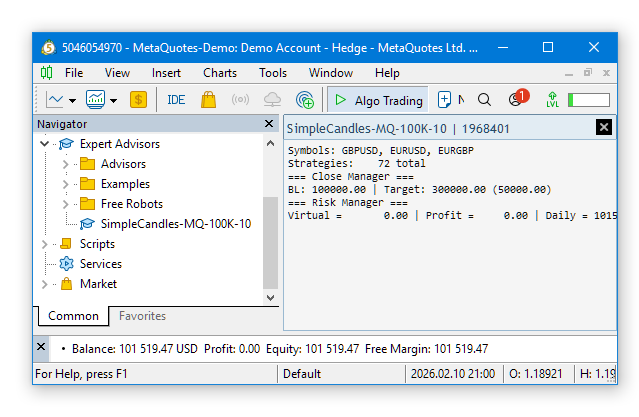
To continue monitoring multiple terminals running the final Expert Advisors, you can use the MT5 Manager project’s web interface, available in the MQL5 Algo Forge repository. At this stage, we will be able to see something like this for the three running terminals:
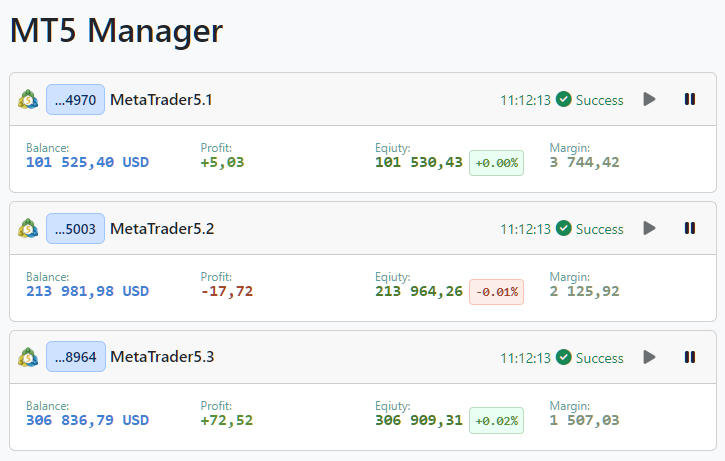
Let's now move on to the second part we outlined — examining the preliminary work for the step of creating an optimization project.
Trading Strategy
First of all, let's recall the essence of the model trading strategy being used. You can read more about it in Part 24, but in short, it can be summarized as follows:
The Expert Advisor runs on a specific symbol and timeframe
Set the input parameters:
- Symbol
- Timeframe for counting unidirectional candles
- Number of unidirectional candles (signalSeqLen)
- ATR period (periodATR)
- Stop Loss (in points or as a fraction of ATR) (stopLevel)
- Take Profit (in points or as a fraction of ATR) (takeLevel)
- Maximum number of simultaneously open positions (maxCountOfOrders)
- Position size
When a new bar appears, we check the directions of the last signalSeqLen closed candles.
If the directions are the same and the number of open positions is less than maxCountOfOrders, then:
- Calculate StopLoss and TakeProfit. If periodATR = 0, we simply offset the current price by the number of points specified in the stopLevel and takeLevel parameters. If periodATR > 0, we calculate the ATR value using the periodATR parameter for the daily timeframe. We offset the current price by ATR * stopLevel and ATR * takeLevel.
- We open a SELL position if the candles were directed upward, and a BUY position if the candles were directed downward. When opening a position, we set the previously calculated StopLoss and TakeProfit levels.
This strategy is implemented and included in the Expert Advisor for the first stage of the automatic optimization pipeline in the SimpleCandles project repository, in the Optimization/Stage1.mqh file. In this file, for now, we are only interested in the section that defines the strategy's input parameters:
//+------------------------------------------------------------------+
//| 4. Input parameters for the strategy                             |
//+------------------------------------------------------------------+
sinput string     symbol_              = "";    // Symbol
sinput ENUM_TIMEFRAMES period_         = PERIOD_CURRENT;   // Timeframe for candles

input group "===  Open signal parameters"
input int         signalSeqLen_        = 6;     // Number of candles in the same direction
input int         periodATR_           = 0;     // ATR period (if 0, then TP/SL in points)

input group "===  Pending order parameters"
input double      stopLevel_           = 25000; // Stop Loss (as a fraction of ATR or in points)
input double      takeLevel_           = 3630;  // Take Profit (as a fraction of ATR or in points)

input group "===  Money management parameters"
input int         maxCountOfOrders_    = 9;     // Maximum number of simultaneously open orders
input int         maxSpread_           = 100;   // Maximum allowable spread (in points)
To create an optimization project, we need to select reasonable values or value ranges for each parameter. Let's go through them and analyze each one.
- symbol_ — symbol. This parameter does not change during a single optimization run, since we will run a separate optimization process for each symbol. Therefore, for this purpose, we need to select the symbols that we plan to include in the final Expert Advisor. For example, for our first project, we selected three symbols: GBPUSD, EURUSD, and EURGBP. Let's first look at the first one — GBPUSD.
- period_ — the timeframe for candles. This parameter also does not change during a single optimization run, so we need to select some values for it in advance as well. Based on the core concept of the trading strategy, let’s take, for example, a few relatively short timeframes so that signals for opening positions appear more frequently. Of course, we cannot know for sure in advance which timeframes will turn out to be more profitable. But that is precisely why we need this preliminary analysis of the optimization results, which we will perform before creating the automated optimization project. Let's look at the Expert Advisor's performance on the M5 timeframe.
- signalSeqLen_ — the number of unidirectional candles. For this parameter, it already makes sense to iterate over several values during optimization. To determine a reasonable range, we can, for example, collect statistics on the number of series of unidirectional candles of different lengths. To do this, we even created a utility tool in Part 26. Its results show that most series across different timeframes range in length from 2 to 8. Therefore, let's use exactly this range for this parameter, with a step of 1.
- periodATR_ — ATR period (if 0, then TP/SL in points). Here, we need to clearly decide whether we will use ATR or not, since this will determine the allowed ranges for the next two parameters — SL and TP. Since price movement in points can have different absolute values for different symbols, it seems more convenient to use ATR as a measure of the movement range for a given symbol and to set the SL and TP sizes relative to that estimate. The strategy's source code uses the D1 timeframe to calculate ATR, so let's start by using a wide range from 28 to 210 days with a step size of 2 to smooth out short-term spikes in ATR.
- stopLevel_ — Stop Loss (as a fraction of ATR or in points). We do not really have any specific assumptions about which values will yield good results. So let's start with a very small fraction of ATR and work our way up to a certainly large fraction that will result in very rare SL triggers. For example, from 0.01 to 20 in increments of 0.01.
- takeLevel_ — Take Profit (as a fraction of ATR or in points). As with the previous parameter, let's choose a wide range of values with a small step size. For example, from 0.01 to 10 in increments of 0.01. We set the maximum value a bit lower so that, on average, the parameter combinations would more often include a TP that is smaller than the SL, while the opposite situation could also occur.
- maxCountOfOrders_ — the maximum number of simultaneously open orders. There is not much clarity regarding this parameter either, so we will arbitrarily set a range of values from 1 to 10 with a step size of 1.
- maxSpread_ — maximum allowable spread (in points). We added this parameter after the trading strategy had already been implemented to demonstrate how to add a new parameter. Therefore, it will not have any significant impact on the optimization. Let's set it to a value large enough that the spread is always considered acceptable — for example, 100 points.
Having selected these initial ranges for the strategy's input parameters for optimization, let's proceed to check how acceptable this choice is.
Preliminary Testing
Let's open the Strategy Tester, select genetic optimization for the first-stage Expert Advisor over the time interval from 2025.01.01 to 2025.10.01 (9 months), and enter the values selected above into the parameters:
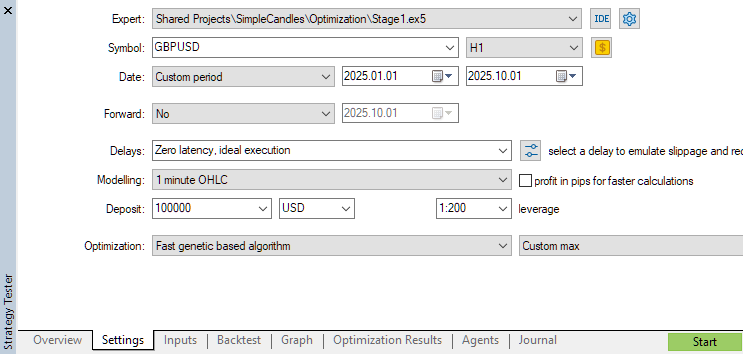
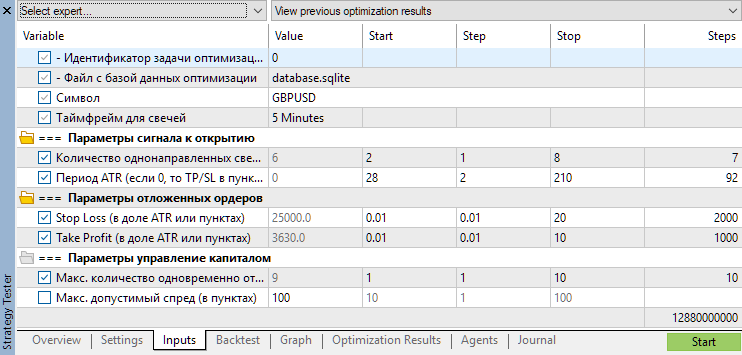
In addition to the trading strategy parameters discussed, we see two more parameters at the top that were added in the first-stage Expert Advisor: the optimization task ID and the optimization database file. We will only need them when we run the automatic optimization pipeline; for now, we can just ignore them.
Let's run the optimization and monitor the results for a while. We did not have to wait long, and the optimization was completed in less than 5 minutes. Let's first take a look at a visualization of the results:
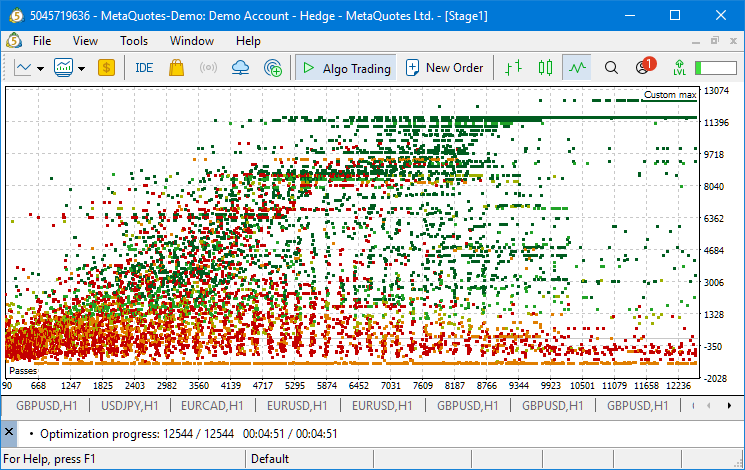
As a reminder, the optimization criterion was a custom criterion, for which we used the normalized profit obtained at a 10% drawdown on a USD 10,000 deposit over one year of trading. If the optimization period is less than one year, the criterion value is still extrapolated to one year.
The figure shows that this metric ranged from -USD 1000 to USD 13,000. Values close to the maximum began to appear after approximately one-third of all passes had been completed. This suggests that it is possible to reduce the optimization time while maintaining the quality of the results obtained.
We see many dark green dots, that is, dots that indicate a pass with a fairly large number of trades. However, there are also red dots located high on the chart, indicating a pass in which, despite a good result, few trades were executed; therefore, there are doubts as to whether this achievement is actually due to the trading strategy or simply luck.
Let's now take a look at the numerical characteristics of the best passes.
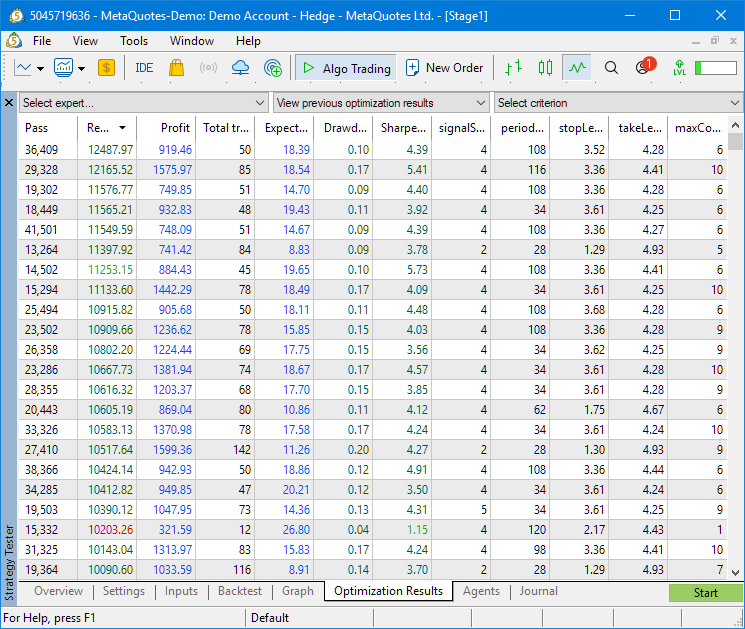
Based on these results, we can also draw some additional conclusions:
- The values of the maxCountOfOrders_ parameter are generally closer to the upper limit of its range (toward 10). One of the passes where this parameter is 1 is shown in red, since it involved only 12 trades. Its Sharpe ratio is significantly lower than that of the neighboring passes, so we can probably fix this parameter at 10 and remove it from the optimization.
- Passes with significantly different values of the periodATR_ parameter may produce results with roughly the same characteristics. Therefore, this parameter is also a candidate for removal from the list of optimized parameters. Let's try setting its value to 28 in the next iteration.
- It can be seen that for the best passes, the takeLevel_ value is slightly greater than stopLevel_. There also do not appear to be any good results where these values are less than 1.0. Therefore, you can adjust the ranges for these parameters — for example, to the range from 1.0 to 5.0, using the same increment of 0.01.
- For the best passes, the signalSeqLen_ parameter generally took only two values: 4 and 5. So we can limit the range of values for this parameter to just these two.
However, before applying these changes to the ranges, let's run some tests on another symbol: EURUSD. For this symbol, the results turned out slightly differently:
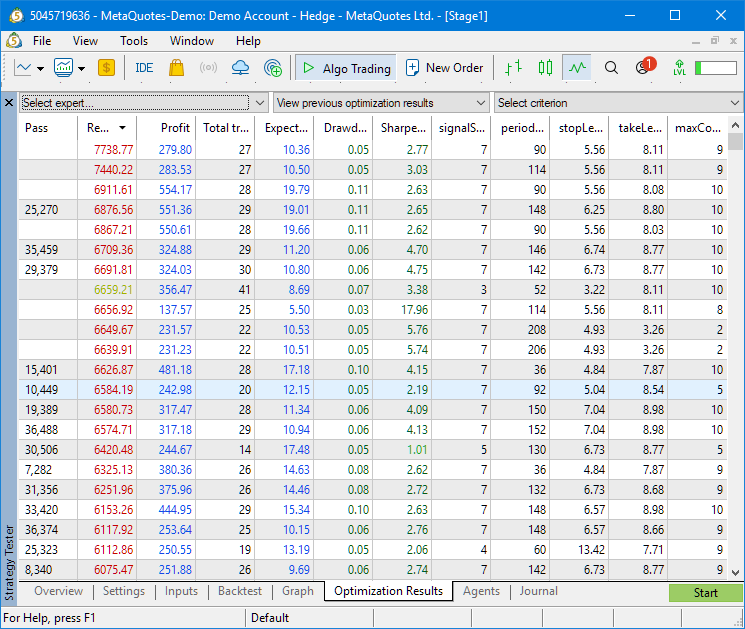
Here, different values for the takeLevel_, stopLevel_, and signalSeqLen_ parameters ended up among the best passes. Therefore, it is probably better not to restrict them as we had intended based solely on analyzing the GBPUSD optimization results. It is also evident that the number of trades in the passes is rather low. This is due to the large SL and TP values for the positions being opened. Therefore, you should not set too high a value for the minimum number of trades in the parameters for selecting passes for the second stage of optimization. Otherwise, almost none of the EURUSD passes will make it to the second stage. For now, it is recommended to set it to no more than 20.
When optimizing for EURGBP, the results were even less impressive:
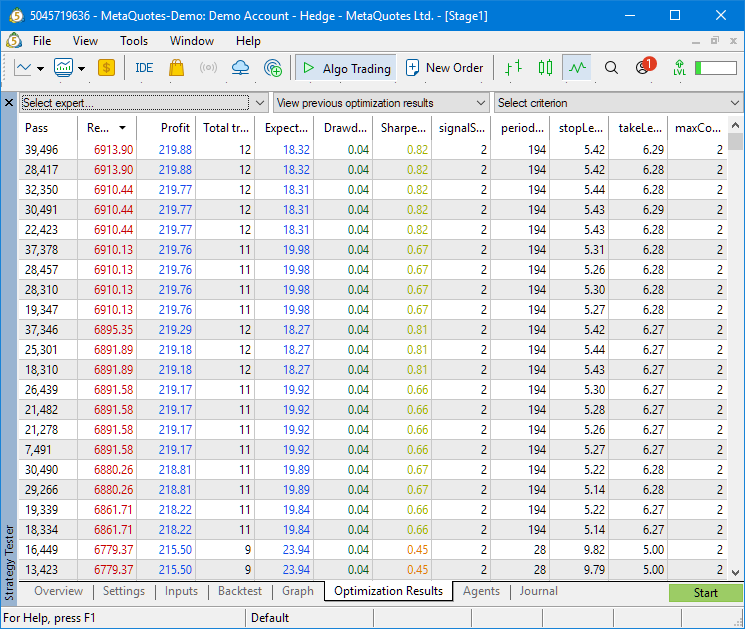
Here, the optimizer found a single maximum of the optimization criterion. To prevent the optimization from getting stuck in local maxima, we will limit the optimization time and run it several times with the same parameters.
Let's try to find a compromise in the range adjustments for all three symbols and re-run the optimization on them. Here are the parameter ranges we set:
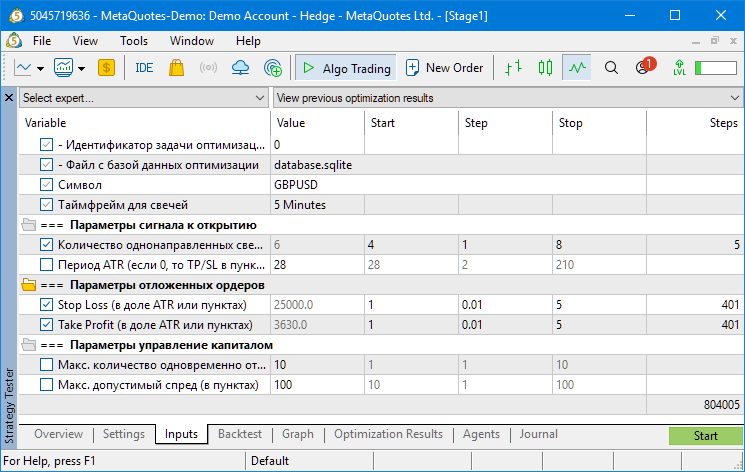
As a result, we are left with only three parameters to optimize.
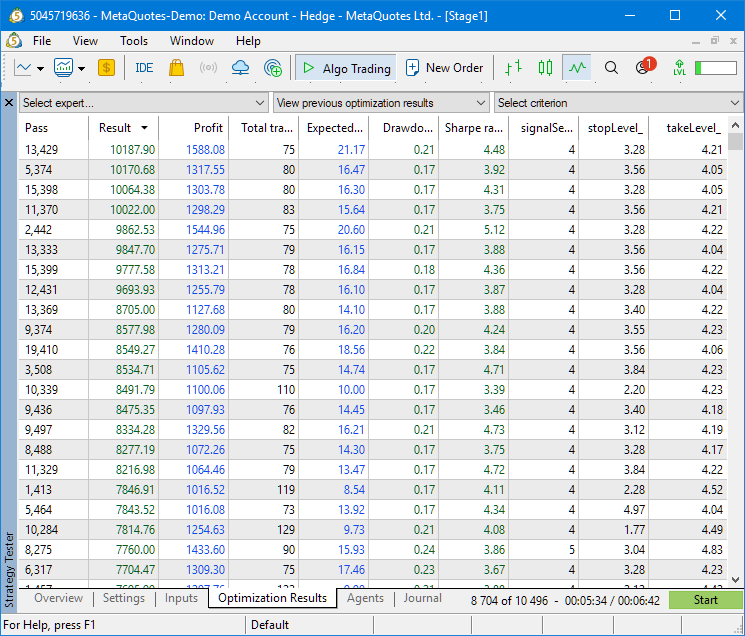
Let's see what the results of the trial optimization look like for the three selected symbols with these settings.
GBPUSD:
EURUSD:
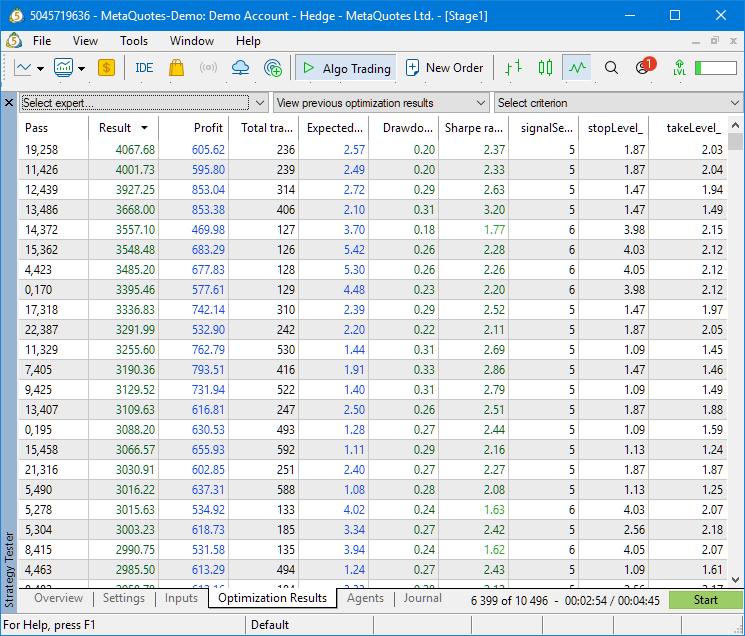
EURGBP:
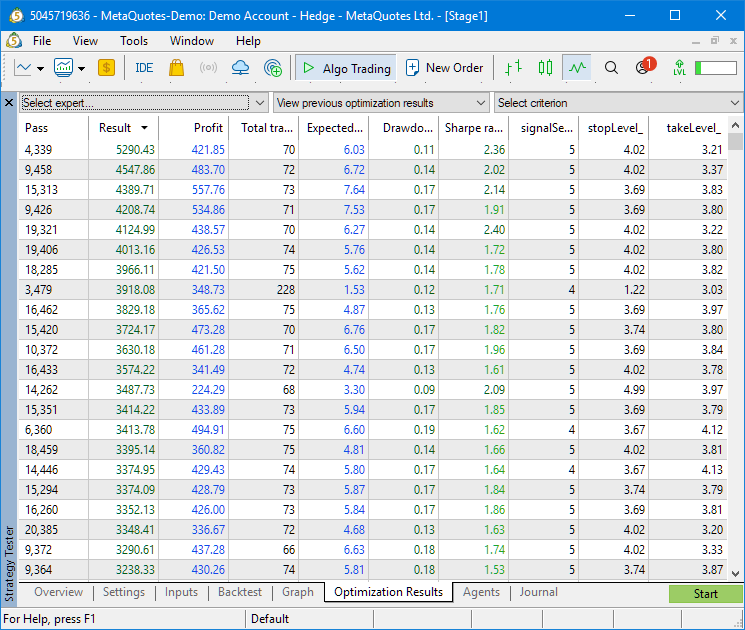
All in all, it is pretty good. The number of trades increased where it had previously been low. The Sharpe ratio is reaching encouraging levels. If we are satisfied with this variety of good pass results, we can move on to transferring these optimization parameters to the project. If not yet, we can continue adjusting the ranges and evaluating the new results obtained until we achieve the desired outcome.
Let's assume that we are satisfied with these optimization parameters.
Transferring Optimization Parameters to the Project
Let's start by copying the optimization parameters from the Strategy Tester. To do this, simply click in the Strategy Tester, go to the Inputs tab, and press Ctrl + C (copy to the clipboard). It will contain the following text:
idTask_=0
fileName_=database.sqlite
symbol_=EURUSD
period_=5
; ===  Open signal parameters
signalSeqLen_=6||4||1||8||Y
periodATR_=28||28||2||210||N
; ===  Pending order parameters
stopLevel_=25000.0||1||0.01||5||Y
takeLevel_=3630.0||1||0.01||5||Y
; ===  Money management parameters
maxCountOfOrders_=10||1||1||10||N
maxSpread_=100||10||1||100||N
As you might guess, each line contains information about one parameter, or a comment if the line begins with the ";" character. Parameters that can participate in optimization have several values on their line, separated by the "||" combination. The first value is the default value of the parameter, followed by the minimum value, the step size, the maximum value, and the letter Y or N, indicating whether this parameter participates in optimization (Y means it does, N means it does not).
We need to discard the first two lines, since these parameters will be set automatically:
symbol_=EURUSD
period_=5
; ===  Open signal parameters
signalSeqLen_=6||4||1||8||Y
periodATR_=28||28||2||210||N
; ===  Pending order parameters
stopLevel_=25000.0||1||0.01||5||Y
takeLevel_=3630.0||1||0.01||5||Y
; ===  Money management parameters
maxCountOfOrders_=10||1||1||10||N
maxSpread_=100||10||1||100||N
In the remaining part, we have two placeholders where different values will need to be substituted when the automatic optimization pipeline is launched:
symbol_=EURUSD
period_=5
; ===  Open signal parameters
signalSeqLen_=6||4||1||8||Y
periodATR_=28||28||2||210||N
; ===  Pending order parameters
stopLevel_=25000.0||1||0.01||5||Y
takeLevel_=3630.0||1||0.01||5||Y
; ===  Money management parameters
maxCountOfOrders_=10||1||1||10||N
maxSpread_=100||10||1||100||N
This template must be transferred to the optimization project creation file Optimization/CreateProject.1968401.mq5, into the paramsTemplate1() function, and formatted as a string constant into which a string value with the symbol name and a number representing the timeframe will be substituted:
// Optimization Parameter Template for the First Stage
string paramsTemplate1(COptimizationProject *p) {
   string params = StringFormat(
                      "symbol_=%s\n"
                      "period_=%d\n"
                      "; ===  Open signal parameters\n"
                      "signalSeqLen_=6||4||1||8||Y\n"
                      "periodATR_=28||28||2||210||N\n"
                      "; ===  Pending order parameters\n"
                      "stopLevel_=25000.0||1||0.01||5||Y\n"
                      "takeLevel_=3630.0||1||0.01||5||Y\n"
                      "; ===  Money management parameters\n"
                      "maxCountOfOrders_=10||1||1||10||N\n"
                      "maxSpread_=100||10||1||100||N\n",
                      p.m_symbol, p.StringToTimeframe(p.m_timeframe));
   return params;
}
As a reminder, the project creation file can be named arbitrarily; we simply used a file that already existed in the repository.
The changes made concern setting the parameters for individual optimization runs of the first-stage Expert Advisor in the Strategy Tester. Now we also need to specify the parameters that apply to the first stage as a whole.
Configuring the general parameters of the first stage
These parameters are specified in the same file used to create the optimization project (Optimization/CreateProject.1968401.mq5). Here is what they look like in the source code:
sinput group "::: Stage 1. Search"
sinput string   stage1ExpertName_ = "Stage1.ex5";     // - Stage Expert Advisor
sinput string   stage1Criterions_ = "6,6,6,6,6,6";    // - Optimization criteria for tasks
sinput long     stage1MaxDuration_ = 120;             // - Max. task duration (s)
Let's look at each parameter:
- stage1ExpertName_ — stage Expert Advisor. The name of the compiled Expert Advisor file for the first stage. We used the name Stage1.mq5 in the project repository for this Expert Advisor, so after compilation, the file will be named Stage1.ex5. In principle, there is no particular reason to change it from project to project. Therefore, you can leave this parameter unchanged.
- stage1Criterions_ — optimization criteria for tasks. This parameter must contain one or more digits in the range from 0 to 7, separated by commas. It performs two tasks at once.
First, the number of digits determines how many times the optimization process will run for a single set of input parameters. In this example, we have six comma-separated values. This means that when the first stage is launched, each of its jobs — that is, a group of tasks corresponding to one possible symbol/timeframe combination — will consist of six tasks.
Second, the digits specify the optimization criterion used for each optimization task. Currently, they are all the same and equal to 6, which means the custom criterion (Custom max) is used. The other values are listed in the table:
Early in the project, we used different criteria within a single job. This increased the variety of parameter combinations obtained in various optimization processes. However, after developing the normalized average annual profit criterion, we gradually switched to using only this criterion. It also provides sufficient diversity.Value Criterion 0 Balance max 1 Profit factor max 2 Expected payoff max 3 Drawdown min 4 Recovery factor max 5 Sharpe ratio max 6 Custom max 7 Complex criterion max - stage1MaxDuration_ — the maximum duration of tasks in seconds. Trial runs on the available testing agent resources allow us to estimate the time required for a single optimization process (or optimization task). By watching the process in real time, you can see that fairly good results appear much earlier than the Strategy Tester decides to stop the optimization. Therefore, we can reduce the total duration of the first stage of automatic optimization by limiting the execution time of a single task. You can do this by specifying a number greater than 0 for this parameter. If 0 is specified, this means there is no time limit.
Based on the results of our trial runs, we decided to limit the time to two minutes, that is, 120 seconds.
At this point, the preliminary work of configuring the parameters for the first stage of the project can be considered complete.
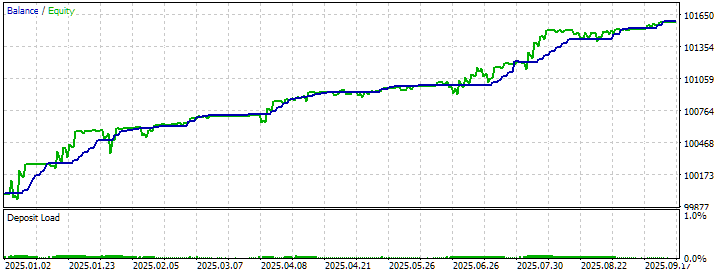
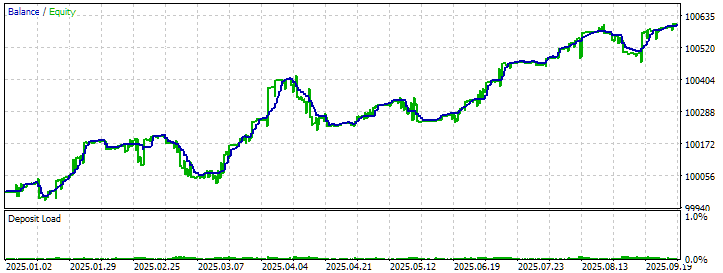
Finally, let's take a look at the charts of a few random passes from the optimization results we obtained earlier.
GBPUSD:
EURUSD:
EURGBP:
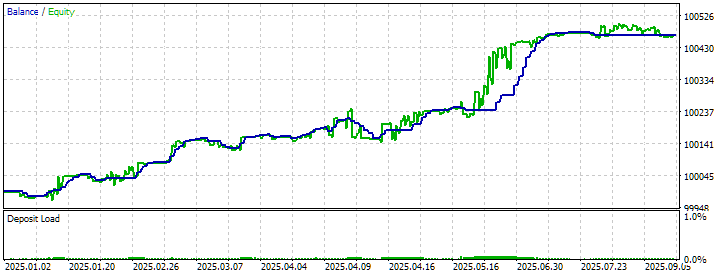
The GBPUSD chart looks better than the others. EURUSD and EURGBP experience periods of decline and growth, but overall they are trending upward. Moreover, their periods of decline do not always coincide exactly. This is precisely what makes it possible to improve trading results by combining the operation of the trading strategy across several instruments simultaneously, thereby increasing robustness.
Conclusion
In this article, we took an in-depth look at two important aspects of working with the Adwizard library that might otherwise go unnoticed. First, we ran into a practical problem: the absence of a database for the final Expert Advisor for the first project after the optimization pipeline had run. The analysis showed that the cause lay in a failure at the second stage: the optimization tasks completed almost instantly, without having time to perform a single pass in the Strategy Tester. Although we were unable to determine the exact root cause (possible reasons include temporary issues with loading quote history as well as specific behavior of beta versions of the terminal), we demonstrated a possible recovery method.
Second, and far more importantly, we examined in detail the preparatory work that precedes the creation of an optimization project. Successful use of the automatic optimization pipeline requires preliminary analysis aimed at identifying undesirable effects. For example, simply setting “broad” parameter ranges often leads to inefficient use of computational resources and getting stuck at local maxima, while different trading instruments may exhibit fundamentally different behavior with the same strategy parameters.
Preliminary manual optimization helps identify redundant optimizable parameters, thereby reducing the dimensionality of the task and improving the quality of the final results. Striking a balance between the variety of passes and their statistical significance requires adjusting the parameter ranges to achieve a reasonable minimum number of trades.
But we have not yet finished reviewing the project creation step. The project comprises three stages. In this article, we have discussed the preparation of parameters for only the first of these. In the next parts, we will move on to preparing the parameters for the second and third stages.
Thank you for your attention, and see you next time!
Important Warning
All results presented in this article and in all previous articles in the series are based solely on historical testing data and do not guarantee any profit in the future. Work on this project is research-oriented. All published results may be used by anyone at their own risk.
| # | Name | Version | Description | Latest changes |
|---|---|---|---|---|
| SimpleCandles | Project working folder (inside MQL5/Shared Projects) | |||
| 1 | SimpleCandles-MQ-100K-10.mq5 SimpleCandles-MQ-200K-07.mq5 SimpleCandles-MQ-300K-05.mq5 | 1.05 | Final Expert Advisors for running multiple groups of model strategies in parallel. The parameters will be taken from the built-in group library. There may be more groups, and each can be used as a template | Part 30 |
| └ Optimization | Project optimization Expert Advisors folder | |||
| 2 | CreateProject.1968401.mq5 CreateProject.1968401.mq5 CreateProject.1968401.mq5 | 1.06 1.05 1.05 | A script Expert Advisor for creating a project with optimization stages, jobs, and tasks | Part 31 |
| 3 | Optimization.mq5 | 1.03 | Expert Advisor for automatic project optimization | Part 29 |
| 4 | Stage1.mq5 | 1.04 | Expert Advisor for optimizing a single instance of a trading strategy (Stage 1) | Part 30 |
| 5 | Stage2.mq5 | 1.04 | Expert Advisor for optimizing a group of trading strategy instances (Stage 2) | Part 30 |
| 6 | Stage3.mq5 | 1.04 | Expert Advisor that saves the generated normalized group of strategies to the Expert Advisor database under a specified name | Part 30 |
| └ Strategies | Project strategies folder | Part 25 | ||
| 7 | SimpleCandlesStrategy.mqh | 1.03 | SimpleCandles trading strategy class | Part 30 |
| Adwizard | Adwizard library folder (inside MQL5/Shared Projects) | |||
| └ Base | Base classes from which other project classes inherit | |||
| 8 | Advisor.mqh | 1.04 | Base Expert Advisor class | Part 10 |
| 9 | Factorable.mqh | 1.06 | Base class for objects created from a string | Part 28 |
| 10 | FactorableCreator.mqh | 1.00 | Creator class that maps names to static constructors of CFactorable-derived classes | Part 24 |
| 11 | Interface.mqh | 1.01 | Base class for visualizing various objects | Part 4 |
| 12 | Receiver.mqh | 1.04 | Base class for converting open volumes into market positions | Part 12 |
| 13 | Strategy.mqh | 1.04 | Base class of a trading strategy | Part 10 |
| └ Database | Files for working with all types of databases used by the project's Expert Advisors | |||
| 14 | Database.mqh | 1.13 | Class for working with a database | Part 29 |
| 15 | db.adv.schema.sql | 1.00 | Database schema for the final Expert Advisor | Part 22 |
| 16 | db.cut.schema.sql | 1.00 | Schema of the reduced optimization database | Part 22 |
| 17 | db.opt.schema.sql | 1.06 | Optimization database schema | Part 29 |
| 18 | Storage.mqh | 1.01 | Class for working with the Key-Value store for the final Expert Advisor in the Expert Advisor database | Part 23 |
| └ Experts | Files containing common components used by different types of Expert Advisors | |||
| CreateProject.mqh | 1.07 | Library file for the script Expert Advisor for creating a project with optimization stages, jobs, and tasks | Part 30 | |
| 19 | Expert.mqh | 1.24 | Library file for the final Expert Advisor. Group parameters can be retrieved from the Expert Advisor database | Part 28 |
| 20 | Optimization.mqh | 1.06 | Library file for the Expert Advisor that manages running optimization tasks | Part 29 |
| 21 | Stage1.mqh | 1.19 | Library file for the single-instance trading strategy optimization Expert Advisor (Stage 1) | Part 23 |
| 22 | Stage2.mqh | 1.04 | Library file for the trading strategy instance group optimization Expert Advisor (Stage 2) | Part 23 |
| 23 | Stage3.mqh | 1.04 | Library file for an Expert Advisor that saves the generated normalized group of strategies to the Expert Advisor database with a specified name | Part 23 |
| └ Optimization | Classes responsible for automatic optimization | |||
| 24 | OptimizationJob.mqh | 1.00 | Class for handling an optimization project stage | Part 25 |
| 25 | OptimizationProject.mqh | 1.00 | Class for the optimization project | Part 25 |
| 26 | OptimizationStage.mqh | 1.00 | Class for an optimization project stage | Part 25 |
| 27 | OptimizationTask.mqh | 1.01 | Class for an optimization task (for creation) | Part 29 |
| 28 | Optimizer.mqh | 1.04 | Class for the automated project optimization manager | Part 29 |
| 29 | OptimizerTask.mqh | 1.06 | Class for an optimization task (for the pipeline) | Part 29 |
| └ Strategies | Sample trading strategies used to demonstrate how the project works | |||
| 24 | HistoryStrategy.mqh | 1.00 | Trading strategy class for replaying trade history | Part 16 |
| 25 | SimpleVolumesStrategy.mqh | 1.11 | Trading strategy class using tick volumes | Part 22 |
| └ Utils | Helper utilities and macros for shortening code | |||
| 26 | ConsoleDialog.mqh | 1.01 | Class for displaying text information on a chart | Part 28 |
| 26 | ExpertHistory.mqh | 1.00 | Class for exporting trade history to a file | Part 16 |
| 27 | Macros.mqh | 1.07 | Useful macros for array operations | Part 26 |
| 28 | MTTester.mqh | — | File for working with the Strategy Tester from the MultiTester library | Part 28 |
| 29 | NewBarEvent.mqh | 1.00 | Class for detecting a new bar for a specific symbol | Part 8 |
| 30 | SymbolsMonitor.mqh | 1.01 | Class for obtaining information about trading instruments (symbols) | Part 28 |
| └ Virtual | Classes for creating various objects that are unified by their use of a system of virtual trading orders and positions | |||
| 31 | Money.mqh | 1.01 | Base money management class | Part 12 |
| 32 | TesterHandler.mqh | 1.07 | Class for handling optimization events | Part 23 |
| 33 | VirtualAdvisor.mqh | 1.12 | Expert Advisor class for working with virtual positions (orders) | Part 28 |
| 34 | VirtualChartOrder.mqh | 1.02 | Class for graphical virtual positions | Part 28 |
| 35 | VirtualCloseManager.mqh | 1.00 | Close Manager class | Part 28 |
| 36 | VirtualHistoryAdvisor.mqh | 1.00 | Expert Advisor class for replaying trade history | Part 16 |
| 37 | VirtualInterface.mqh | 1.00 | Expert Advisor graphical user interface class | Part 4 |
| 38 | VirtualOrder.mqh | 1.09 | Virtual orders and positions class | Part 22 |
| 39 | VirtualReceiver.mqh | 1.04 | Class for converting open volumes into market positions (receiver) | Part 23 |
| 40 | VirtualRiskManager.mqh | 1.06 | Risk management class (Risk Manager) | Part 28 |
| 41 | VirtualStrategy.mqh | 1.09 | Trading strategy class with virtual positions | Part 23 |
| 42 | VirtualStrategyGroup.mqh | 1.04 | Class for a group of trading strategies or groups of trading strategies | Part 28 |
| 43 | VirtualSymbolReceiver.mqh | 1.00 | Symbol receiver class | Part 3 |
The source code is also available in the public SimpleCandles and Adwizard repositories.
Translated from Russian by MetaQuotes Ltd.
Original article: https://www.mql5.com/ru/articles/21229
Warning: All rights to these materials are reserved by MetaQuotes Ltd. Copying or reprinting of these materials in whole or in part is prohibited.
This article was written by a user of the site and reflects their personal views. MetaQuotes Ltd is not responsible for the accuracy of the information presented, nor for any consequences resulting from the use of the solutions, strategies or recommendations described.

 Automating Classic Market Methods in MQL5 (Part 8): Ed Seykota's Trend Following System
 From Basic to Intermediate: Queues, Lists, and Trees (VIII)
 Building a News Filter Engine in MQL5 Using a Local Economic Calendar File
 Market Simulation: Position View (XVIII)

- Free trading apps
- Over 8,000 signals for copying
- Economic news for exploring financial markets
You agree to website policy and terms of use