
Developing a Multi-Currency Expert Advisor (Part 26): Informer for Trading Instruments
Contents
- Introduction
- Mapping out the path
- Creating a project
- Library section repository
- Project repository
- Project description
- Implementing the first version
- EA test
- Conclusion
Introduction
In the previous article, we finally arrived at what can be called a comprehensive system that allows us to automatically transform one simple trading strategy into a fully-fledged EA, ensuring that this strategy operates simultaneously on various instruments and timeframes. Issues related to the capital management system and risk manager, which allows trading to be stopped when unfavorable or, conversely, overly favorable situations arise, were also not ignored.
For almost the entire series, we worked with only one simple trading strategy, and only in the last parts, when the main features had already been implemented, we started considering adding a new trading strategy and using it as the main one. This example demonstrated the possibility of trying to unlock the potential of almost any trading strategy (if that potential really exists, of course).
But having risen to the current height, an even wider field for further work opens up to us. There are many possible directions now, which makes the next step harder to choose. To overcome this, an attempt was made to change the approach to arranging and storing the source codes of this project. The first steps were taken back in part 23, in which we separated most of the code into the so-called "library part", leaving the rest of the code in the "project part". We then turned our attention to the capabilities of the new code repository, covering the first steps in a separate article Moving to MQL5 Algo Forge (Part 1): Creating the Main Repository. The strategy for using the new repository's capabilities is still in development. Overall, I would like to establish the ability to work on the library section in several areas simultaneously. Whether this will be possible remains to be seen.
The process takes practice. This is the only way to understand whether the architectural decisions taken were good. So, let's try to practice creating a new project using the developed library called Advisor. We will not immediately start working on a large project to develop an EA using some complex trading strategy. Quite the opposite. We will create a project that does not aim to develop a trading EA.
Mapping out the path
One of the readers raised an interesting question regarding the latest strategy added - SimpleCandles. In this strategy, one of the parameters is the number of consecutive candles in the same direction on a given timeframe. Therefore, it would be nice to have the opportunity to see what series of such candles exist on different instruments and different timeframes, so as not to leave the entire task of selecting suitable values to the optimizer.
Indeed, even for auto optimization, it is still necessary to understand within what limits the inputs will change. You can, of course, simply set some wide range, but this should greatly reduce the efficiency of optimization. After all, the total number of parameter combinations will be greater, and the probability of hitting a winning combination will be lower. It is hard to say how much lower, but a simple understanding of the decline is enough to try to make some efforts to improve efficiency.
Collecting this kind of information about the price behavior of different instruments will also help answer the question: "Can the same parameter ranges be used for different instruments?" If so, this simplifies the organization of the first stage of optimization. If not, then creating optimization tasks at this stage will have to be somewhat more complex.
In general, we will try to create an auxiliary EA or part of an EA, that will be able to show us some statistics on symbols and timeframes in one form or another. Perhaps we will find it useful in the future for use in trading strategies.
But that will be the second question. The first thing we will start with is how we can arrange the storage of source code with a view to its future use in other projects.
Creating a project
At first glance it seems that there is nothing complicated here. We stored the code somehow before and we can continue doing so. But there is still a difference. It is one thing when we store the entire project code in one folder, and for each subsequent project we simply create a new folder, copying the code from the previous project into it. This approach is good for its simplicity and is entirely justified in strictly consistent development, without the need to worry about backward compatibility. It is much more convenient at the initial stage, when significant changes occur quite frequently. But it is a different matter when our project begins to grow. At this stage, the project clearly splits into parts that rarely change and parts that may change substantially or be created from scratch.
In this case, the disadvantages of storing all the code in one folder, in our opinion, begin to outweigh the advantages of this approach. A little earlier we had already moved most of the code into the MQL5/Include/antekov/Advisor folder calling this part the library one. But now using this location for the library part seems not entirely convenient.
Let's imagine that we are working on two projects in parallel that use the Advisor library. The changes mainly affect the project part, but some edits are also made to the library part. If both projects reference a library part located in the same location (MQL5/Include/antekov/Advisor), then conflicts are quite possible. To avoid this, when moving from one project to another, we will have to at least switch the library part to another corresponding version stored in another branch of the repository. Although there is nothing complicated about this, the need for such manipulations is unwelcome. You might forget to switch over someday, and then have to clean up edits you have already made on the wrong branch by moving them to another branch.
So let's try to change the approach. Each project will be a separate repository. Inside the project folder there will always be an Include folder containing folders with library parts. Please note: not with a single library part, but with several, distributed across different folders. Each library part will be a clone of a separate code repository.
Library section repository
For the library part, we will create a new repository on MQL5 Algo Forge or any other public GIT repository. The name Advisor we used for the library, seemed too general to us. Let's add some uniqueness by renaming it to Adwizard. This is what we will continue to call our library.
Let's place all the library part files in this repository. After creating the repository, it contains a single branch named main. Create a new branch named develop, the branches for articles and new library features will be generated from. These auxiliary branches will be closed once new features are implemented, and the edits will be merged into the develop branch followed by main. Typically, this will happen when I complete my work on an article.
To ensure that the code in this repository works when cloned into any folder, we needed to make some minor changes to some of the library files. They were needed in the #include directives where we used the paths leading to the Include folder with the standard library. After replacing them with relative paths, we removed the link to a specific library location in the MQL5/Include/antekov/Advisor folder.
For example, the following replacement was done in the Optimization.mqh file:
#include <antekov/Advisor/Optimization/Optimizer.mqh>
#include "../Optimization/Optimizer.mqh"
In the OptimizerTask.mqh file, we had still used a single file of a third-party library from fxsaber. We also moved it inside the library to the Utils folder:
#include <antekov/Advisor/Database/Database.mqh>
#include <fxsaber/MultiTester/MTTester.mqh> // https://www.mql5.com/ru/code/26132

#include "../Database/Database.mqh"
#include "../Utils/MTTester.mqh" // https://www.mql5.com/ru/code/26132
These edits have been submitted to the library repository.
Project repository
Create a new SymbolsInformer repository for the project. In this repository, in addition to the main branch, we will also make a development branch with the develop name. If this project will be covered by several articles, it would be advisable to split edits related to different articles into different branches. They will be generated from the develop branch and merged back into develop and main as soon as ready.
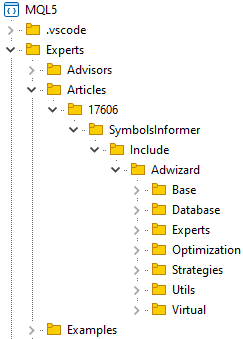
Let's create a folder to contain the project folder, for example, MQL5/Experts/Article/17606. Clone this repository into the selected folder and create the Include folder in it. In this folder, we will place repositories of other libraries this project will depend on. For now, there will only be one library - Adwizard. The Include folder receives the cloned Adwizard library repository. If we needed another library, we would clone it into the same Include folder.
After these operations, we will get approximately the following folder structure in the terminal folder:
In the cloned folder of the Adwizard repository, switch to the develop branch. It will be common to all articles. If we do not make any changes to the Adwizard library while working on this project, we will stay in the develop branch, updating it when new edits are made while working on other articles. If we need to fix something in this library while working on the current project, then we will create a new branch.
After this, we create a branch in the project repository for working on this article and begin development in it. Here we have provided a brief description of creating a new project. I will present the details in a separate article.
Project description
Let's try to formulate a brief technical specification for the development of the required tool. It will be implemented in the form of an EA, since it will not contain any calculation parameters that require periodic recalculation and display of changing values over a period of time.
First of all, to count the number of series of unidirectional candles, we need to set a certain time period, over which we will collect these statistics. This can be done in different ways. For example, you can specify the number of days from the current date, or two different dates indicating the start and end. Perhaps, to begin with, we will only calculate statistics for the interval starting from the current date. The duration can be set by selecting a timeframe (for example, daily) and the number of its candles. Let's call it the main timeframe.
Next, we will need to somehow indicate for which trading instruments (symbols) and on which timeframes we want to perform calculations. It is possible, of course, to carry out calculations only for the symbol and timeframe the developed EA will be launched on. But it is still better to immediately include the ability to perform calculations for several symbols and timeframes.
Based on the above, let's compile a list of EA inputs:
- Main timeframe
- Number of candles on the main timeframe
- List of symbols
- List of timeframes
This set of parameters may be expanded in the future. The lists of symbols and timeframes will contain their names separated by commas. We will set the names of the timeframes as they are named in the terminal, for example M5, M15, H1, and so on.
For each symbol and timeframe, we will calculate the following values:
- Average candle sizes:
- bullish ("up" or "buy" candle, whose close price is not lower than the open price);
- bearish ("down" or "sell" candle, whose close price is not higher than the open price);
- all (both bullish and bearish);
- Average length of a series (a series will be considered a sequence of two or more candles of the same direction);
- Number of series with length
- 2
- 3
- ...
- 8
- 9
This list is also open, meaning that we can add new calculation values to it if we wish.
Implementing the first version
To begin with, let's try to make the simplest version possible. We will store the calculated values in global arrays, and we will display the results in some form in the log and on the chart as a comment. We do not yet know exactly what data will be useful to us and what will be meaningless. Therefore, we use the first version mostly to determine what we actually need. In it, we will not pay much attention to checking the consistency of inputs and arranging the storage of information.
The inputs, according to the compiled list, can be set as follows:
//+------------------------------------------------------------------+
//| Inputs                                                           |
//+------------------------------------------------------------------+
input group "::: Calculation period"
sinput ENUM_TIMEFRAMES mainTimeframe_  = PERIOD_D1;   // Main timeframe
input int         mainLength_          = 30;          // Number of candles on the main timeframe

input group "::: Symbols and timeframes "
sinput string     symbols_             = "";          // Symbols (comma separated)
sinput string     timeframes_          = "";          // Timeframes (e.g. M5, H1, H4)
Since the inputs specify several symbols and timeframes in one string, we will need arrays that store separate values for each symbol name and each timeframe.
We will create two-dimensional arrays to store the calculated values. The first index in them will be associated with the symbol, and the second - with the timeframe. Since when declaring two-dimensional arrays, it is necessary to specify the number of elements along the second dimension, we will introduce the TFN constant, in which we will indicate the number of all currently existing standard timeframes. There turned out to be 21 of them.
// Number of existing timeframes
#define TFN (21)

// Global variables
string g_symbols[];                       // Array of all used symbols
ENUM_TIMEFRAMES g_timeframes[];           // Array of all used timeframes

// Arrays of calculated values.
// The first index is a symbol, the second index is a timeframe
double symbolAvrCandleSizes[][TFN];       // Array of average sizes of all candles
double symbolAvrBuyCandleSizes[][TFN];    // Array of average sizes of bullish candles
double symbolAvrSellCandleSizes[][TFN];   // Array of average sizes of bearish candles

double symbolAvrSeriesLength[][TFN];      // Array of average series lengths

int symbolCountSeries2[][TFN];            // Array of the number of series of length 2
int symbolCountSeries3[][TFN];            // Array of the number of series of length 3
int symbolCountSeries4[][TFN];            // Array of the number of series of length 4
int symbolCountSeries5[][TFN];            // Array of the number of series of length 5
int symbolCountSeries6[][TFN];            // Array of the number of series of length 6
int symbolCountSeries7[][TFN];            // Array of the number of series of length 7
int symbolCountSeries8[][TFN];            // Array of the number of series of length 8
int symbolCountSeries9[][TFN];            // Array of the number of series of length 9
For conversions between symbol timeframe constants (like ENUM_TIMEFRAMES), their string names and indices, we will provide auxiliary functions in the array of all timeframes. With their help it will be possible to solve three problems:
- get a symbol constant by string name (StringToTimeframe)
- get the string name of the timeframe from a symbol constant without the PERIOD_ (TimeframeToString) prefix
- get the index of the array of all timeframes from the symbol constant (TimeframeToIndex)
// Array of all timeframes
ENUM_TIMEFRAMES tfValues[] = {
   PERIOD_M1, PERIOD_M2, PERIOD_M3, PERIOD_M4, PERIOD_M5, PERIOD_M6,
   PERIOD_M10, PERIOD_M12, PERIOD_M15, PERIOD_M20, PERIOD_M30,
   PERIOD_H1, PERIOD_H2, PERIOD_H3, PERIOD_H4, PERIOD_H6,
   PERIOD_H8, PERIOD_H12, PERIOD_D1, PERIOD_W1, PERIOD_MN1
};

//+------------------------------------------------------------------+
//| Convert a string name to a timeframe                             |
//+------------------------------------------------------------------+
ENUM_TIMEFRAMES   StringToTimeframe(string s) {
// If the string contains the "_" symbol, leave only the characters that follow it
   int pos = StringFind(s, "_");
   if(pos != -1) {
      s = StringSubstr(s, pos + 1);
   }

// Convert to uppercase
   StringToUpper(s);

// Arrays of corresponding string names of timeframes
   string keys[] = {"M1", "M2", "M3", "M4", "M5", "M6", "M10", "M12", "M15", "M20", "M30",
                    "H1", "H2", "H3", "H4", "H6", "H8", "H12", "D1", "W1", "MN1"
                   };

// Search for a match and return it if found
   FOREACH(keys) {
      if(keys[i] == s)
         return tfValues[i];
   }

   return PERIOD_CURRENT;
}

//+------------------------------------------------------------------+
//| Convert a timeframe to a string name                             |
//+------------------------------------------------------------------+
string TimeframeToString(ENUM_TIMEFRAMES tf) {
// Get the timeframe name of the 'PERIOD_*' type
   string s = EnumToString(tf);

// Return the part of the name after the '_' symbol
   return StringSubstr(s, StringFind(s, "_") + 1);
}

//+------------------------------------------------------------------+
//| Convert a timeframe to an index in an array of all timeframes    |
//+------------------------------------------------------------------+
int   TimeframeToIndex(ENUM_TIMEFRAMES tf) {
// Search for a match and return it if found
   FOREACH(tfValues) {
      if(tfValues[i] == tf)
         return i;
   }

   return WRONG_VALUE;
}
The calculation of all values will be performed inside the Calculate() function. Arrange a nested loop in the function that goes through all combinations of symbols and timeframes. Inside them, we will check whether a new bar has arrived for this particular symbol and timeframe. If yes, then we call the auxiliary calculation functions. The indication of the need to immediately calculate all values without waiting for a new bar can also be passed via the force parameter. This mode will be used when launching the EA so that we can immediately see the results.
//+------------------------------------------------------------------+
//| Calculate all values                                             |
//+------------------------------------------------------------------+
void Calculate(bool force = false) {
   string symbol;
   ENUM_TIMEFRAMES tf;

// For each symbol and timeframe
   FOREACH_AS(g_symbols, symbol) {
      FOREACH_AS(g_timeframes, tf) {
         // If a new bar has arrived for the given symbol and timeframe, then
         if(IsNewBar(symbol, tf) || force) {
            // Find the number of candles for calculation
            int n = PeriodSeconds(mainTimeframe_) * mainLength_ / PeriodSeconds(tf);

            // Calculate the average candle sizes
            CalculateAvrSizes(symbol, tf, n);

            // Calculate the lengths of candlestick series
            CalculateSeries(symbol, tf, n);
         }
      }
   }
}
We placed the direct calculations in two auxiliary functions. Each of them performs calculations only for one symbol on one timeframe. In addition to these two parameters, we also pass the third one - the number of candles the calculation will take place on.
The average values are calculated in the CalculateAvrSizes() function. First, we use the symbol and timeframe name to define the s and t indices of the element in the two-dimensional arrays meant to store this result. Candles that have an open price equal to the close price will be considered both an up and a down candle. The calculated average values will be rounded to whole points.
//+------------------------------------------------------------------+
//| Calculate average candle sizes                                   |
//+------------------------------------------------------------------+
void CalculateAvrSizes(string symbol, ENUM_TIMEFRAMES tf, int n) {
// Find the index used for the desired symbol
   int s;
   FIND(g_symbols, symbol, s);

// Find the index used for the desired timeframe
   int t = TimeframeToIndex(tf);

// Array for candles
   MqlRates rates[];

// Copy the required number of candles into the array
   int res = CopyRates(symbol, tf, 1, n, rates);

// If everything was copied, then
   if(res == n) {
      // Number of up and down candles
      int nBuy = 0, nSell = 0;

      // Zero out the elements for the calculated average values
      symbolAvrCandleSizes[s][t] = 0;
      symbolAvrBuyCandleSizes[s][t] = 0;
      symbolAvrSellCandleSizes[s][t] = 0;

      // For all candles
      FOREACH(rates) {
         // Find the candle size
         double size = rates[i].high - rates[i].low;

         // Add it to the total size of all candles
         symbolAvrCandleSizes[s][t] += size;

         // If this is a bullish candle, then we take it into account
         if(IsBuyRate(rates[i])) {
            symbolAvrBuyCandleSizes[s][t] += size;
            nBuy++;
         }

         // If this is a downward candle, take it into account
         if(IsSellRate(rates[i])) {
            symbolAvrSellCandleSizes[s][t] += size;
            nSell++;
         }
      }

      // Get the size of one point for a symbol
      double point = SymbolInfoDouble(symbol, SYMBOL_POINT);

      // Find the average values in points
      symbolAvrCandleSizes[s][t] /= n * point;
      symbolAvrBuyCandleSizes[s][t] /= nBuy * point;
      symbolAvrSellCandleSizes[s][t] /= nSell * point;

      // Round them to whole points
      symbolAvrCandleSizes[s][t] = MathRound(symbolAvrCandleSizes[s][t]);
      symbolAvrBuyCandleSizes[s][t] = MathRound(symbolAvrBuyCandleSizes[s][t]);
      symbolAvrSellCandleSizes[s][t] = MathRound(symbolAvrSellCandleSizes[s][t]);
   }
}
The calculation of series lengths is performed in a similar way in the CalculateSeries() function. It uses the auxiliary seriesLens array with the size of 100 elements. The index of an element of this array corresponds to the length of a series, and the element itself corresponds to the number of series of that length. Thus, we will assume that the overwhelming majority of series are less than one hundred candles long. We will show only the number of series with a length of less than 10 candles. We rewrite the number of series with exactly the same lengths from the seriesLens array to the corresponding array elements for results with the names of symbolCountSeries* type.
//+------------------------------------------------------------------+
//| Calculate the lengths of candlestick series                      |
//+------------------------------------------------------------------+
void CalculateSeries(string symbol, ENUM_TIMEFRAMES tf, int n) {
// Find the index used for the desired symbol
   int s;
   FIND(g_symbols, symbol, s);

// Find the index used for the desired timeframe
   int t = TimeframeToIndex(tf);

// Array for candles
   MqlRates rates[];

// Copy the required number of candles into the array
   int res = CopyRates(symbol, tf, 1, n, rates);

// If everything was copied, then
   if(res == n) {
      // Current series length
      int curLen = 0;

      // Direction of the previous candle
      bool prevIsBuy = false;
      bool prevIsSell = false;

      // Array of numbers of series of different lengths (index = series length)
      int seriesLens[];

      // Set the size and initialize
      ArrayResize(seriesLens, 100);
      ArrayInitialize(seriesLens, 0);

      // For all candles
      FOREACH(rates) {
         // Determine the candle direction
         bool isBuy = IsBuyRate(rates[i]);
         bool isSell = IsSellRate(rates[i]);

         // If the direction is the same as the previous one, then
         if((isBuy && prevIsBuy) || (isSell && prevIsSell)) {
            // Increase the series length
            curLen++;
         } else {
            // Otherwise, if the length is within the required range, then
            if(curLen > 1 && curLen < 100) {
               // Increase the counter of the length series
               seriesLens[curLen]++;
            }
            // Reset the current series length
            curLen = 1;
         }
         // Save the direction of the current candle as the previous one
         prevIsBuy = isBuy;
         prevIsSell = isSell;
      }

      // Initialize the array element for the average series length
      symbolAvrSeriesLength[s][t] = 0;
      int count = 0;

      //  For all series lengths we find the sum and quantity
      FOREACH(seriesLens) {
         symbolAvrSeriesLength[s][t] += seriesLens[i] * i;
         count += seriesLens[i];
      }

      // Calculate the average length of candlestick series
      symbolAvrSeriesLength[s][t] /= (count > 0 ? count : 1);

      // Copy the values of the series lengths into the final arrays
      symbolCountSeries2[s][t] = seriesLens[2];
      symbolCountSeries3[s][t] = seriesLens[3];
      symbolCountSeries4[s][t] = seriesLens[4];
      symbolCountSeries5[s][t] = seriesLens[5];
      symbolCountSeries6[s][t] = seriesLens[6];
      symbolCountSeries7[s][t] = seriesLens[7];
      symbolCountSeries8[s][t] = seriesLens[8];
      symbolCountSeries9[s][t] = seriesLens[9];
   }
}
The Show() function will be responsible for displaying the results. In the first version, we will limit ourselves for now to output to the terminal log and as a comment on the chart the EA will be launched on. Thus, it is enough for us to present the results in text form. A separate TextComment() function will handle this presentation.
//+------------------------------------------------------------------+
//| Show results                                                     |
//+------------------------------------------------------------------+
void Show() {
// Get the results as text
   string text = TextComment();

// Show it in the comment and in the log
   Comment(text);
   Print(text);
}
In the EA initialization function, we only need to process the input parameters, dividing the listed symbol names and timeframes into separate values, and prepare arrays of the required sizes for recording the results. After that, we can call the function to calculate and display the results:
//+------------------------------------------------------------------+
//| Initialize the EA                                                |
//+------------------------------------------------------------------+
int OnInit(void) {
// Fill in the symbol array for calculations from the inputs
   SPLIT(symbols_, g_symbols);

// If no symbols are specified, use the current single symbol
   if(ArraySize(g_symbols) == 0) {
      APPEND(g_symbols, Symbol());
   }
// Number of symbols for calculations
   int nSymbols = ArraySize(g_symbols);

// Initialize arrays for calculated values
   Initialize(nSymbols);

// Fill the array with timeframe names from the inputs
   string strTimeframes[];
   SPLIT(timeframes_, strTimeframes);
   ArrayResize(g_timeframes, 0);

// If timeframes are not specified, use the current one
   if(ArraySize(strTimeframes) == 0) {
      APPEND(strTimeframes, TimeframeToString(Period()));
   }

// Fill the timeframe array from the timeframe names array
   FOREACH(strTimeframes) {
      ENUM_TIMEFRAMES tf = StringToTimeframe(strTimeframes[i]);
      if(tf != PERIOD_CURRENT) {
         APPEND(g_timeframes, tf);
      }
   }

// Perform a forced recalculation
   Calculate(true);

// Show the results
   Show();

   return(INIT_SUCCEEDED);
}
In the above function we have used a new SPLIT macro. It was added to the Utils/Macros.mqh file of the Adwizard library. This is the only addition to the library that was needed for this project so far.
The macro itself is designed to split a string into parts using two possible separator characters: a comma and a semicolon.
#define SPLIT(V, A) { string s=V; StringReplace(s, ";", ","); StringSplit(s, ',', A); }
Let's now look at the results of the developed EA's work.
EA test
Let's launch the EA with default parameters on some chart. As a result, you can see something like this:
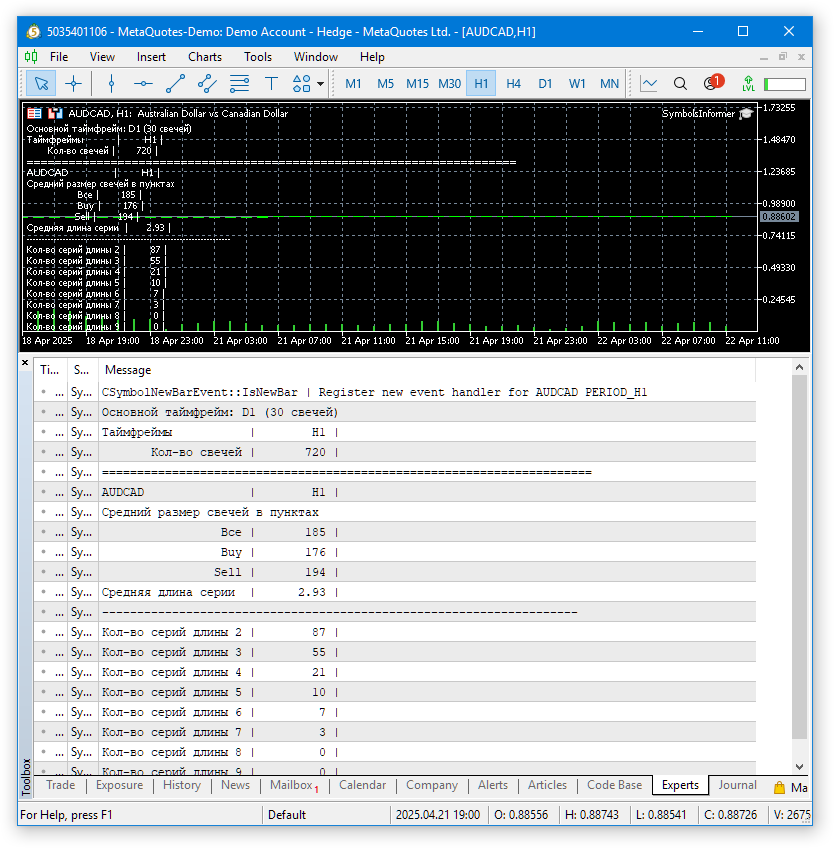
Fig. 1. Results of running the EA with default parameters on AUDCAD H1
Since a non-monospaced font is used when displaying comments on a chart, it is not particularly convenient to view the obtained values on the chart. The terminal log uses a monospaced font, so everything looks better there. Let's see how the results look for several symbols and timeframes.
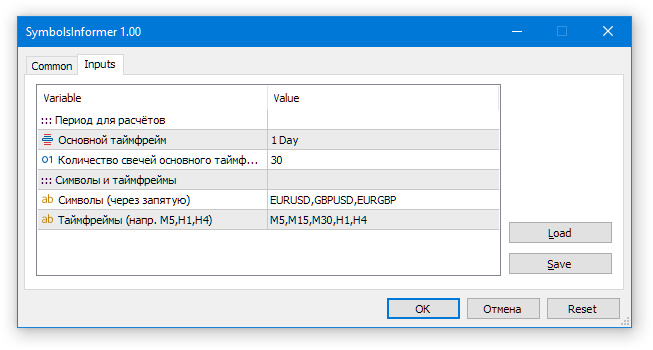
Let's run the EA with the following inputs:
Now have a look at the result.
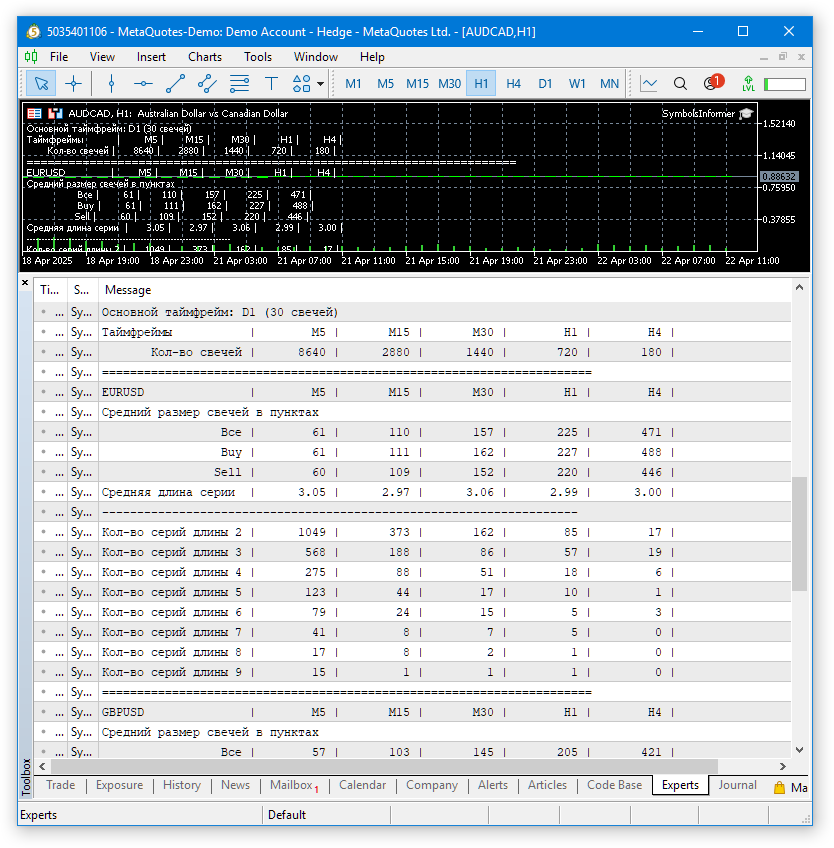
Fig. 2. Results of the EA for several symbols and timeframes
Calculations for multiple symbols and timeframes were completed successfully. The results are shown in the table. They are not particularly convenient to use yet, but they are still sufficient for a quick preliminary analysis.
Conclusion
We have created the first version of an auxiliary informer EA, showing information about the average candle sizes in points and the lengths of series of candles moving in the same direction. At first glance, this has a somewhat indirect relation to our main project of creating a system of auto optimization and launching multi-currency EAs that implement a variety of simple strategies. This is indeed true, so the work on this EA will continue beyond the scope of this article series. But during the work, we will try out and test the implementation of many things, which we then hope to successfully apply in the main project.
Now we have already done quite a lot. The choice of a different, more optimal code organization structure will allow parallelization of work in different areas of the further Adwizard library development. I am already considering some future directions for improvement. One of them is the construction of a visual interface for managing the work of final EAs. The project discussed in this article will help us to try out various possible approaches without getting bogged down in implementing very complex things. Having examined their pros and cons and selected the most suitable one, we will be able to more purposefully focus on developing the main project.
Thank you for your attention! See you soon!
Important warning
All results presented in this article and all previous articles in the series are based only on historical testing data and are not a guarantee of any profit in the future. The work within this project is of a research nature. All published results can be used by anyone at their own risk.
Archive contents
| # | Name | Version | Description | Recent changes |
|---|---|---|---|---|
| SymbolsInformer | Project working folder | |||
| 1 | SymbolsInformer.mq5 | 1.00 | The EA for displaying information about the lengths of series of unidirectional candles | Part 26 |
| SymbolsInformer/Include/Adwizard/Base | Base classes other project classes inherit from | |||
| 2 | Advisor.mqh | 1.04 | EA base class | Part 10 |
| 3 | Factorable.mqh | 1.05 | Base class of objects created from a string | Part 24 |
| 4 | FactorableCreator.mqh | 1.00 | Class of creators that bind names and static constructors of CFactorable descendant classes | Part 24 |
| 5 | Interface.mqh | 1.01 | Basic class for visualizing various objects | Part 4 |
| 6 | Receiver.mqh | 1.04 | Base class for converting open volumes into market positions | Part 12 |
| 7 | Strategy.mqh | 1.04 | Trading strategy base class | Part 10 |
| SymbolsInformer/Include/Adwizard/Database | Files for handling all types of databases used by project EAs | |||
| 8 | Database.mqh | 1.12 | Class for handling the database | Part 25 |
| 9 | db.adv.schema.sql | 1.00 | Final EA's database structure | Part 22 |
| 10 | db.cut.schema.sql | 1.00 | Structure of the truncated optimization database | Part 22 |
| 11 | db.opt.schema.sql | 1.05 | Optimization database structure | Part 22 |
| 12 | Storage.mqh | 1.01 | Class for handling the Key-Value storage for the final EA in the EA database | Part 23 |
| SymbolsInformer/Include/Adwizard/Experts | Files with common parts of used EAs of different type | |||
| 13 | Expert.mqh | 1.22 | The library file for the final EA. Group parameters can be taken from the EA database | Part 23 |
| 14 | Optimization.mqh | 1.04 | Library file for the EA that manages the launch of optimization tasks | Part 23 |
| 15 | Stage1.mqh | 1.19 | Library file for the single instance trading strategy optimization EA (Stage 1) | Part 23 |
| 16 | Stage2.mqh | 1.04 | Library file for the EA optimizing a group of trading strategy instances (Stage 2) | Part 23 |
| 17 | Stage3.mqh | 1.04 | Library file for the EA saving a generated standardized group of strategies to an EA database with a given name. | Part 23 |
| SymbolsInformer/Include/Adwizard/Optimization | Classes responsible for auto optimization | |||
| 18 | OptimizationJob.mqh | 1.00 | Optimization project stage job class | Part 25 |
| 19 | OptimizationProject.mqh | 1.00 | Optimization project class | Part 25 |
| 20 | OptimizationStage.mqh | 1.00 | Optimization project stage class | Part 25 |
| 21 | OptimizationTask.mqh | 1.00 | Optimization task class (creation) | Part 25 |
| 22 | Optimizer.mqh | 1.03 | Class for the project auto optimization manager | Part 22 |
| 23 | OptimizerTask.mqh | 1.03 | Optimization task class (conveyor) | Part 22 |
| SymbolsInformer/Include/Adwizard/Strategies | Examples of trading strategies used to demonstrate how the project works | |||
| 24 | HistoryStrategy.mqh | 1.00 | Class of the trading strategy for replaying the history of deals | Part 16 |
| 25 | SimpleVolumesStrategy.mqh | 1.11 | Class of trading strategy using tick volumes | Part 22 |
| SymbolsInformer/Include/Adwizard/Utils | Auxiliary utilities, macros for code reduction | |||
| 26 | ExpertHistory.mqh | 1.00 | Class for exporting trade history to file | Part 16 |
| 27 | Macros.mqh | 1.07 | Useful macros for array operations | Part 26 |
| 28 | NewBarEvent.mqh | 1.00 | Class for defining a new bar for a specific symbol | Part 8 |
| 29 | SymbolsMonitor.mqh | 1.00 | Class for obtaining information about trading instruments (symbols) | Part 21 |
| SymbolsInformer/Include/Adwizard/Virtual | Classes for creating various objects united by the use of a system of virtual trading orders and positions | |||
| 30 | Money.mqh | 1.01 | Basic money management class | Part 12 |
| 31 | TesterHandler.mqh | 1.07 | Optimization event handling class | Part 23 |
| 32 | VirtualAdvisor.mqh | 1.10 | Class of the EA handling virtual positions (orders) | Part 24 |
| 33 | VirtualChartOrder.mqh | 1.01 | Graphical virtual position class | Part 18 |
| 34 | VirtualHistoryAdvisor.mqh | 1.00 | Trade history replay EA class | Part 16 |
| 35 | VirtualInterface.mqh | 1.00 | EA GUI class | Part 4 |
| 36 | VirtualOrder.mqh | 1.09 | Class of virtual orders and positions | Part 22 |
| 37 | VirtualReceiver.mqh | 1.04 | Class for converting open volumes to market positions (receiver) | Part 23 |
| 38 | VirtualRiskManager.mqh | 1.05 | Risk management class (risk manager) | Part 24 |
| 39 | VirtualStrategy.mqh | 1.09 | Class of a trading strategy with virtual positions | Part 23 |
| 40 | VirtualStrategyGroup.mqh | 1.03 | Class of trading strategies group(s) | Part 24 |
| 41 | VirtualSymbolReceiver.mqh | 1.00 | Symbol receiver class | Part 3 |
The source code is also available in SymbolsInformer and Adwizard public repositories
Translated from Russian by MetaQuotes Ltd.
Original article: https://www.mql5.com/ru/articles/17606
Warning: All rights to these materials are reserved by MetaQuotes Ltd. Copying or reprinting of these materials in whole or in part is prohibited.
This article was written by a user of the site and reflects their personal views. MetaQuotes Ltd is not responsible for the accuracy of the information presented, nor for any consequences resulting from the use of the solutions, strategies or recommendations described.
- Free trading apps
- Over 8,000 signals for copying
- Economic news for exploring financial markets
You agree to website policy and terms of use
Just a shame(
I will look into your informative review tomorrow
@Rashid Umarov
Hi
Are you following this thread closely and able to implement everything and optimise?
Can you please help me doing thst?
Cheers