

Automating Classic Market Methods in MQL5 (Part 8): Ed Seykota's Trend Following System
 49
49
 0
0

Introduction
Ed Seykota graduated from MIT with a degree in electrical engineering in 1969 and joined a brokerage firm in 1970. Within a year he had built one of the first computerized trading systems in history—programmed in FORTRAN on punch cards fed into a mainframe computer. The system identified trends using exponential moving averages and sized positions based on market volatility. He ran it every night and placed orders the following morning. Likewise, he held positions for weeks to months. Furthermore, he did not watch intraday prices.
Seykota's approach differed from earlier trend-following systems (including the Turtle system in Part 5) primarily because of the portfolio-heat concept. Seykota recognized that running multiple positions simultaneously created aggregate risk that was invisible if you only looked at each position individually. Ten positions risking 2% each do not imply 2% total risk. If all positions move against you at once, total risk is 20%—a frequent outcome in correlated markets. He capped total portfolio heat at a defined threshold and refused to open new positions once that cap was reached regardless of how compelling the signal was.
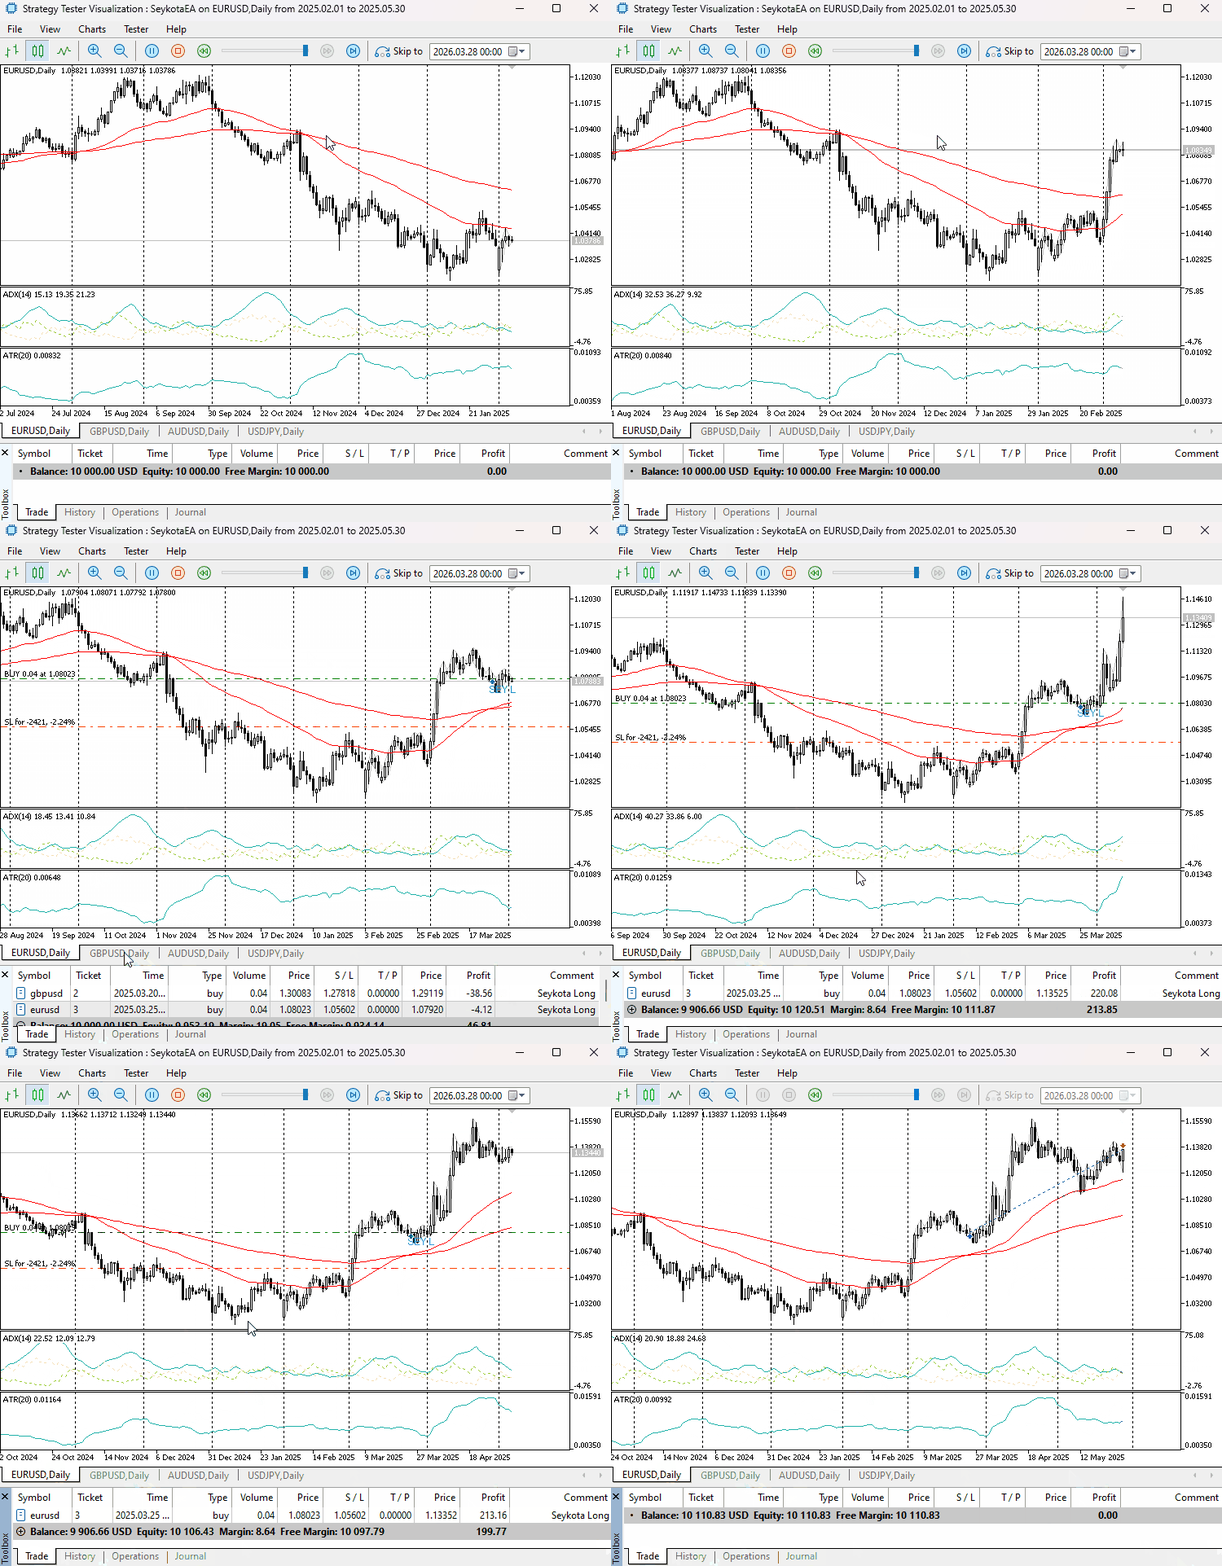
Fig. 1. Visual demonstration of the system.
This heat management is the article's central contribution. Seykota's system is explicitly multi-position. The EA manages multiple instruments, tracks total heat on each bar, and blocks new entries once the cap is exceeded.
The connection to earlier articles in this series is direct. Seykota was a student of Richard Donchian—the trader who inspired the Turtle rules—and described his system in Market Wizards as a natural evolution of Donchian's channel breakout work, substituting exponential moving averages for price channels. Like Livermore in Part 6 and Darvas in Part 7, Seykota's genius was not in the entry signal itself—it was in the discipline with which the rules were applied and the risk management that kept losses small when the signal was wrong.
This EA answers three questions: (1) Is the trend confirmed by EMA structure and ADX? (2) Is total heat below the cap? (3) Does sizing keep risk at 1% regardless of instrument and volatility?
We will cover the following topics:
Seykota's Trend Following System—Theory and Rules
Seykota's system has five components. Each is precisely defined.
The Dual EMA Trend Signal
Seykota used two exponential moving averages—a fast one and a slow one. When the fast EMA crosses above the slow EMA, the trend is up and long entries are permitted. When the fast EMA crosses below the slow EMA, the trend is down and short entries are permitted. The crossover is the signal. The direction of the slow EMA is the trend filter.
Seykota's typical parameters, as described in published accounts and his own writing, were a short-period EMA of approximately 20 days and a long-period EMA of approximately 200 days. These are not the only parameters he used—he ran multiple systems simultaneously with different parameters—but they represent his primary long-term trend-following configuration.
The ADX Trend Quality Filter
Seykota was explicit about one condition that many implementations omit: he only wanted to be in trending markets. When a market was range-bound and choppy, his EMA crossovers generated frequent false signals with small losses that eroded the account. The ADX indicator—Average Directional Index—measures trend strength without regard to direction. A reading above 20 indicates a trending market. A reading below 20 indicates a ranging market. Seykota blocked entries when the market was not trending.
The ATR-Based Position Sizing Formula
Seykota's position sizing formula is one of the most elegant in systematic trading. It produces a position size that keeps the monetary risk per trade constant as a percentage of account equity, regardless of which market is being traded or how volatile it currently is.
The formula is: Position Size = (Account Equity × Risk Percent) ÷ (ATR × ATR Multiplier).
The stop distance is ATR × ATR multiplier. If ATR is large—the market is volatile—the stop is wider and the position is smaller. If ATR is small—the market is quiet—the stop is tighter and the position is larger. The monetary risk at the stop is always the same fixed percentage of equity.
Seykota used an ATR period of 20 days and a multiplier of 3.0 to 5.0 depending on the instrument. The default in this EA is 3.0.
Portfolio Heat
Heat is the total percentage of account equity currently at risk across all open positions. If three positions are open and each risks 1% of equity, total heat is 3%. Seykota capped total heat at 20% of equity. When the heat cap was reached, no new positions were opened until existing positions closed or moved their stops to reduce the heat contribution.
The heat contribution of each open position is calculated in real time as the distance from the current price to the stop, expressed in dollar terms relative to account equity. This is not the original entry risk—it is the current residual risk, which decreases as the price moves in the position's favor and the stop advances.
Exit Rules
Seykota exited positions in two ways. The primary exit was the reversal of the EMA crossover—when the fast EMA crossed back through the slow EMA against the position. The secondary exit was the stop-loss at ATR × multiplier below the entry price. He did not use a fixed take profit. He let the EMA crossover determine when the trend had genuinely reversed.
Portfolio Heat—The Missing Piece in Most Implementations
Most implementations of Seykota's system focus on the EMA crossover and the ATR position sizing and omit the heat monitor entirely. This is the most significant omission because the heat monitor is what prevented catastrophic losses when multiple correlated markets moved against him simultaneously.
Consider a scenario without heat management. Five EMA crossover signals fire simultaneously on EURUSD, GBPUSD, AUDUSD, NZDUSD, and USDCHF. All five are long entries on dollar-negative signals. All five risk 1% of equity. Total exposure is 5%. When a sudden dollar-positive event occurs—a central bank surprise, a risk-off shock—all five positions move against the trader simultaneously, and the account loses 5% in a single session.
With a heat cap of 5%, only two of the five signals would have been accepted. The heat cap is reached after the second entry. The remaining three signals are blocked. The maximum loss from the dollar event is 2%—what was already open—instead of 5%.
The heat monitor in this EA calculates current residual risk across all open positions on every bar. Residual risk for a long position is (current bid − stop price) × lot size × pip value, expressed as a percentage of current account equity. When the sum of all residual risks exceeds "InpMaxHeatPct," new entries are blocked.
Architecture—Multi-Symbol Heat Monitor and Single-Symbol Entry
The EA is designed to run on a single chart but monitor and trade a configurable list of symbols simultaneously. The symbol list is defined as a comma-separated input. On every new bar, the EA iterates through the list, updates the heat calculation, checks exit conditions for open positions, and evaluates entry signals for symbols without open positions.
The heat monitor runs before any entry evaluation. If total heat is at or above the cap, entry evaluation is skipped for all symbols on that bar. This is a hard block—not a soft suggestion.
The state for each symbol is simple: either a position is open on that symbol or it is not. There is no multi-state campaign like Livermore's market key. Seykota's system is stateless per symbol—the EMA crossover either says "buy," "sell," or "nothing," and the position either exists or it does not.
The new bar gate uses the daily bar of each symbol independently. For each symbol in the list, the EA checks whether the last processed bar time has changed and runs its logic once per completed daily bar.
Implementation in MQL5
The EA is built section by section.
Includes and Input Parameters
//+------------------------------------------------------------------+
//|                                                   SeykotaEA.mq5  |
//|                                Copyright 2026, Tola Moses Hector |
//|                                          https://t.me/tolahector |
//+------------------------------------------------------------------+
#property copyright "Copyright 2026, Tola Moses Hector"
#property link      "https://t.me/tolahector"
#property version   "1.00"
#property description "Automating Classic Market Methods in MQL5 Part 8"
#property description "Ed Seykota Trend Following System"
#property description "Dual EMA, ADX filter, ATR sizing, portfolio heat cap"
#property description "Attach to any Daily chart — trades configured symbol list"

#include <Trade\Trade.mqh>

//+------------------------------------------------------------------+
//| Input Parameters                                                 |
//+------------------------------------------------------------------+
input group "=== Symbol List ==="
input string InpSymbols       = "EURUSD,GBPUSD,AUDUSD,USDCHF,USDJPY"; // Comma-separated symbol list

input group "=== EMA Trend System ==="
input int    InpFastEMA       = 20;                                   // Fast EMA period
input int    InpSlowEMA       = 200;                                  // Slow EMA period (long-term trend)

input group "=== ADX Filter ==="
input int    InpADXPeriod     = 14;                                   // ADX period for trend quality
input double InpADXMinLevel   = 20.0;                                 // Minimum ADX to allow entry

input group "=== ATR Position Sizing ==="
input int    InpATRPeriod     = 20;                                   // ATR period for volatility measurement
input double InpATRMultiplier = 3.0;                                  // ATR multiplier for stop distance
input double InpRiskPct       = 1.0;                                  // Risk per trade as percent of equity

input group "=== Portfolio Heat ==="
input double InpMaxHeatPct    = 10.0;                                 // Maximum total portfolio heat percent

input group "=== General ==="
input int    InpMagicNumber   = 100801;                               // Magic number
input int    InpSlippage      = 10;                                   // Slippage in points
input bool   InpShowLabels    = true;                                 // Draw labels on chart
"InpMaxHeatPct" defaults to 10%—meaning at most ten simultaneous positions each, risking 1%, or fewer positions if any individual position has a wider stop. Seykota's own cap was reported at 20%, but 10% is a more conservative starting point for forex, where correlations between major pairs are frequently high.
The Per-Symbol State Structure
Each symbol in the portfolio needs its own indicator handles and state.
//+------------------------------------------------------------------+
//| Per-symbol state — stored in array, accessed by index            |
//+------------------------------------------------------------------+
struct SSymbolState
  {
   string            symbol;
   int               fast_handle;
   int               slow_handle;
   int               adx_handle;
   int               atr_handle;
   datetime          last_bar;
   bool              position_open;
   ulong             ticket;
   double            stop_price;
   bool              is_long;
  };
Global Variables
//+------------------------------------------------------------------+
//| Global Variables                                                 |
//+------------------------------------------------------------------+
SSymbolState g_symbols[];
int          g_sym_count = 0;
CTrade       g_trade;
Parsing the Symbol List
//+------------------------------------------------------------------+
//| Parses the comma-separated symbol list and creates handles       |
//+------------------------------------------------------------------+
bool ParseSymbols()
  {
   string parts[];
   int count = StringSplit(InpSymbols, ',', parts);
   if(count <= 0)
     {
      Print("SeykotaEA: No symbols found.");
      return false;
     }
   ArrayResize(g_symbols, count);
   g_sym_count = 0;
   for(int i = 0; i < count; i++)
     {
      string sym = parts[i];
      StringTrimRight(sym);
      StringTrimLeft(sym);
      if(sym == "")
         continue;
      if(!SymbolSelect(sym, true))
        {
         Print("SeykotaEA: Symbol not found: ", sym);
         continue;
        }
      g_symbols[g_sym_count].symbol        = sym;
      g_symbols[g_sym_count].fast_handle   = iMA(sym, PERIOD_D1, InpFastEMA, 0, MODE_EMA, PRICE_CLOSE);
      g_symbols[g_sym_count].slow_handle   = iMA(sym, PERIOD_D1, InpSlowEMA, 0, MODE_EMA, PRICE_CLOSE);
      g_symbols[g_sym_count].adx_handle    = iADX(sym, PERIOD_D1, InpADXPeriod);
      g_symbols[g_sym_count].atr_handle    = iATR(sym, PERIOD_D1, InpATRPeriod);
      if(g_symbols[g_sym_count].fast_handle == INVALID_HANDLE ||
         g_symbols[g_sym_count].slow_handle == INVALID_HANDLE ||
         g_symbols[g_sym_count].adx_handle  == INVALID_HANDLE ||
         g_symbols[g_sym_count].atr_handle  == INVALID_HANDLE)
        { Print("SeykotaEA: Handle creation failed for ", sym); continue; }
      g_symbols[g_sym_count].last_bar      = 0;
      g_symbols[g_sym_count].position_open = false;
      g_symbols[g_sym_count].ticket        = 0;
      g_symbols[g_sym_count].stop_price    = 0;
      g_symbols[g_sym_count].is_long       = true;
      g_sym_count++;
      Print("SeykotaEA: Symbol added | ", sym);
     }
   if(g_sym_count == 0)
     {
      Print("SeykotaEA: No valid symbols.");
      return false;
     }
   return true;
  }
All four indicator handles are created on "PERIOD_D1" regardless of which chart the EA is attached to. Seykota's system was daily—end-of-day decisions based on daily close prices. The EA respects this by always reading daily data.
Utility Functions
//+------------------------------------------------------------------+
//| Returns pip size for a given symbol                              |
//+------------------------------------------------------------------+
double PipSize(const string symbol)
  {
   int    digits = (int)SymbolInfoInteger(symbol, SYMBOL_DIGITS);
   double point  = SymbolInfoDouble(symbol, SYMBOL_POINT);
   return (digits == 3 || digits == 5) ? point * 10.0 : point;
  }

//+------------------------------------------------------------------+
//| Computes lot size using Seykota's ATR formula                    |
//+------------------------------------------------------------------+
double CalcLots(const string symbol, double atr)
  {
   double equity      = AccountInfoDouble(ACCOUNT_EQUITY);
   double risk_amt    = equity * InpRiskPct / 100.0;
   double stop_dist   = atr * InpATRMultiplier;
   double tick_val    = SymbolInfoDouble(symbol, SYMBOL_TRADE_TICK_VALUE);
   double tick_size   = SymbolInfoDouble(symbol, SYMBOL_TRADE_TICK_SIZE);
   if(tick_size <= 0 || tick_val <= 0 || stop_dist <= 0)
      return 0;
   double stop_ticks  = stop_dist / tick_size;
   double risk_per_lot= stop_ticks * tick_val;
   if(risk_per_lot <= 0)
      return 0;
   double lots   = risk_amt / risk_per_lot;
   double step   = SymbolInfoDouble(symbol, SYMBOL_VOLUME_STEP);
   double minlot = SymbolInfoDouble(symbol, SYMBOL_VOLUME_MIN);
   double maxlot = SymbolInfoDouble(symbol, SYMBOL_VOLUME_MAX);
   lots = MathFloor(lots / step) * step;
   return MathMax(minlot, MathMin(maxlot, lots));
  }
The sizing formula is exactly Seykota's: equity risk divided by the dollar value of the stop. When ATR is large, "stop_dist" is large, "risk_per_lot" is large, and "lots" is small. When ATR is small, lots increase. The monetary risk at the stop is always "InpRiskPct" percent of equity, regardless of the instrument.
Calculating Portfolio Heat
"CalcTotalHeat()" iterates all open positions belonging to this EA and computes the sum of residual risk as a percentage of current equity.
//+------------------------------------------------------------------+
//| Calculates total portfolio heat across all open positions        |
//+------------------------------------------------------------------+
double CalcTotalHeat()
  {
   double equity     = AccountInfoDouble(ACCOUNT_EQUITY);
   if(equity <= 0)
      return 0;
   double total_risk = 0;
   for(int i = PositionsTotal() - 1; i >= 0; i--)
     {
      ulong ticket = PositionGetTicket(i);
      if(!PositionSelectByTicket(ticket))
         continue;
      if(PositionGetInteger(POSITION_MAGIC) != InpMagicNumber)
         continue;
      double sl       = PositionGetDouble(POSITION_SL);
      double lots     = PositionGetDouble(POSITION_VOLUME);
      string sym      = PositionGetString(POSITION_SYMBOL);
      long   pos_type = PositionGetInteger(POSITION_TYPE);
      double bid      = SymbolInfoDouble(sym, SYMBOL_BID);
      double ask      = SymbolInfoDouble(sym, SYMBOL_ASK);
      double tick_val = SymbolInfoDouble(sym, SYMBOL_TRADE_TICK_VALUE);
      double tick_sz  = SymbolInfoDouble(sym, SYMBOL_TRADE_TICK_SIZE);
      if(sl <= 0 || tick_sz <= 0 || tick_val <= 0)
         continue;
      double price_dist = (pos_type == POSITION_TYPE_BUY)
                          ? MathMax(0, bid - sl)
                          : MathMax(0, sl - ask);
      double risk_usd   = (price_dist / tick_sz) * tick_val * lots;
      total_risk       += risk_usd;
     }
   return (total_risk / equity) * 100.0;
  }
Using residual risk rather than initial risk is the correct approach for a live heat monitor. As positions move in the trader's favor and stops advance, the residual risk decreases even though the initial risk was fixed at 1%. The heat cap is evaluated against the current real exposure, not the historical entry risk.
Chart Drawing Helpers
//+------------------------------------------------------------------+
//| Draws a text label on the attached chart only                    |
//+------------------------------------------------------------------+
void DrawLabel(const string symbol, string name, datetime time,
               double price, string text, color clr)
  {
   if(!InpShowLabels || symbol != _Symbol)
      return;
   string obj = "SEY_" + name;
   ObjectDelete(0, obj);
   ObjectCreate(0, obj, OBJ_TEXT, 0, time, price);
   ObjectSetString(0,  obj, OBJPROP_TEXT, text);
   ObjectSetInteger(0, obj, OBJPROP_COLOR, clr);
   ObjectSetInteger(0, obj, OBJPROP_FONTSIZE, 9);
   ChartRedraw(0);
  }

//+------------------------------------------------------------------+
//| Removes all chart objects created by this EA                     |
//+------------------------------------------------------------------+
void ClearLabels()
  {
   int total = ObjectsTotal(0);
   for(int i = total - 1; i >= 0; i--)
     {
      string name = ObjectName(0, i);
      if(StringFind(name, "SEY_") == 0)
         ObjectDelete(0, name);
     }
   ChartRedraw(0);
  }
Labels are only drawn on the chart the EA is physically attached to. For symbols in the list that differ from the attached chart, the labels are skipped—they would appear on the wrong chart anyway.
Processing Each Symbol
"ProcessSymbol()" is called once per symbol on each tick where a new daily bar has formed for that symbol. It handles exit checking, heat checking, and entry evaluation in that order.
//+------------------------------------------------------------------+
//| Processes one symbol for the current bar                         |
//| Accesses g_symbols[idx] directly — no reference to array element |
//+------------------------------------------------------------------+
void ProcessSymbol(int idx, double current_heat)
  {
//--- Copy indicator values
   double fast_buf[], slow_buf[], adx_buf[], atr_buf[];
   ArraySetAsSeries(fast_buf, true);
   ArraySetAsSeries(slow_buf, true);
   ArraySetAsSeries(adx_buf,  true);
   ArraySetAsSeries(atr_buf,  true);
   if(CopyBuffer(g_symbols[idx].fast_handle, 0, 1, 3, fast_buf) < 3)
      return;
   if(CopyBuffer(g_symbols[idx].slow_handle, 0, 1, 3, slow_buf) < 3)
      return;
   if(CopyBuffer(g_symbols[idx].adx_handle,  0, 1, 1, adx_buf)  < 1)
      return;
   if(CopyBuffer(g_symbols[idx].atr_handle,  0, 1, 1, atr_buf)  < 1)
      return;
   double fast_curr = fast_buf[0];                                    // Fast EMA last completed bar
   double fast_prev = fast_buf[1];                                    // Fast EMA bar before that
   double slow_curr = slow_buf[0];                                    // Slow EMA last completed bar
   double slow_prev = slow_buf[1];                                    // Slow EMA bar before that
   double adx       = adx_buf[0];                                     // ADX value
   double atr       = atr_buf[0];                                     // ATR value
//--- Exit check: EMA reversed against open position
   if(g_symbols[idx].position_open && PositionSelectByTicket(g_symbols[idx].ticket))
     {
      bool exit_long  = g_symbols[idx].is_long  && fast_curr < slow_curr;
      bool exit_short = !g_symbols[idx].is_long && fast_curr > slow_curr;
      if(exit_long || exit_short)
        {
         if(g_trade.PositionClose(g_symbols[idx].ticket))
           {
            string dir = g_symbols[idx].is_long ? "LONG" : "SHORT";
            Print(StringFormat("SeykotaEA: %s %s closed | EMA reversal | Heat:%.1f%%",
                               g_symbols[idx].symbol, dir, CalcTotalHeat()));
            g_symbols[idx].position_open = false;                     // Write back through array index
            g_symbols[idx].ticket        = 0;
            g_symbols[idx].stop_price    = 0;
           }
        }
      return;
     }
   else
      g_symbols[idx].position_open = false;                           // Position closed externally
//--- Heat cap check
   if(current_heat >= InpMaxHeatPct)
     {
      Print(StringFormat("SeykotaEA: %s — heat cap %.1f%% reached — entry blocked.",
                         g_symbols[idx].symbol, InpMaxHeatPct));
      return;
     }
//--- ADX filter
   if(adx < InpADXMinLevel)
      return;
//--- EMA crossover signal
   bool bull_cross = (fast_prev < slow_prev && fast_curr > slow_curr);
   bool bear_cross = (fast_prev > slow_prev && fast_curr < slow_curr);
   if(!bull_cross && !bear_cross)
      return;
   bool   is_long   = bull_cross;
   double stop_dist = atr * InpATRMultiplier;
   double lots      = CalcLots(g_symbols[idx].symbol, atr);
   if(lots <= 0)
      return;
   long   stop_lv   = SymbolInfoInteger(g_symbols[idx].symbol, SYMBOL_TRADE_STOPS_LEVEL);
   double min_dist  = stop_lv * SymbolInfoDouble(g_symbols[idx].symbol, SYMBOL_POINT);
   if(is_long)
     {
      double ask = SymbolInfoDouble(g_symbols[idx].symbol, SYMBOL_ASK);
      double sl  = NormalizeDouble(ask - stop_dist,
                                   (int)SymbolInfoInteger(g_symbols[idx].symbol, SYMBOL_DIGITS));
      if(ask - sl < min_dist)
         sl = NormalizeDouble(ask - min_dist - SymbolInfoDouble(g_symbols[idx].symbol, SYMBOL_POINT),
                              (int)SymbolInfoInteger(g_symbols[idx].symbol, SYMBOL_DIGITS));
      if(g_trade.Buy(lots, g_symbols[idx].symbol, ask, sl, 0, "Seykota Long"))
        {
         ulong deal = g_trade.ResultDeal();
         if(deal > 0 && HistoryDealSelect(deal))
            g_symbols[idx].ticket = (ulong)HistoryDealGetInteger(deal, DEAL_POSITION_ID);
         else
            g_symbols[idx].ticket = g_trade.ResultOrder();
         g_symbols[idx].stop_price    = sl;
         g_symbols[idx].is_long       = true;
         g_symbols[idx].position_open = true;
         datetime t = iTime(g_symbols[idx].symbol, PERIOD_D1, 1);
         DrawLabel(g_symbols[idx].symbol, "L" + g_symbols[idx].symbol, t,
                   iLow(g_symbols[idx].symbol, PERIOD_D1, 1) - PipSize(g_symbols[idx].symbol) * 5,
                   "SEY L", clrDodgerBlue);
         Print(StringFormat("SeykotaEA: LONG %s | Lots:%.2f | SL:%.5f | ADX:%.1f | Heat:%.1f%%",
                            g_symbols[idx].symbol, lots, sl, adx, CalcTotalHeat()));
        }
     }
   else
     {
      double bid = SymbolInfoDouble(g_symbols[idx].symbol, SYMBOL_BID);
      double sl  = NormalizeDouble(bid + stop_dist,
                                   (int)SymbolInfoInteger(g_symbols[idx].symbol, SYMBOL_DIGITS));
      if(sl - bid < min_dist)
         sl = NormalizeDouble(bid + min_dist + SymbolInfoDouble(g_symbols[idx].symbol, SYMBOL_POINT),
                              (int)SymbolInfoInteger(g_symbols[idx].symbol, SYMBOL_DIGITS));
      if(g_trade.Sell(lots, g_symbols[idx].symbol, bid, sl, 0, "Seykota Short"))
        {
         ulong deal = g_trade.ResultDeal();
         if(deal > 0 && HistoryDealSelect(deal))
            g_symbols[idx].ticket = (ulong)HistoryDealGetInteger(deal, DEAL_POSITION_ID);
         else
            g_symbols[idx].ticket = g_trade.ResultOrder();
         g_symbols[idx].stop_price    = sl;
         g_symbols[idx].is_long       = false;
         g_symbols[idx].position_open = true;
         datetime t = iTime(g_symbols[idx].symbol, PERIOD_D1, 1);
         DrawLabel(g_symbols[idx].symbol, "S" + g_symbols[idx].symbol, t,
                   iHigh(g_symbols[idx].symbol, PERIOD_D1, 1) + PipSize(g_symbols[idx].symbol) * 5,
                   "SEY S", clrOrangeRed);
         Print(StringFormat("SeykotaEA: SHORT %s | Lots:%.2f | SL:%.5f | ADX:%.1f | Heat:%.1f%%",
                            g_symbols[idx].symbol, lots, sl, adx, CalcTotalHeat()));
        }
     }
  }
The function logs the current heat percentage whenever a trade opens. Watching this value across a multi-year backtest immediately shows how frequently the heat cap was the binding constraint rather than the entry signal itself and how much damage it prevented.
OnInit, OnDeinit, and OnTick
//+------------------------------------------------------------------+
//| Expert initialization function                                   |
//+------------------------------------------------------------------+
int OnInit()
  {
   if(!ParseSymbols())
      return INIT_FAILED;
   g_trade.SetExpertMagicNumber(InpMagicNumber);
   g_trade.SetDeviationInPoints(InpSlippage);
   Print(StringFormat("SeykotaEA initialized | Symbols:%d | HeatCap:%.1f%% | Magic:%d",
                      g_sym_count, InpMaxHeatPct, InpMagicNumber));
   return INIT_SUCCEEDED;
  }

//+------------------------------------------------------------------+
//| Expert deinitialization function                                 |
//+------------------------------------------------------------------+
void OnDeinit(const int reason)
  {
   for(int i = 0; i < g_sym_count; i++)
     {
      IndicatorRelease(g_symbols[i].fast_handle);
      IndicatorRelease(g_symbols[i].slow_handle);
      IndicatorRelease(g_symbols[i].adx_handle);
      IndicatorRelease(g_symbols[i].atr_handle);
     }
   ClearLabels();
  }

//+------------------------------------------------------------------+
//| Expert tick function                                             |
//+------------------------------------------------------------------+
void OnTick()
  {
   double current_heat = CalcTotalHeat();                             // Compute heat once per tick
   for(int i = 0; i < g_sym_count; i++)
     {
      datetime bar_time = iTime(g_symbols[i].symbol, PERIOD_D1, 0);
      if(bar_time == g_symbols[i].last_bar)
         continue;                 // Same D1 bar — skip
      g_symbols[i].last_bar = bar_time;
      ProcessSymbol(i, current_heat);                                 // Process using index
     }
  }
//+------------------------------------------------------------------+
"OnTick()" computes the current heat once at the top and passes it to every symbol's processing call. This avoids recalculating heat mid-loop and prevents one symbol's entry from affecting the next symbol's decision within the same iteration.
Note
The EA trades multiple symbols simultaneously and requires all configured symbols to have sufficient daily history in the strategy tester. Strategy tester note: MT5 can test multi-symbol EAs only if all required symbols are downloaded and available in the terminal history.
The heat calculation and position tracking work correctly in the tester because position queries use the tester's position model/state rather than per-symbol chart context.
Verify that all five symbols have sufficient D1 history before running.
What to Expect
Seykota's system is a long-term trend follower. On a five-year test with a 200-day slow EMA, expect between 3 and 8 crossover signals per symbol per year. Many crossovers will fire in ranging markets and be filtered by the ADX check—the journal will log every rejected signal with the ADX value that caused the rejection. The heat cap will block some signals entirely during periods when multiple trends are running simultaneously—the journal will log these blocks with the current heat percentage.
The system expects to make money on a small percentage of trades that catch major multi-month trends. Most trades will be small losses. The average winner should be several times the average loser. A long test period—at least five years—is needed to see enough trend cycles to evaluate the system fairly.
Known Limitations
The EA runs all symbols from a single chart. The Strategy Tester simulates this correctly because position queries are live, but in live trading the EA must remain running continuously to process all symbols. If the EA is restarted, "st.position_open" and "st.ticket" reset to zero, and the EA does not know about positions that were open before the restart. Adding state recovery logic—scanning open positions by magic number on "OnInit()"—would address this.
The heat cap is evaluated at the moment of the entry signal. If a position's residual heat later increases because the stop has not yet advanced—perhaps the market moved sideways for several bars—the heat could temporarily exceed the cap without any new entry being blocked. The cap is a gating mechanism at entry time, not a continuous hard limit on total exposure. Traders with strict heat discipline should add a check that closes the most recently opened position if heat exceeds the cap plus a tolerance.
The 200-day slow EMA requires approximately 200 bars of daily history to be fully warmed up. The EA will generate signals using a partially warmed EMA on the first 200 bars of any data series. Add a bar count check in "ProcessSymbol()" if this is a concern.
The ADX filter blocks entries in ranging markets but does not distinguish between a market that has been ranging for two weeks and one that has been ranging for two years. A long base of ADX below 20 followed by an ADX spike above 20 is often a more reliable entry context than a market that has been barely above 20 for months. The current implementation treats all ADX-above-threshold conditions identically.
Multi-symbol tick volume correlations are not accounted for. When five major pairs are simultaneously trending in a dollar-driven move, their ATR values are all high simultaneously and their position sizes are all small simultaneously. The heat contributions per position decrease during high-correlation events. This is actually protective behavior—correlation events naturally reduce exposure. But it also means the heat cap is less binding precisely when market risk is highest.
Conclusion
Ed Seykota's contribution to systematic trading is often reduced to "use exponential moving averages and cut losses." The EMA crossover entry and the ATR position sizing are well documented. The portfolio heat concept—the part that actually prevented catastrophic losses during correlated market events—is almost always omitted.
This article implements both. The entry system is a direct translation of Seykota's dual EMA crossover with an ADX quality filter. The position sizing is his exact formula: equity risk divided by the dollar value of the ATR stop. The heat monitor computes residual risk across all open positions on every tick and blocks new entries when the total exposure reaches the configured cap.
The result is a system that behaves the way Seykota described: it runs quietly across multiple markets, taking small losses on false signals and waiting for the major trends that produce large gains. The portfolio heat monitor is what allows it to run across five or more markets simultaneously without one correlated event destroying the account.
All code was compiled and tested in MetaEditor (MetaTrader 5). Copy "SeykotaEA.mq5" to "MQL5\Experts\" and compile in MetaEditor with no additional dependencies. Ensure all symbols in "InpSymbols" have sufficient D1 history downloaded before running. Recommended initial tests on EURUSD, GBPUSD, AUDUSD, USDCHF, and USDJPY on the daily timeframe. Always test on a demo account before live deployment.
Warning: All rights to these materials are reserved by MetaQuotes Ltd. Copying or reprinting of these materials in whole or in part is prohibited.
This article was written by a user of the site and reflects their personal views. MetaQuotes Ltd is not responsible for the accuracy of the information presented, nor for any consequences resulting from the use of the solutions, strategies or recommendations described.

 Building a News Filter Engine in MQL5 Using a Local Economic Calendar File
 Developing a Multi-Currency Expert Advisor (Part 31): Secrets of the Optimization Project Creation Step (I)
 Neural Networks in Trading: Heterogeneity-Informed Meta-Parameter Learning (Key Components)
 From Basic to Intermediate: Queues, Lists, and Trees (VIII)

- Free trading apps
- Over 8,000 signals for copying
- Economic news for exploring financial markets
You agree to website policy and terms of use