

Analyzing the Hourly Movement of Trading Symbols and Their Spreads in MetaTrader 5
 2 476
2 476
 2
2

Introduction
Imagine an ocean. Its waves appear chaotic and unpredictable to the casual observer. But an experienced sailor knows about tides - powerful, rhythmic and predictable forces that move the entire mass of water. These forces are subject to the laws of celestial mechanics and can be calculated with high accuracy.
Forex is very much like that ocean. For a beginner, this is a flickering of numbers and chaotic candlesticks, but for a professional, it is an orderly flow of capital, driven by fundamental forces, the main one of which is time. The foreign exchange market does not operate in a vacuum - its life cycle is determined by business activity in the world's key financial centers. As one center awakens and begins work, another is already closing. This creates a continuous cycle of liquidity surges, unidirectional price movements, volatility, and, most importantly for us, predictable price behavior patterns. In the previous article, we assessed the quality of spread trading based on seasonal factors in the Forex market in the long and medium term. In this article, we will analyze intraday spread movements between symbols.
We will look at a powerful tool for analyzing intraday patterns - the ISI ProSpread SMA indicator, where:
- ISI — Index Seasonality Indicator (seasonality indicator),
- Spread — spread (working with a pair of instruments),
- SMA — Simple Moving Average.
Here we will examine not only the ways to use the indicator, but also the mathematical theory that anticipates market movements. Let's talk about how probability theory and mathematical statistics help us understand and calculate recurring market patterns.
Choosing the right time to trade
The market, especially the currency one, is not chaos. It is a vast array of participants (banks, funds, algorithms, retail traders) acting according to their own rules, plans, and reactions to economic events. Many of these actions are repeated every day at the same time:- opening/closing of trading sessions (Asian, European, American),
- release of important economic news (e.g. Nonfarm Payrolls),
- operational activities of banks (position rollovers, hedging),
- operation of algorithmic systems launched according to a schedule.
This creates seasonal patterns - statistically significant recurring price movements at certain times. Let's first take a look at the trading statistical approach.
Types and schedules of trading sessions on the Forex currency marketA trading session is defined as a period of time during which banks and trading platforms of countries within the same geographic area are active in the foreign exchange market. Trading determines fluctuations in global currency prices, allowing traders to buy lower and sell higher, profiting from the difference.
A session is the official trading time of the exchanges, when most currency trades are carried out, orders for securities and other financial instruments are submitted and processed, as well as statistics and reports are published. The Forex market operates continuously because while evening falls and trading closes in one part of the world, it is already morning and the new business day in another. This allows for currency exchange around the clock, regardless of the local stock exchange opening hours.
Choosing the right time to trade is one of the factors that determines the success of a Forex trader. The Forex trading week starts on Monday morning and ends on Friday evening with the closing of the New York trading session. The start of work is considered to be the opening of the Pacific session in Wellington (New Zealand) on Monday morning local time. Greenwich Mean Time is used as a common reference point for all countries, from which time zones are measured, to avoid confusion when determining the start of trading in a particular geographic location.
Geographically, all exchanges are grouped into four time zones: those regional exchanges that have the greatest influence on price fluctuations are located in the specified cities. Here are the main regions where daily currency trading takes place. Overlapping trading sessions during the day: the greatest activity and volatility occur during periods of their intersection (London/New York).
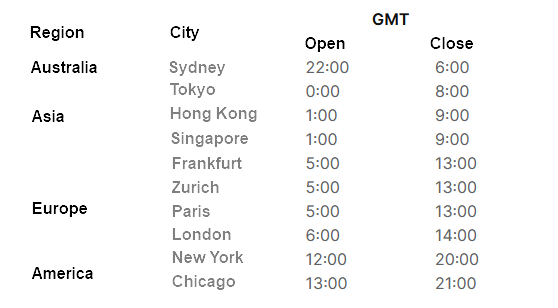
The time shown is approximate and varies depending on the transition to summer/winter time in different countries
Each trading session has its own unique "temperament", namely:
| Financial center | Session "character" | Key instruments |
|---|---|---|
| Sydney/Wellington | Calm, often sets the direction for the day | AUD, NZD, AUDNZD, AUDUSD |
| Tokyo/Asia | Can enhance or correct movement | JPY, AUD, NZD, USDJPY |
| London/Europe | The most volatile session, sets the main volume | EUR, GBP, CHF, EURUSD, GBPUSD |
| New York/America | High volatility, reacts to news | USD USD, CAD, USDCAD, USD pairs |
It is clear that trading takes place around the clock, smoothly flowing from one region to another. Sessions overlap each other, creating a unified trading environment for making trades.
The European region has the largest volume of currency trades: at the opening of the London market, its share amounts to approximately 30% of all transactions per day. The market operates around the clock, but takes breaks on weekends and holidays when activity decreases. During such periods, there is a high probability of a sharp short-term change in the exchange rate due to the execution of client requests by one or more large banks in another region. The main thing is to choose the most convenient and profitable time for trading.
Features of trading sessions
For market participants, it is important to understand not only the start and end times of trading, but also their distinctive features. Each region has developed its own style and rules for conducting trades, transaction volumes, and distinctive strategies that distinguish them from other exchanges. Each session relies on its own currency pairs and reacts more sharply to external economic factors in its geographic zone than to events further afield. Common to all are the smooth movement of currency prices at night and the increase (sometimes explosive) in volatility during the day.
Asian session
Asian trading peaks between 8:00 a.m. and 12:00 p.m., when European financial centers open, traders determine currency movements, and open positions. However, its usual characteristics are low liquidity and volatility. Currency pairs remain within tight trading ranges, setting the stage for strong price movements in the future. The main ones, involving the pound sterling (GBP), the US dollar (USD), the euro (EUR) and the Swiss franc (CHF), are in a "dormant" state. The ones that are actively traded are:
- Japanese yen (JPY),
- Singapore and Australian dollars,
- Chinese yuan (CNY).
The relative disadvantages of the session include low volatility of a few tens of points, which determines small profits for traders and forces brokers to set high spreads. If the price corridor is broken, this trend continues in subsequent trades.
European session
The trends that emerged in Asia are being picked up by the European Forex session. Its working hours are from 10:00 a.m. to 7:30 p.m. Main players: German, French and English exchanges in Paris, Zurich, Frankfurt and Luxembourg. London occupies a special place in the currency market due to its geographical location and the fact that all the world's largest financial groups have their offices there.
From the moment the London Stock Exchange opens, most market trends are formed and continue until the start of the American session. Since European trading overlaps with two other sessions, and the UK capital is the largest financial centre on the planet, this time period accounts for the largest share of transactions carried out on Forex. The distinctive features are large monetary movements and rapid changes in quotes, as well as high volatility.
American session
The American trading session is characterized by increased aggressiveness and unpredictability. The hottest time is considered to be the period of overlapping European and American trades. The latter open at 4:00 p.m. in New York and close at 1:00 a.m. in Chicago. The release of morning US statistics coincides with the release of afternoon reports in Europe, after which trading volumes increase and the market becomes saturated with liquidity.
The American currency market, which is only slightly smaller than the European one, is doubling the number of players and transactions and is capable of reversing or significantly changing emerging trends. This is also facilitated by the emergence of ultra-aggressive hedge funds on the market, as well as firms and companies interested in currency speculation that can play a team game.
Strong surges are observed on Forex from 4:00 to 7:00 p.m. – the time when sessions overlap. During this period, most traders try to squeeze as much as possible out of the market, then close the position and not return to trading until the next day. However, there are fluctuations in trading on the American exchange due to the closure of the European market.
When price activity subsides and large traders leave the market, US banks are able to change the exchange rate in their favor at a much lower cost. The leading currencies remain USD, GBP and JPY, and to a lesser extent EUR. However, the Canadian dollar, Mexican peso and Brazilian real are gaining more importance.
Pacific session
Session overlap hours in this region are so quiet that some traders do not even consider Pacific trading to be a full session. Its operating hours are approximately from 12:00 a.m. to 9:00 a.m., and its main distinguishing features are small volumes and low volatility.
This platform is considered the most suitable for novice traders. Here you can acquire trading skills and try out different strategies with minimal risk. Considerable currency movements on the Australian and New Zealand exchanges require extraordinary statements from the US Federal Reserve, which are released after 10:00 p.m. Some activity appears with the opening of the Asian exchange, which is more aggressive and lively. The main currencies are the Australian and New Zealand dollars, as well as the Japanese yen.
Trading session indicators
Trading session indicators are designed to visualize price changes over a given period of time. Most activity occurs during periods when the opening and closing times of exchanges overlap. The highest activity typically occurs when London closes and America opens, somewhere between 4:00 and 7:00 p.m.
The Asian session is considered the calmest (though not always so recently) period with the lowest volatility. The highest concentration of trading activity occurs during the London and New York trading hours. Each trader is forced to adapt to the trading sessions they are physically located in. The main thing you need to adapt to is the hourly movements of currency symbols, which we will discuss in this article. Understanding trading session times is essential to understanding how a particular symbol you are trading might perform at a given hour and time period.
Markets often experience periods of increased volatility. This factor should also be taken into account when day trading. One of the popular indicators is I-session, which displays the performance of each session in different colors and provides numerical values (in points) of price changes. Next, we will take a detailed look at how to install, configure, and interpret all the capabilities of this powerful tool. You will learn about four calculation equations, learn how to read the information panel, and integrate the indicator signals into your trading system. Get ready to look at the market in a way you have never looked at it before - through the lens of time and probability.
Features of the trading symbols movement, interpretation of ISI ProSpread SMA readings
Key features of the indicator:
Multi-mode analysis (4 equations):
- SMA Spread/Price — moving average of spread or price,
- Price Difference — difference in prices (closing-opening),
- Volatility Index — volatility index,
- Candle Strength — candle strength.
Flexible settings:
- selecting trading hours (e.g. London session only),
- depth of analysis (number of history days),
- setting up spread coefficients,
- select a timeframe for analysis.
Visualization:
- indicator chart with zero line,
- dashboard with hourly statistics,
- color indication of bullish/bearish periods.
Operation algorithm:
- collects historical data for a specified period;
- analyzes price behavior for each hour of the selected range;
- calculates statistical probabilities;
- constructs an indicator curve using the selected formula;
- displays a summary table with the analysis results.
This indicator will be especially useful for intraday traders, arbitrage strategies, seasonal pattern analysis, and confirmation of trading signals.
The figures 1 and 2 below show the hourly movement of the EURUSD trading symbol depending on the hour: at 9:00, EURUSD shows an upward bias with a 64% probability, as indicated by the second line of the dashboard in green.
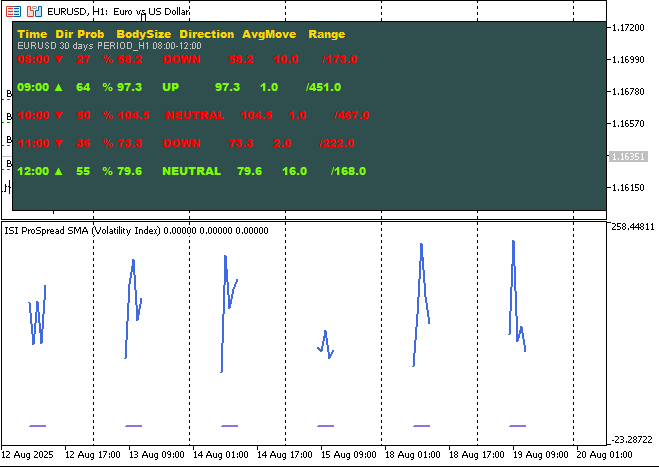
Fig. 1. Features of the hourly movement of EURUSD
The external input parameters shown correspond to formula type 2 of the indicator.
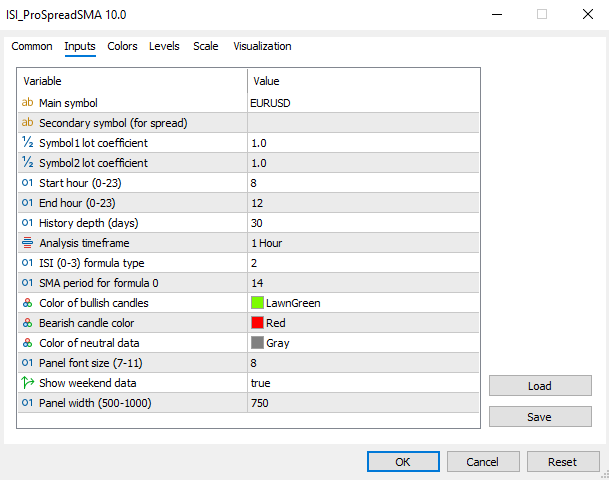
Fig. 2. Values of external variables for the EURUSD trading symbol
Figures 3 and 4 show the hourly movement of the GBPUSD trading symbol depending on the hour: at 9:00, GBPUSD shows an upward bias with a 68% probability, as indicated by the second line of the dashboard in green.
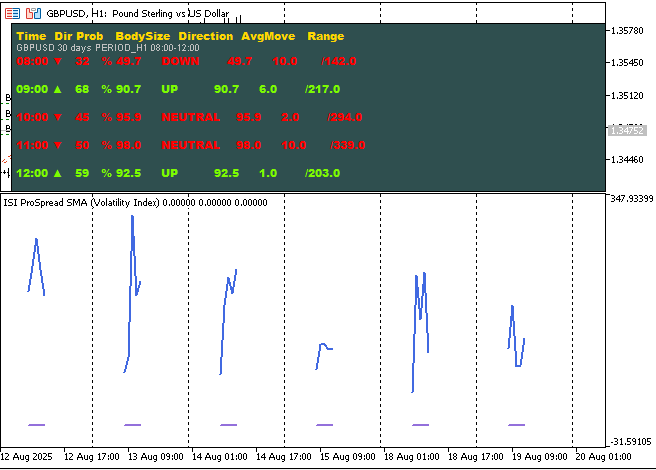
Fig. 3. Features of the hourly movement of GBPUSD
The external input parameters shown correspond to formula type 2 of the indicator.
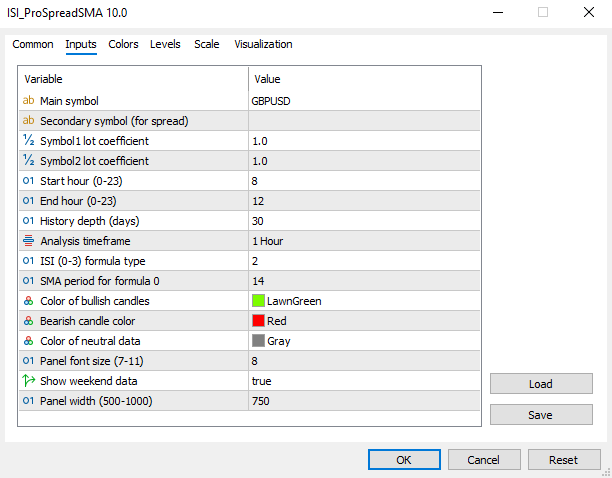
Fig. 4. Values of external variables for the GBPUSD trading symbol
Further, Figures 5 and 6 show the hourly movement of the spread of EURUSD-GBPUSD symbols using formula type No. 0.
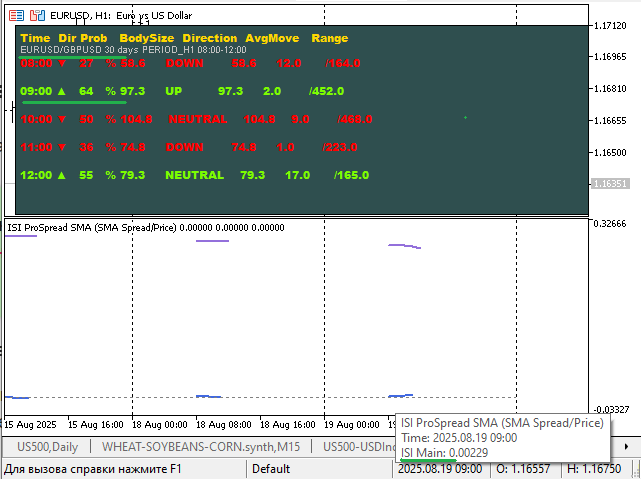
Fig. 5. Features of the hourly movement of the EURUSD-GBPUSD symbol spread

Fig. 6. Values of external variables for the EURUSD-GBPUSD symbol spread
Now the important question. What happens at, say, 11:30 a.m. London time? Banks and algorithmic funds are beginning to assess the situation, preparing for the close of the European day and the opening of the American one. They execute large orders from clients and hedge risks. What are they doing tomorrow at 11:30 a.m.? Day after tomorrow? In a month?
They are doing the same thing! Of course, they do not demonstrate absolute identity, but their actions, determined by the logic of workflow, regulations and liquidity cycles, form powerful statistical anomalies - seasonal patterns. This means that the price at the same hour on different days has a statistically significant tendency to move in a certain direction with predictable force. This is not "fortune telling by reading tea leaves", but hard math and probability theory.
The magic of repetition: The phenomenon of intraday seasonality
The problem is that it is almost impossible to see these patterns with the naked eye on a chart. They are drowned in the noise of random fluctuations. It is like trying to hear a melody by listening to just one note in a symphony. What is needed is an instrument that can "listen" to the entire symphony and identify the repeating harmonies within it.
What do these data provide? Depending on the hours you trade, you can tailor your trading systems based on statistically significant and pattern-driven movements of currency symbols during those hours, thereby gaining a statistical advantage. The bridge between theory and practice is the ISI ProSpread SMA indicator. This is your personal statistician, mathematician and analyst working 24/7. It does not predict the future, it calculates probabilities.
How does it do that? The indicator collects data by analyzing the history depth you specify (30, 60, 90 days) and categorizes it by breaking down all historical data by the hours of the selected trading session (e.g., from 10:00 a.m. to 7:00 p.m. Moscow time).
The indicator then analyzes by calculating patterns characteristic of each hour. You can reflect on and program your discovered patterns into another formula. To do this, simply add the function body to the indicator code and call it in external variables:
- probability of upward or downward movement (%),
- average movement (mathematical expectation) in points,
- strength and volatility of the movement typical for that hour.
The indicator then presents all this information in the form of a clear information panel directly on your chart and as a curve in the indicator window.
How this benefits a trader:
- confidence: you enter into a trade not because "it seems like it will go up", but because statistics for the last N days show a 70% probability of an upward movement at this particular hour;
- accuracy: you know not only the direction, but also the approximate target level based on the average movement;
- flexibility: the indicator works not only with pairs, but also with spreads (the difference between two assets), opening up arbitrage and market-neutral strategies;
- discipline: you stop trading everything and only trade during your best hours, where you have a statistical advantage.
This is not a "grail". It systematizes your approach by moving trading from the realm of intuition to the realm of measurable and manageable probabilities.
How to use it:- for one symbol: shows the average price level for the selected period
- for a spread: shows the average value of the difference between two instruments
- the intersection of the current price with this line may indicate overbought/oversold state
Example:
- EURUSD: SMA(90 days, 8:00-12:00) = 1.0850 — if the price is higher, the market may be overbought
- EURUSD/GBPUSD spread: SMA = 0.0015 — if the current spread is higher, EUR is stronger than GBP
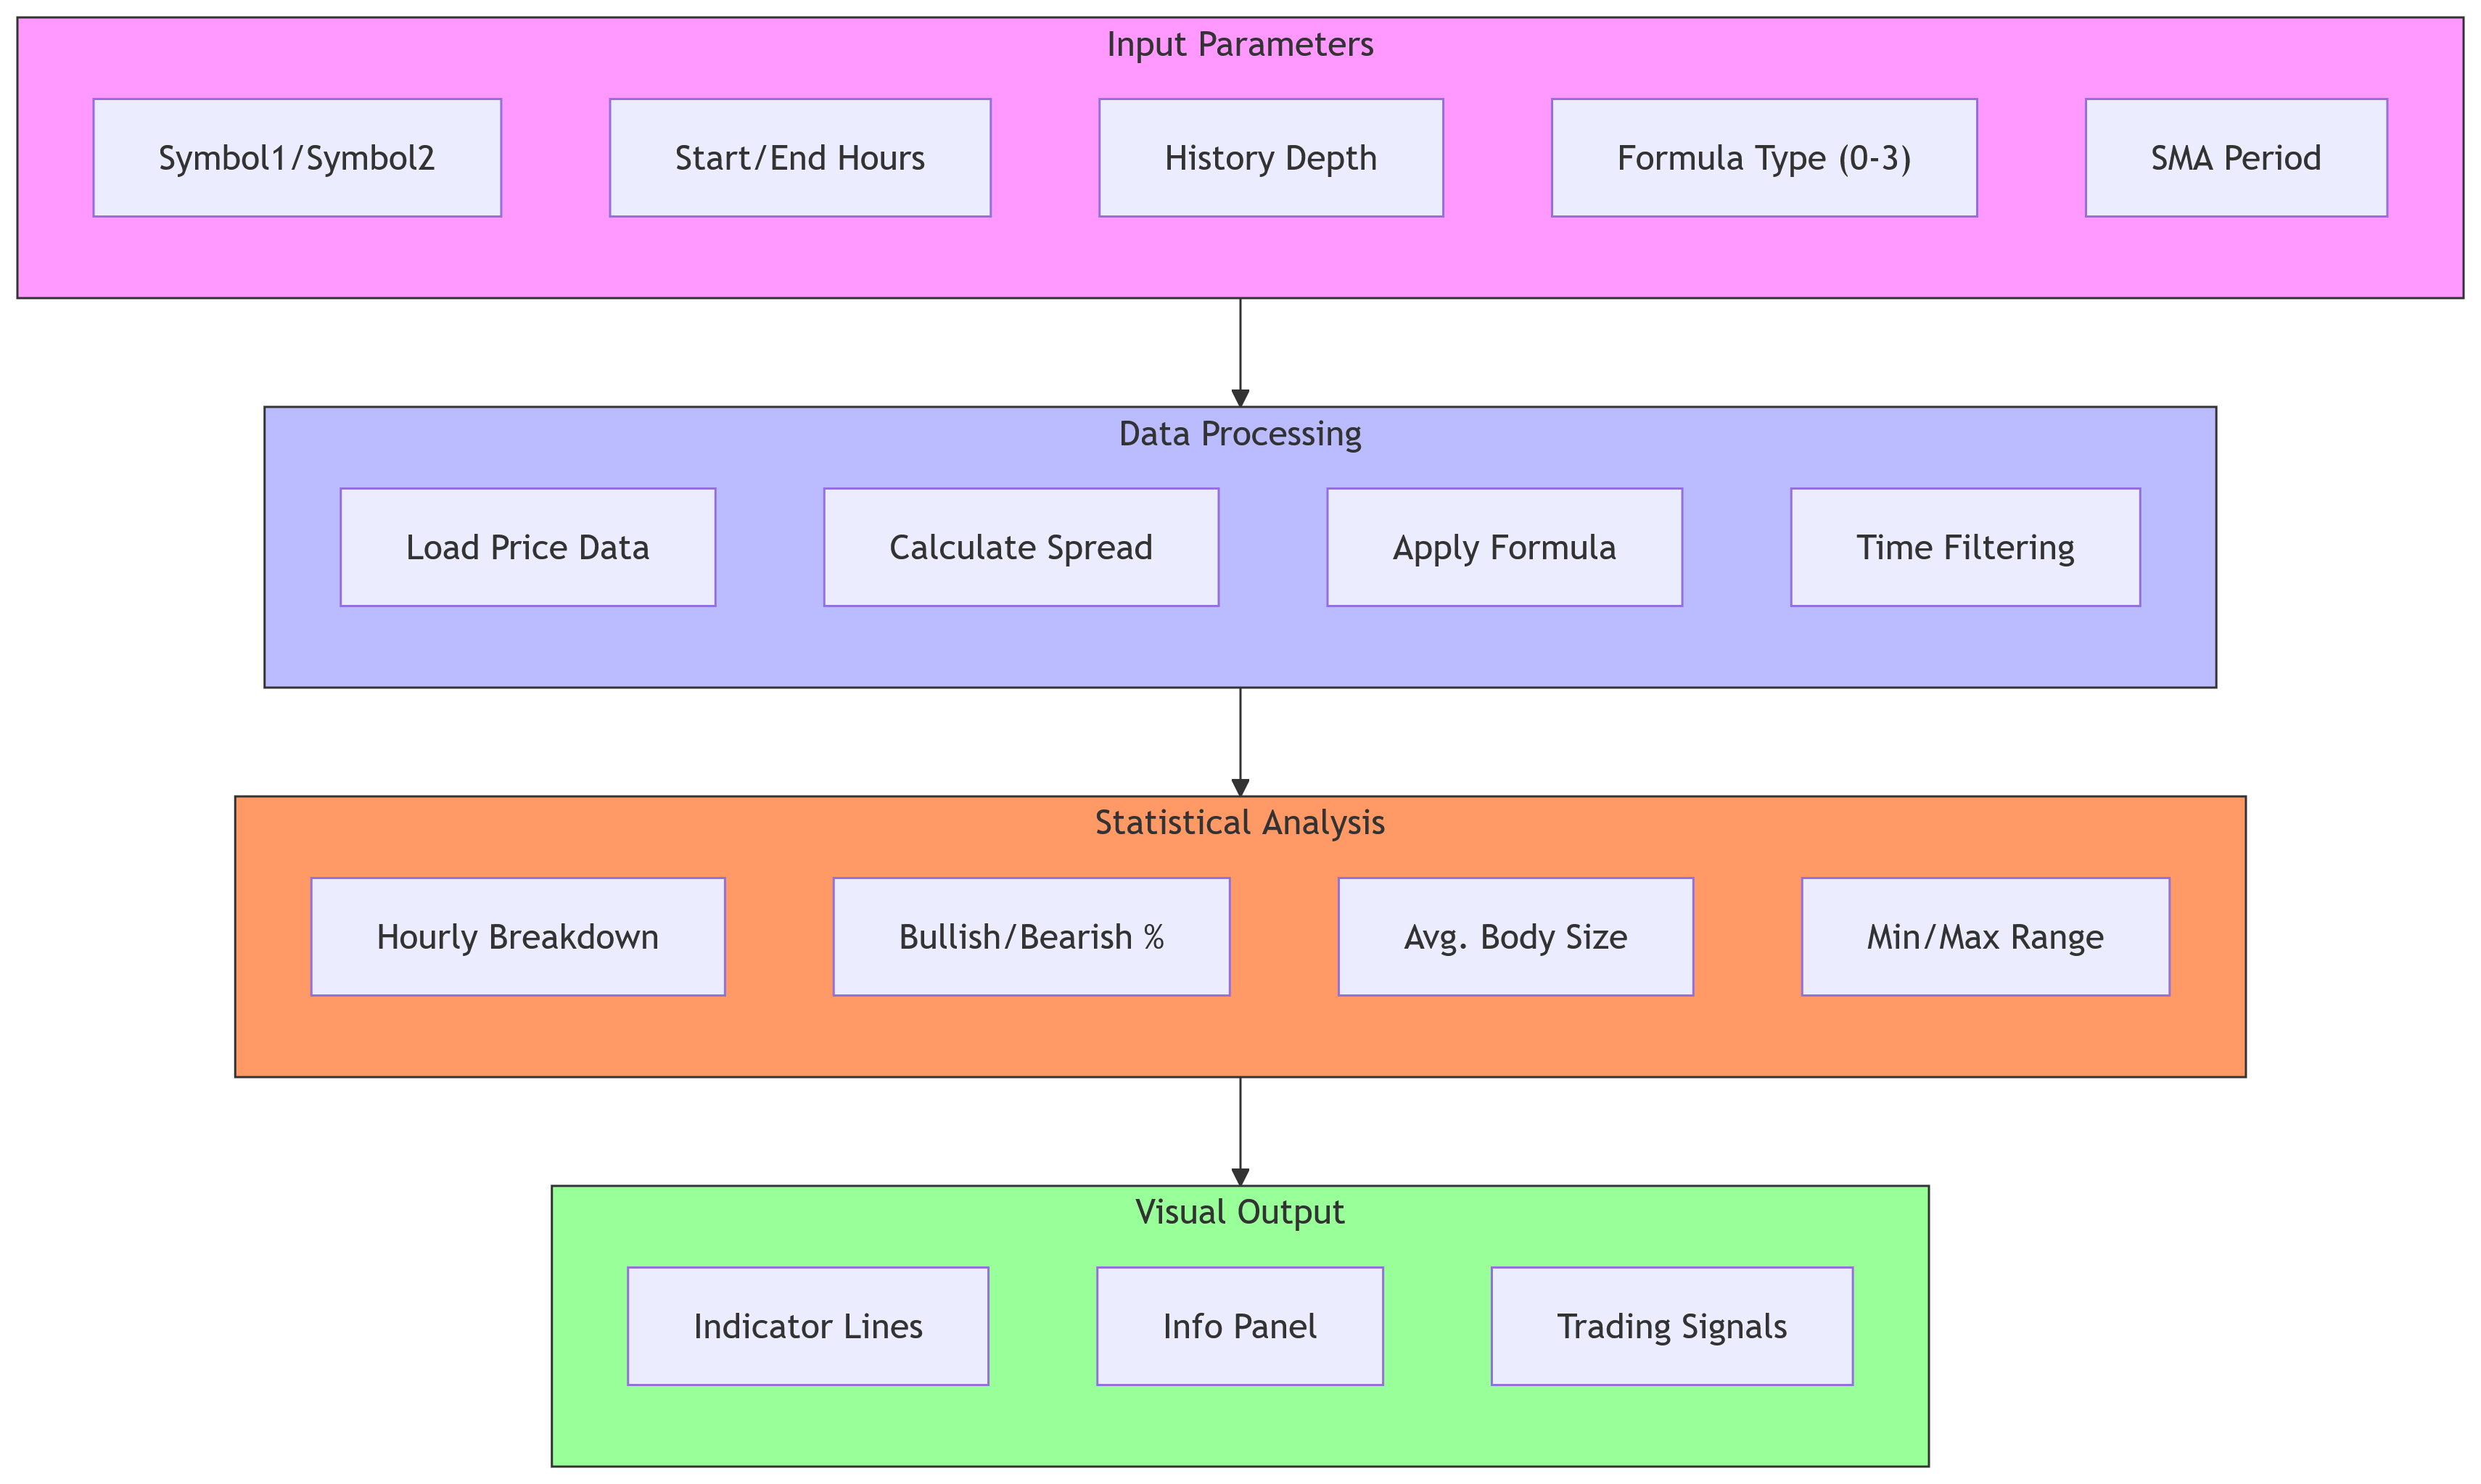
Structural diagram of the indicator
The diagram shows how user data is processed and analyzed, ultimately informing the possible direction of movement of a trading symbol or symbol spread.
Key components:
- input parameters block (purple)
- symbol configuration (single or spread)
- time window selection
- calculation settings
- data processing unit (blue)
- loading raw data
- spread calculation if necessary
- calculations using basic formulas
- time filtering
- statistical analysis block (orange)
- hourly performance indicators
- probability calculations
- volatility measurements
- historical extremes
- visual output block (green)
Indicator input parameters
input string InpSymbol1 = "EURUSD";        // Main symbol
input string InpSymbol2 = "";              // Secondary symbol (for spread)
input double InpLotCoeff1 = 1.0;           // Symbol1 lot coefficient
input double InpLotCoeff2 = 1.0;           // Symbol2 lot coefficient
input int InpStartHour = 8;                // Start hour (0-23)
input int InpEndHour = 12;                 // End hour (0-23)
input int InpHistoryDays = 30;             // History depth (days)
input ENUM_TIMEFRAMES InpAnalysisTF = PERIOD_H1; // Analysis timeframe
input int InpFormulaType = 0;              // ISI formula type (0-3)
input int InpMAPeriod = 14;                // SMA period for formula 0
Algorithm for application for intraday trading:
- Identify the hours with the highest probability of movement (e.g. 60%+)
- Find the periods with the maximum average movement
- Compare current price behavior with historical data
- Enter a trade when the signals match
Detailed description of indicator formulas
The indicator is versatile and allows us to analyze both a single instrument and the spread between two. The choice of formula depends on your trading style.
Formula 0: Spread/Price SMA (the main and most sophisticated formula)
The formula calculates the Moving Average (SMA):
- if one instrument is selected, its price is smoothed;
- If two instruments are selected, the spread is calculated first (K1Price1 – K2Price2), then smoothed by SMA.
Smoothing removes market noise and helps you see the overall trend.
To use it effectively, look for moments when the ISI Main line (blue) crosses the zero level from top to bottom
(bearish signal) or from bottom to top (bullish signal).
SMA equation:
- For one symbol: SMA = SUM(Price for N periods) / N
- For a spread: SMA = SUM(Spread for N periods) / N
Spread = K1*Price1 - K2*Price2
void CalculateFormula0(const int rates_total, const int prev_calculated)
{
   for(int i = start; i < rates_total; i++)
   {
      if(isSpread)
      {
         // Calculate spread SMA
         double sum = 0.0;
         int count = 0;
         for(int j = 0; j < InpMAPeriod && (i - j) >= 0; j++)
         {
            sum += InpLotCoeff1 * Temp_Open[i-j] - InpLotCoeff2 * Temp_Open2[i-j];
            count++;
         }
         PriceSMA_Buffer[i] = sum / count;
      }
      else
      {
         // Calculate the SMA price for one symbol
         double sum = 0.0;
         int count = 0;
         for(int j = 0; j < InpMAPeriod && (i - j) >= 0; j++)
         {
            sum += Temp_Open[i-j];
            count++;
         }
         PriceSMA_Buffer[i] = sum / count;
      }
      ISI_Buffer[i] = PriceSMA_Buffer[i];
   }
}
Use in trading
When the ISI line crosses the Zero Line from bottom to top, it may indicate a possible upward price movement, while when it crosses from top to bottom, it may indicate a downward price movement. A strong trend is observed when the ISI value is far from the zero line.
For example, if we analyze EURUSD from 8:00 to 12:00 with an SMA period of 14, the indicator will show the average price value for the last 14 candles. If the current price is above the SMA, further upward movement is likely; if it is below, downward movement is likely.
Trading strategy
Working with the indicator is usually structured like this: we wait for the start of the selected trading period (for example, from 8:00 a.m.), look for the intersection of the price and the SMA, open a position in the direction of the intersection, and close it when the intersection reverses or at the end of the trading window.
Example with spreads
If we analyze the EURUSD/GBPUSD spread with coefficients of 1.0/0.8 for 14 periods, the indicator will show a smoothed value of the difference between the pairs. A value above zero indicates the potential strength of the first instrument in relation to the second, a value below zero indicates weakness. Crossing the zero line may indicate a change in trend.
Formula 1: Price difference
It shows the difference between the current price and the opening price for one instrument or the difference in spreads for two instruments.
Formula for one symbol:ISI = Close - Open
For a spread:
ISI = (K1*Close1 - K2*Close2) - (K1*Open1 - K2*Open2)
void CalculateFormula1(const int rates_total, const int prev_calculated)
{
   for(int i = start; i < rates_total; i++)
   {
      if(isSpread)
      {
         double spreadClose = InpLotCoeff1 * Temp_Close[i] - InpLotCoeff2 * Temp_Close2[i];
         double spreadOpen = InpLotCoeff1 * Temp_Open[i] - InpLotCoeff2 * Temp_Open2[i];
         ISI_Buffer[i] = spreadClose - spreadOpen;
      }
      else
      {
         ISI_Buffer[i] = Temp_Close[i] - Temp_Open[i];
      }
   }
}
The indicator shows the difference between the closing and opening prices of the candle, that is, its actual body in points. A positive value indicates a bullish candle, a negative value indicates a bearish one. The larger the magnitude of the value, the stronger the movement. This is useful for confirming the strength of a trend at a particular hour.
Use in trading
If ISI is greater than zero, the candle is bullish; if it is less than zero, it is bearish. Strong deviations from the zero line signal a powerful move. For example, for GBPUSD at 10:00 a value of +0.00010 means an increase of 10 points since the beginning of the hour, a negative value means a decrease.
Strategy
At the beginning of each hour, the opening price is fixed. If the difference reaches +150 points, the instrument or spread is likely to grow; if -150, it is likely to fall. The position is closed at the end of the hour or when the target profit is reached.
ISI > 0 → bullish candle. ISI < 0 → bearish candle. The greater the deviation from the Zero Line, the stronger the movement.
Formula 2: Volatility index
Measures the volatility of an instrument or the difference in volatility between two instruments.
Mathematical representation for one symbol:ISI = (High − Low) / Point
For a spread:
ISI = (K1*(High1-Low1) - K2*(High2-Low2)) / Point
void CalculateFormula2(const int rates_total, const int prev_calculated)
{
   for(int i = start; i < rates_total; i++)
   {
      if(isSpread)
      {
         double range1 = Temp_High[i] - Temp_Low[i];
         double range2 = Temp_High2[i] - Temp_Low2[i];
         ISI_Buffer[i] = (InpLotCoeff1 * range1 - InpLotCoeff2 * range2) / symbol1Point;
      }
      else
      {
         double range = Temp_High[i] - Temp_Low[i];
         ISI_Buffer[i] = range / symbol1Point;
      }
   }
}
High values of the indicator demonstrate high volatility in a given hour, which indicates the likelihood of a breakout and strong moves. Low values, on the contrary, indicate a period of calm and consolidation. This helps us understand when it is best to enter or exit trades: active hours are suitable for breakout strategies, while quiet hours are for waiting or working within a range.
For example, on EURUSD the hourly range is 150 points, and the indicator shows the value of 150. For the EURUSD/GBPUSD spread with ranges of 150 and 120 points respectively and coefficients of 1.0/1.0, the indicator value is 30 points. The trading logic is simple: high values indicate increased volatility and the likelihood of strong moves, low values indicate consolidation, and sharp jumps may indicate an approaching breakout.
Formula 3: Candle strength
Evaluates the strength of the movement based on the size of the candle body (the difference between the open and close).
Mathematical representation for one symbol:
ISI = (Close − Open) / Point
For a spread:
ISI = (K1*(Close1-Open1) - K2*(Close2-Open2)) / Point
void CalculateFormula3(const int rates_total, const int prev_calculated)
{
   for(int i = start; i < rates_total; i++)
   {
      if(isSpread)
      {
         double body1 = Temp_Close[i] - Temp_Open[i];
         double body2 = Temp_Close2[i] - Temp_Open2[i];
         ISI_Buffer[i] = (InpLotCoeff1 * body1 - InpLotCoeff2 * body2) / symbol1Point;
      }
      else
      {
         double body = Temp_Close[i] - Temp_Open[i];
         ISI_Buffer[i] = body / symbol1Point;
      }
   }
}
Similar to Formula 1, here the values are expressed not in price, but in points, which is more convenient for assessing potential profit and calculating the lot. The indicator shows the strength of the target movement — the body of the candle — and not the general market noise in the form of shadows. If ISI is greater than zero, it indicates a strong bullish candle, if it is less than zero, it indicates a strong bearish candle. Values close to zero indicate market indecision and the formation of doji-type candles.
In trading, high positive values indicate the likelihood of continued upward movement, while negative values indicate the likelihood of continued downward movement. When the indicator is near zero, it is better to refrain from entering. For example, a value of +8 indicates a strong bullish candle, while -5 indicates a moderately bearish candle. If the indicator exceeds +10, you can consider entering in the direction of the candle, and exiting when a strong opposite one appears.
For EURUSD, a candle with an open of 1.10000 and a close of 1.10200 will give a value of +200 pips, which means a strong bullish move, and with an open of 1.10200 and a close of 1.10000, the result will be -200 pips, which indicates a strong bearish candle.
Trading interpretation:
- large positive values — strong bullish candle
- large negative values — strong bearish candle
- values close to zero — market uncertainty, doji
Dashboard - How to read data
The panel shows statistics for each hour in the selected range:
- probability of rise/fall
- average candle body size
- maximum/minimum range
- direction (UP/DOWN/NEUTRAL)
| Field | Description | Sample value |
|---|---|---|
| Time | Hour (for example, 08:00) | 08:00 |
| Dir (▲/▼) | Direction (▲ – bullish, ▼ – bearish) | ▲ |
| Prob | Movement probability (in %) | 65% |
| BodySize | Average candle body size (points) | 15.2 |
| Direction | General direction (UP/DOWN/NEUTRAL) | UP |
| AvgMove | Average movement (points) | 150 |
| Range | Minimum/maximum size | 50/250 |
Example output:
08:00 ▲ 65% 15.2 UP 15.2 10.0/25.0
09:00 ▼ 58% 12.5 DOWN 12.5 8.0/20.0
Interpretation:
- at 08:00, the probability of growth is 65%, the average candle size is 15.2 points → an upward movement is possible
- at 09:00, the probability of a fall is 58%, the average size is 12.5 points → a downward movement is possible
How to read the panel (using the line for 10:00 as an example):
10:00 ▲ 70% 12.5 UP 8.5 5.1/21.3
- 10:00 — time for which statistics were collected
- ▲ (green arrow) — visual indicator of direction (bullish/bearish)
- 70% — chance of a bullish move at this hour
- 12.5 points - the average size of the candle body (average movement) in points
- UP — text designation of the dominant direction (UP, DOWN, NEUTRAL)
- 8.5 points – average movement in points (duplicates the third column for convenience)
- 5.1/21.3 — minimum/maximum candle body size in history
So, by looking at the panel, you can understand in 10 seconds at what hours the market has historically been most active and in which direction. For example, if from 10:00 to 11:00 the probability of growth is 70% with an average movement of 15 points, and from 11:00 to 12:00 the probability of a fall is 65% with an average movement of 12 points, you already have a ready-made plan for the morning.
Instructions for using the indicator
Step 1: Indicator setup
- Select the base symbol (e.g. EURUSD).
- Specify a time range (e.g. 8:00-12:00).
- Set the history depth (for example, 30 days).
- Select the calculation formula (0-3).
Step 2. Statistics analysis
- If the probability is > 55% → look for an entry in the direction of the trend
- If the average candle size is large → you can set a wider TP
- If volatility is high, breakout strategies may be appropriate.
Step 3: Trading signals
An upward price movement is possible if: ISI is above Zero Line, the probability of growth is > 60%. A downward price movement is possible if: ISI is below Zero Line, probability of fall > 60%.
Setting parameters:
- Select a primary and (optionally) secondary symbol
- Set the time range for analysis (e.g. 8:00-12:00)
- Set the history depth (30-60 days recommended)
- Select the appropriate calculation formula
Dashboard analysis:
- Look at the movement probability (Prob)
- Estimate the average move size (AvgMove)
- Determine the direction (UP/DOWN/NEUTRAL)
The indicator is especially effective for trading during certain hours when the market exhibits seasonal patterns. For seasonal trading:
- use the dashboard to determine the most likely direction,
- compare the current movement with the average values from statistics,
- enter trades when the current movement is confirmed by statistics.
Indicator settings:
- Primary symbol — main trading instrument (for example, EURUSD)
- Secondary symbol - second instrument for spread calculation (leave blank for single instrument analysis)
- Start hour and End hour — time range for analysis (e.g. 8-12)
- History depth — in days (e.g. 30)
- Analysis timeframe — H1 is recommended
- Formula type — type of formula for calculation (0-3)
Practical recommendations
Start with the major currency pairs (EURUSD, GBPUSD), set the history depth to 30-60 days and choose trading hours with the most activity, for example 8:00-12:00 (London). Test different SMA formulas and periods to find the optimal parameters. The indicator automatically updates statistics and shows how the price behaved in similar periods earlier, which allows you to make informed trading decisions.
Add the indicator to the chart, specify symbols, lot coefficients, time interval, and history depth. Start with Formula 0 or 1. During trading hours, carefully study the panel: choose a time with high probability and strong average movement. For Formula 1, wait for a bullish candle (ISI > 0) or a bearish candle (ISI < 0). For example, if at 10:00 the probability is 70%, this is a strong signal. Enter a trade in the specified direction, set stop loss near the local minimum/maximum or at minBodySize, and take profit at avgBodySize. Close the trade either at take profit or at the end of the hour (e.g. 10:55) to capture the main movement and avoid a pullback.
Unique indicator properties
- Comprehensive analysis. This is not just an arrow indicator, it provides a complete statistical picture for each hour: probability, average movement, range.
- Versatility. It works with any instrument (currency, stocks, indices, crypto) and with spreads between them, opening up opportunities for pair trading and arbitrage.
- Flexible settings. You choose the analysis time, history depth, calculation formula, and appearance. The indicator can be adapted to any trading session and style.
- Objectivity. It takes emotion out of trading: you trade not on guesswork, but on cold, statistically proven data.
- Visual simplicity. All key information is displayed on a convenient information panel directly on the chart. There is no need to count anything manually.
- Improved intraday seasonality. Unlike many seasonality indicators that work on daily or weekly data, the ISI ProSpread SMA focuses on intraday movements, which is critical for day trading.
- The indicator does not repaint. The indicator operates on historical data and does not change its readings for already formed bars, which eliminates false signals and the the illusion of hindsight.
When trading spreads, you should consider: selecting correlated instruments (EURUSD/GBPUSD, XAUUSD/XAGUSD), setting lot coefficients to balance the spread. Use formula 0 to determine the direction of the spread, upward movement of the spread is possible with positive values, downward movement is possible with negative values of the spread.
Trading during volatility: Use formula 2 to identify hours of increased volatility, apply breakout strategies during high volatility hours, and increase stop losses according to the expected range of movement.
For beginners, the indicator provides a unique opportunity to trade based on statistical patterns rather than random predictions. For experienced traders, this is a tool for verifying trading ideas and identifying new opportunities.
Conclusion
ISI ProSpread SMA is more than just an indicator; it is your personal 24/7 statistical analyst. It turns market noise into understandable and verifiable numbers, giving the trader a real statistical advantage. It does not offer a 100% guarantee on every trade, but it builds trading on the principles of probability and mathematical expectation, which is one of the surest paths to stable earnings in financial markets. Each indicator formula offers a unique perspective on market dynamics. In the following articles, we will move on to writing an automated trading approach using trading EAs based on the presented indicators, using MetaTrader 5.
Remember that no indicator gives 100% accurate signals. The ISI ProSpread SMA indicator works best as part of a comprehensive trading system complemented by fundamental analysis.
Translated from Russian by MetaQuotes Ltd.
Original article: https://www.mql5.com/ru/articles/18821
Warning: All rights to these materials are reserved by MetaQuotes Ltd. Copying or reprinting of these materials in whole or in part is prohibited.
This article was written by a user of the site and reflects their personal views. MetaQuotes Ltd is not responsible for the accuracy of the information presented, nor for any consequences resulting from the use of the solutions, strategies or recommendations described.

 Neural network trading EA based on PatchTST
 MQL5 Trading Tools (Part 40): Adding SQLite Persistence and Per-Timeframe Visibility to the Canvas Drawing Layer
 Encoding Candlestick Patterns (Part 4): Frequency Analysis for Double-Candlestick Structures
 Measuring What Matters (Part 2): Building the Covariance Matrix: Eigenvalue Decomposition and Risk Factor Analysis in MQL5

- Free trading apps
- Over 8,000 signals for copying
- Economic news for exploring financial markets
You agree to website policy and terms of use
The table in the chart isn’t displaying properly – the columns aren’t aligned with the rows.