
Trend Criteria. Conclusion

Introduction
Trend is our friend. But we know little about this friend. If we ask ten traders what a trend is, we will probably get ten different answers. The only thing these answers might have in common is that a trend is a directional price movement. But as to what this direction should be, each trader will have their own ideas and options.
Of course, there are mathematically grounded trend criteria. But they may have certain disadvantages. For example, many criteria are adjusted to fit a normal distribution, while other criteria impose restrictions on the minimum length of the time series.
Let's try to develop our own trend assessments based on classical criteria. We will try to do it in such a way that the trend can say: "The trader is my friend."
Abbe criterion
This criterion is based on the comparison of two variances – the ordinary one and the Allan variance. In the presence of a trend, these two variances behave differently. For example, let's take a time series with values 3, 2, 1. To calculate the simple variance, we first need to find the mean of the series:
![]()
After this, we can proceed to calculating the variance:
![]()
To calculate the Allan variance, we only need the successive differences of the time series values:
![]()
Now let's extend the original time series, and its values will be: 5, 4, 3, 2, 1.
Let's calculate the variances:
![]()
![]()
![]()
We can continue extending the series, but the underlying idea remains the same. The presence of a trend does not affect the Allan variance in any way. The conventional variance depends on the trend duration.
To obtain the Abbe criterion, we need to find the quotient of these variances:
![]()
The lower the value obtained, the stronger the trend. Everything is fine with this criterion, but in market conditions it can give incorrect results due to squaring. If we apply this criterion to a sufficiently long time series, this drawback will not manifest itself. But if the time series is short, then even one abnormal price value can have a strong and unfavorable impact on the value of this criterion.
To get rid of this drawback, we can use robust methods. A separate article could be written about these methods. But I will write it right now. Instead of the average, we need to use the median, and instead of squaring — the absolute value of differences. A. Chekhov claimed that brevity is the sister of talent. So I suppose that makes me talented.
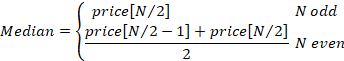
The algorithm will be as follows. First we need to take all the price values and sort them in ascending order. Then the median will be equal to the price in the center if the number of prices is odd or to the half-sum of two central values, if the number of prices is even.
After that, we need to calculate the absolute deviation from the median for each price:
![]()
and find the median of the resulting values. So we get the median of absolute deviations (MAD), which is a robust estimate of the standard deviation (there are some nuances here - a correction factor must be applied, but we do not need it here). Instead of the Allan variance, we will also calculate the deviation. To do this, we first need to find the absolute values of successive price differences:
![]()
And then, we should find the median of the resulting values. Essentially, this median will show the average price rate over 1 bar.
Now, let's think a little about what would be a sign of a trend for us. The larger the resulting standard deviation estimate, the higher the probability of a trend. And the greater the Allan deviation, the greater the trend speed. We have considered the theory, now let's try to apply these features in practice.
First we need to decide on the magnitude of the deviations. For example, we obtained a deviation score of 50 points. Is this a lot or a little? We can only answer this question if we can compare the current value with the previous ones. To do this, we need to collect statistics, in which we will store the deviation values and how many times they occurred in history. Based on these statistics we can calculate the cumulative distribution function (CDF). Based on this function, we can judge the strength of the deviations. Large deviations are less common and the value of their cumulative function is greater.
Deviations can tell us the strength of a trend, but they do not tell us anything about its direction. It is necessary to add some other criterion that can indicate this direction. I will use the Kendall criterion described in the previous article.
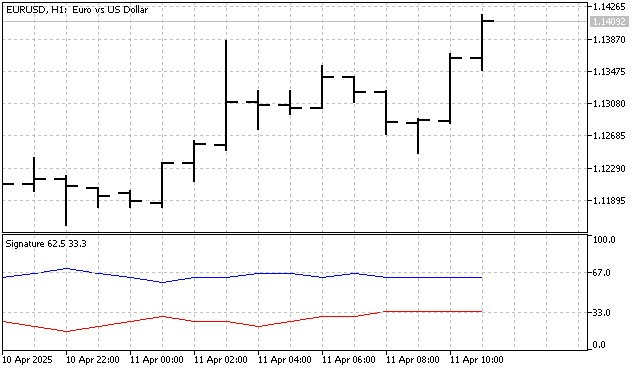
As a result, we have 3 different criteria that we need to combine into one indicator.
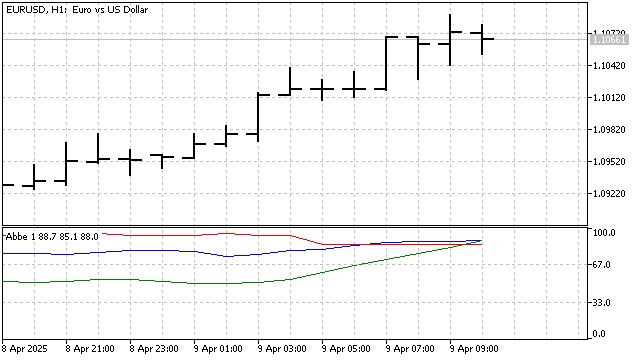
The presence of a trend can be judged by three signs: a large value of the standard deviation (blue), a large value of the price rate (red), a substantial deviation of the Kendall criterion from the 50 level (green).
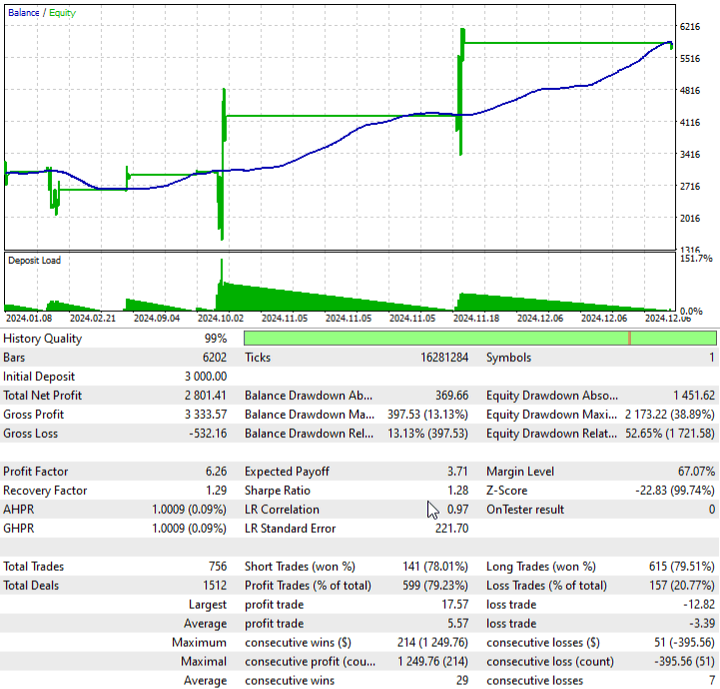
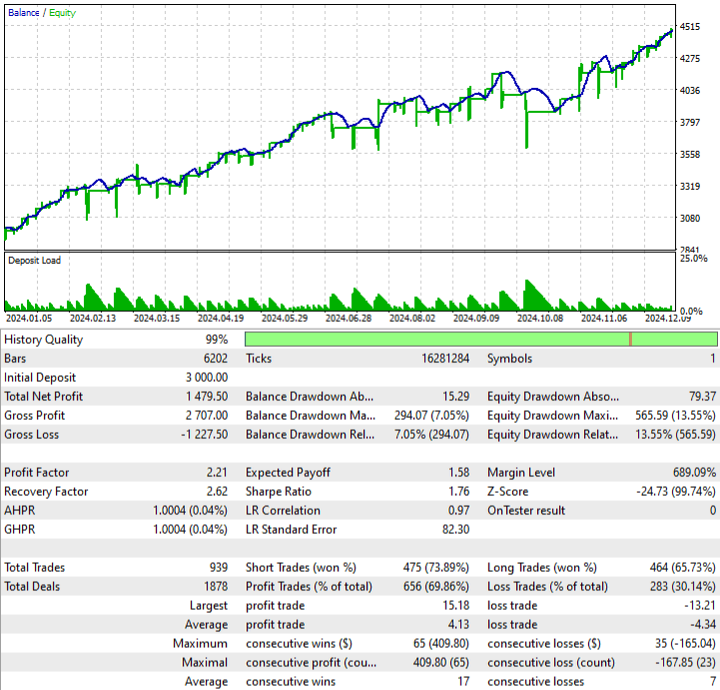
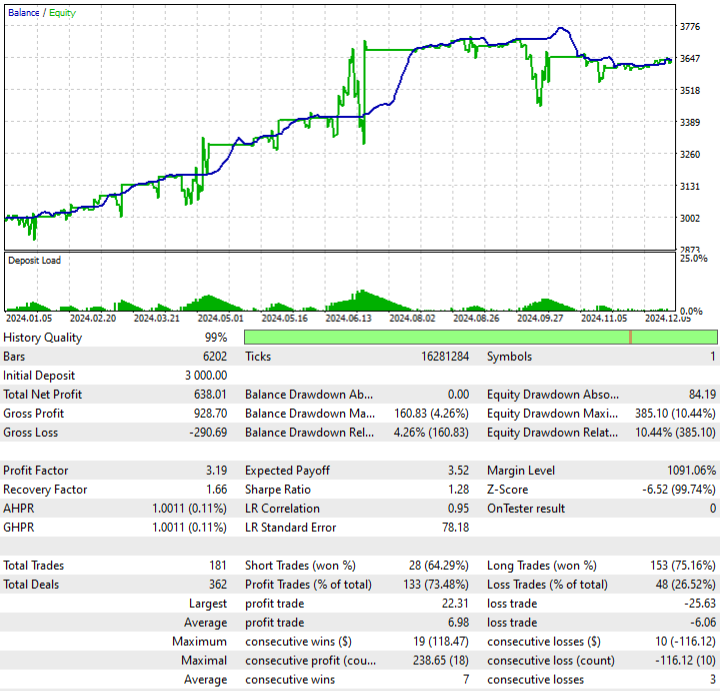
Let's look at an example of a simple trading strategy based on this indicator. Positions will be opened if the indicator confirms the presence of a trend. Positions will be closed when the Kendall criterion is close to 50. This strategy might produce the following results.
We have figured out how to handle spikes. But have we taken into account all possible options? Let's take a time series with values: 1, 0, 0, 0, -1. Which values in this series are anomalous? The ones on the edges or the ones in the center? To answer these questions, we will need additional information. But we can try to find the answer on our own. In order to exclude the influence of possible anomalies in price movement, we need to take into account the values of all members of the time series.
To combat anomalies, we need to slightly modify the original equation of the Abbe criterion. We will calculate the Allan deviation as follows:
![]()
The standard deviation equation will also change:
![]()
Then the value of the criterion can be found using the equation:
![]()
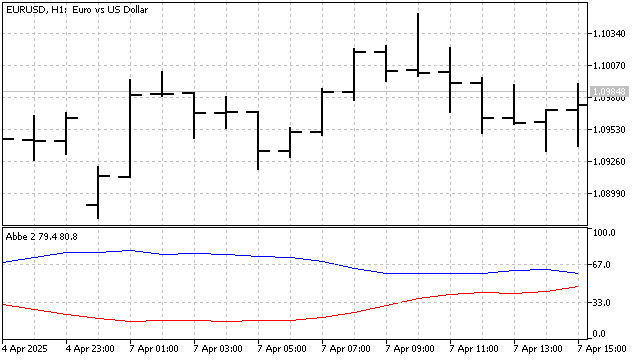
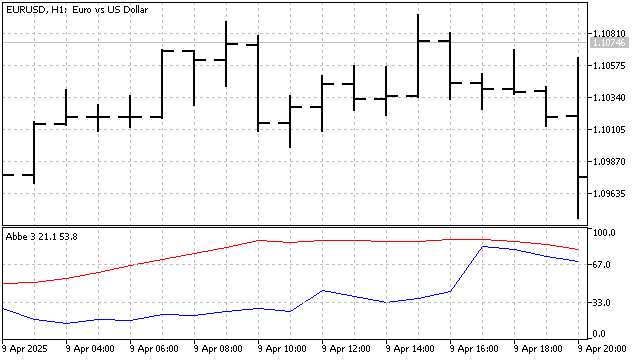
The higher the resulting value, the stronger the trend. Since we have abandoned raising the values to a power, the change in the criterion will be quite smooth. To make the changes in the criterion more noticeable, I normalize it relative to the historical minimum and maximum. To determine the direction of the trend, I will leave the Kendall criterion. This is what this indicator looks like:
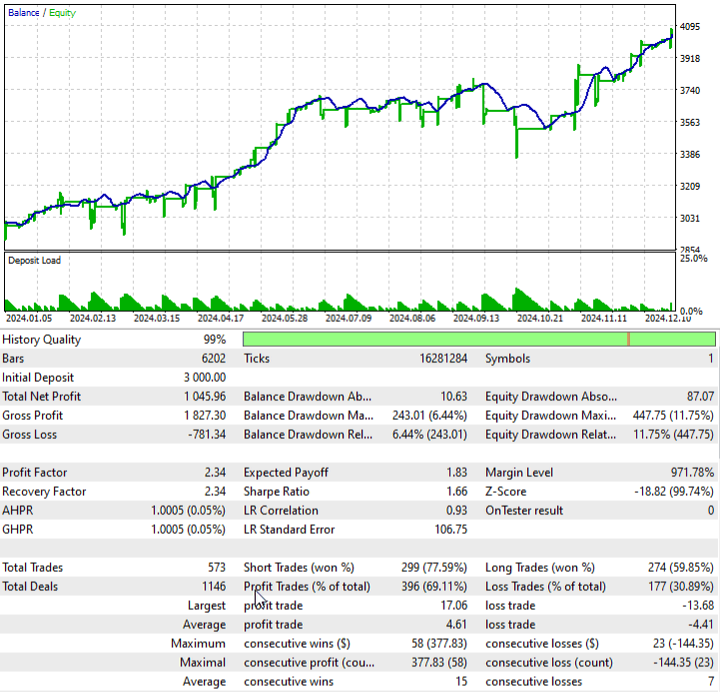
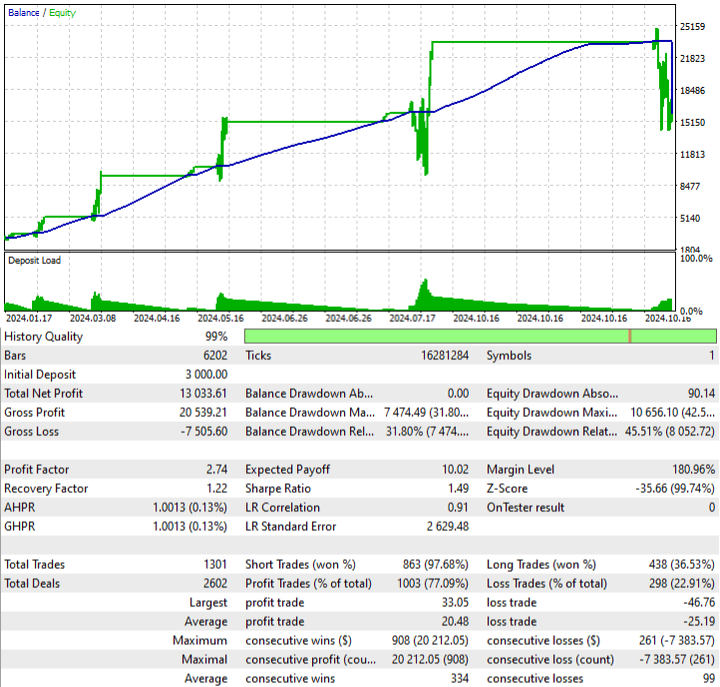
Based on this indicator, we create a strategy with the following rules:
- positions are opened only if the Abbe criterion does not increase and is above a certain level,
- Buy positions are opened if the Kendall criterion rises and is below the set level,
- Sell positions are opened if this criterion decreases and is above the set level.
When calculating the Allan deviation, we used the sum of absolute differences. This amount shows the total distance the price has traveled. Knowing this distance, we can estimate the strength of the linear trend. The new value can be calculated as follows:
![]()
The numerator calculates the distance between the initial and final values of the time series. And the denominator contains the total distance. The closer this indicator is to 1, the more noticeable the trend. Low values indicate a flat or chaotic price movement. But here we need to make a caveat: a small value may also go hand in hand with a sharp change in price.
Based on this indicator, I created a strategy with the following rules: positions are opened if the Kendall criterion signals a change in trend direction. Moreover, the value of the new criterion must deviate significantly enough from the average. In other words, the new criterion will be used as a filter that will determine the reason for the end of the trend.
So, discussing one classic trend criterion, we arrived at three modifications. We can stop here and turn our attention to other criteria.
Next criteria
The sign criterion is one of the simplest and most intuitive criteria. It is very simple to describe: if the current price is higher than the previous one, then the “+” sign appears. And if less, then "-". Once all the signs have been placed, conclusions can be drawn about the presence of a trend and its direction.
But this criterion has a significant drawback: it cannot be used to determine how strong a trend is. Imagine 5 prices in a row rising by 1 point. Looking at the chart, you will confidently say: the market is flat here. But the sign criterion will give a 4 "+" and confidently indicate an upward trend. Let's try to get rid of this drawback.
First, we need to enter some threshold value for price change. Then the rule for counting signs will change slightly.
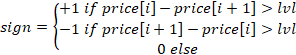
First, let's look at the indicator based on this criterion.
One sign being significantly higher than the other signals a trend. A simple strategy suggests itself here: open positions if the line of one sign crosses another.
The results do not look impressive. But this means only one thing: this strategy needs to be refined.
Kendall's criterion is also based on the number of signs. And it has the same drawback: it perceives a price increase of 1 point as a stable trend. I will change this criterion a little. The essence of the changes is quite simple. The indicator will collect statistics on price changes for 1, 2, or however many more bars are needed, depending on the indicator period. For example, let the indicator period be equal to 3. I will have 2 statistics. Comparison of price movement for 1 bar:
![]()
And price movement statistics for 2 bars:
![]()
Based on these statistics, I calculate the CDF, and the sum of all CDFs will indicate the strength and direction of the trend. The indicator turned out to be quite interesting, but it takes some time to load. Therefore, there will be no EA based on this indicator. If you liked the indicator, you can always create an order in Freelance with a request to transfer the indicator logic to the EA.
Next next criteria
Many non-parametric trend criteria use sorting of the original values. These criteria are good because they can identify linear and non-linear trends. The main drawback of these criteria is that they cannot distinguish the strength of a trend. A price movement of 1 point or 100 points looks the same to them. One possible solution is to combine parametric and non-parametric methods.
The first example of such a combination. Let's take the number of prices we need and sort them in ascending order. This is the non-parametric part of the criterion. After this, we compare the original time series and the sorted one. This is already a parametric part.
![]()
If the trend is downward, the original prices and sorted ones will remain in their places, and the sum value will be equal to 0. In case of an upward trend, the amount will be quite large. And the larger the amount, the stronger the upward trend. I wanted to call this criterion "The Criterion of a Good Moderator". But I almost got banned for this. So let it be called the sorting criterion.
Now let's see how this criterion can be applied in practice. First we need to collect statistics on the values of the amounts received. Based on these statistics, we construct CDF. And based on the CDF, we can judge the trend strength and direction. And of course, it is necessary to check whether this criterion can be used in practice.
Another combination of non-parametric and parametric methods can be constructed using SMA values. The essence of this criterion is quite simple. SMA values will increase during an uptrend and decrease during a downtrend. For example, the general indicator period is 3. Then I can build 3 different SMAs:
![]()
![]()
![]()
I will sort the obtained values in ascending order. The statistics will be similar to those in the previous example. But instead of comparing prices, I will compare the original SMA indices with the one obtained after sorting. Small differences indicate a downward trend. With an upward trend, the sum of absolute differences will be quite large.
The criterion appears to be quite efficient and can be useful in trading. Of course, this criterion can be modernized. For example, we can use indicators with the same period. Besides SMA, we can use other trend-following indicators.
Conclusion
Understanding trends helps traders predict price movements and use this forecast to make a profit. However, it is important to remember that trends are not always predictable, and even the most reliable analysis methods can fail. Therefore, traders need to constantly improve and adapt their strategies to changing market conditions. Modifying classical trend criteria or developing your own criteria can help with this.
EA testing was performed under the following parameters:
- EURUSD
- H1
- 2024.01.01 - 2024.12.31
The following programs were used when writing this article.
| Name | Type | Description |
|---|---|---|
| Abbe 1 | Indicator |
|
| EA Abbe 1 | Expert Advisor |
|
| Abbe 2 | Indicator | |
| EA Abbe 2 | Expert Advisor |
|
| Abbe 3 | Indicator | |
| EA Abbe 3 | Expert Advisor |
|
| Signature | Indicator |
|
| EA Signature | Expert Advisor | |
| Kendall | Indicator | |
| Sorting | Indicator | |
| EA Sorting | Expert Advisor | |
| Average | Indicator | |
| EA Average | Expert Advisor |
Translated from Russian by MetaQuotes Ltd.
Original article: https://www.mql5.com/ru/articles/17811
Warning: All rights to these materials are reserved by MetaQuotes Ltd. Copying or reprinting of these materials in whole or in part is prohibited.
This article was written by a user of the site and reflects their personal views. MetaQuotes Ltd is not responsible for the accuracy of the information presented, nor for any consequences resulting from the use of the solutions, strategies or recommendations described.

- Free trading apps
- Over 8,000 signals for copying
- Economic news for exploring financial markets
You agree to website policy and terms of use