

Encoding Candlestick Patterns (Part 4): Frequency Analysis for Double-Candlestick Structures
 1 498
1 498
 0
0

Introduction
In Part 3 of this series, we examined the frequency distribution of individual candlestick types after encoding each candle with an alphabetic symbol. The analysis measured how often each single candlestick structure occurred and its percentage contribution to the total number of observed bars. Using GBPUSD and gold (XAUUSD) across the H1, M15, and M5 timeframes as case studies, the Marubozu categories (A/a) appeared most frequently, followed by the spinning top categories (G/g). The results also showed a near-symmetrical distribution between bullish and bearish candle types across the selected timeframes. We also observed a remarkable near-symmetry between corresponding bullish and bearish pairs (A/a, G/g, H/h, E/e) exhibiting closely matched frequencies.
Although single-candlestick frequency analysis provides useful information about the dominant and least common candle structures in a market, price action is rarely interpreted from one candle in isolation. The meaning of a candle often depends on the candle that precedes it, the candle that follows it, and the sequence formed by their interaction. For example, a bullish Marubozu may have a different analytical interpretation when it follows another bullish Marubozu than when it follows a bearish spinning top.
These single-candlestick frequency investigations provided valuable insights into which individual patterns appear most often on the chart and which occur rarely. However, they left an equally important question unanswered: how do these encoded symbols combine into sequential patterns, and which multi-candlestick structures recur most frequently in price action? Therefore, extending the analysis from individual candles to ordered candle combinations provides a more structured way to investigate recurring price-action behavior.
This article bridges that gap by extending the frequency analysis pipeline to multi-candlestick type combinations. Specifically, we focus on double-candlestick structures. We develop a reproducible MQL5 script that transforms the encoded series into two-symbol sequences, counts occurrences, and ranks patterns by frequency. By sorting these double-candlestick type patterns in descending order, we can easily identify the top 3, 5, or n-patterns that repeat most frequently in price action series.
The study examines every consecutive pair of symbols in the encoded candlestick series. Each pair represents an ordered two-symbol pattern; hence, Aa is treated differently from aA, even though both contain the same two candle categories. This distinction is important because the order of candles carries information about the direction and transition of price action.
Objective
The primary objective of this article is to perform a statistical frequency analysis of double-candlestick patterns using the encoded market data methodology developed in Part 1. Building directly upon the single-candlestick frequency profiles established in Part 3, we extend the analytical pipeline to investigate how individual encoded symbols combine into two-symbol sequences and how these combinations are distributed across historical price series.
Using gold (XAUUSD) and GBPUSD as case studies across H1, M15, and M5 timeframes, we:
- Convert classified candlestick types into their assigned alphabetic symbols, producing an encoded price-action series.
- Extract consecutive two-symbol sequences from the encoded series.
- Count the frequency and percentage of occurrence for each unique double-candlestick structure.
- Sort the patterns in descending order based on their frequency or percentage occurrence.
The sorted output makes it possible to identify the most recurrent double-candlestick structures within a selected market, timeframe, and historical lookback period. Traders and researchers can use this information to explore which candle transitions occur most frequently, compare their distribution across assets and timeframes, and select candidate patterns for further statistical testing. However, a frequently occurring pattern should not automatically be considered a profitable trading signal. Its predictive value must be evaluated separately through forward-return analysis, probability testing, and strategy validation.
Double-Candlestick Patterns
For the double-candlestick analysis, we extracted every unique two-symbol pattern from the encoded market series, counted its frequency of occurrence, and sorted the patterns in descending order. A total of 1,500 candlesticks were analyzed. Since each observation consists of two consecutive candlesticks, the sliding-window procedure generated 1,499 overlapping double-candlestick patterns.
The study was conducted on gold (XAUUSD) and GBPUSD across three timeframes: 1 hour (H1), 15 minutes (M15), and 5 minutes (M5). This multi-timeframe approach allows us to assess whether the frequency characteristics of double-candlestick patterns remain consistent across different market resolutions or exhibit timeframe-dependent variations.
GBPUSD Double-Candlestick Patterns
GBPUSD M5
We first transformed the M5 candlesticks into encoded symbols. We then extracted consecutive double-candlestick combinations using a one-step sliding window, preserving the original order. Consequently, patterns such as Aa and aA were treated as distinct because the sequence of the symbols is an essential characteristic of the price action. Figure 1 illustrates the encoded market series. 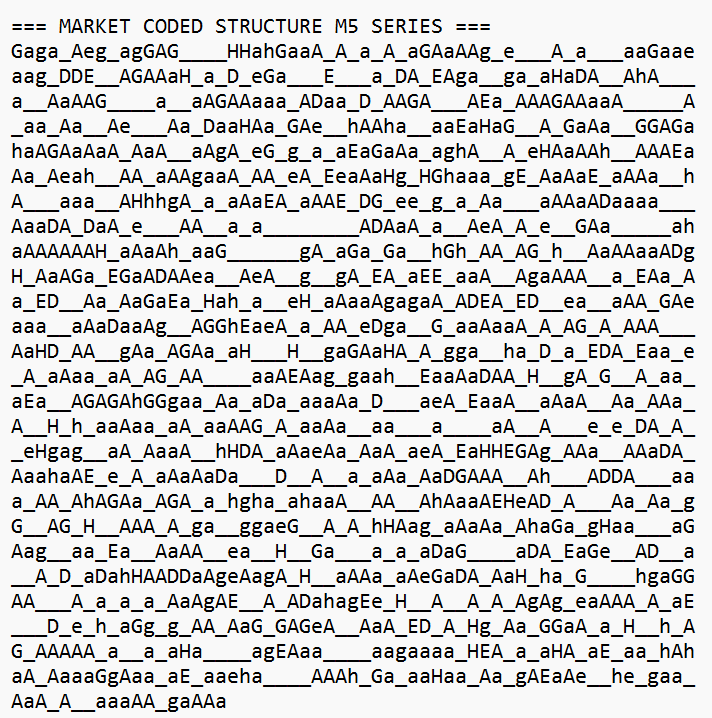
Figure 1: GBPUSD M5 Encoded Market Series
Following extraction, we identified 89 unique double-candlestick patterns within the M5 dataset at the time of study. These patterns were sorted in descending order by their frequency of occurrence. Table 1 presents the five most frequently occurring patterns.
Table 1: Top 5 Double-Candlestick Patterns (GBPUSD M5)
| Pattern | Count | Percentage |
|---|---|---|
| __ | 170 | 11.34% |
| _A | 111 | 7.40% |
| A_ | 109 | 7.27% |
| a_ | 108 | 7.20% |
| _a | 98 | 6.54% |
A striking observation emerges from Table 1: all five of the most frequent double-candlestick patterns contain at least one unclassified (_) symbol. The combination of two consecutive unclassified candles (__) leads with 170 occurrences, representing 11.34% of all two-symbol pairs. The remaining four patterns each contain a single unclassified symbol paired with either a bullish Marubozu (A) or a bearish Marubozu (a), with the unclassified symbol appearing either before or after the classified candle. The percentage contribution for these four patterns ranges from 6.54% to 7.40% of the total.
The dominance of patterns containing the unclassified symbol (_) indicates that many consecutive candlestick pairs include at least one candle that does not satisfy the predefined classification criteria. While these patterns accurately describe the encoded series, they provide limited insight into interactions between fully classified candlestick structures. Therefore, to better understand recurring price-action behavior, we exclude all patterns containing the unclassified symbol and examine only fully classified double-candlestick patterns. Table 2 presents the most frequent fully classified double-candlestick patterns.
Table 2: Top 6 Fully Classified Double-Candlestick Patterns (GBPUSD M5)
| Pattern | Count | Percentage |
|---|---|---|
| Aa | 83 | 5.54% |
| aA | 80 | 5.34% |
| aa | 67 | 4.47% |
| AA | 61 | 4.07% |
| GA | 22 | 1.47% |
| AG | 22 | 1.47% |
Among the fully classified patterns, combinations involving A and a dominate the distribution. The alternating patterns Aa and aA rank first and second, accounting for 5.54% and 5.34% of all two-symbol combinations, respectively. The repeated patterns aa and AA follow with 4.47% and 4.07%, indicating that both alternating and repeated Marubozu-type structures occur frequently in the market sequence.
The patterns GA (bullish spinning top followed by bullish Marubozu) and AG (bullish Marubozu followed by bullish spinning top) each contribute 1.47% of the total observations, making them considerably less common than the leading four patterns. All remaining unique two-symbol combinations individually account for less than 1.4% of the extracted market sequence.
Overall, the results suggest that price action on the GBPUSD M5 timeframe is dominated by combinations involving the A and a candlestick categories, which is consistent with the single-candlestick frequency analysis presented in Part 3, where these candle types were also the most prevalent. This demonstrates how the frequency characteristics of individual candlesticks naturally extend to the distribution of consecutive double-candlestick structures.
GBPUSD M15Applying the same methodology to the M15 dataset, candlestick patterns were converted into encoded symbols, and two-symbol pairs were extracted by sliding through the sequence. Figure 2 illustrates the resulting encoded market series for the M15 timeframe.
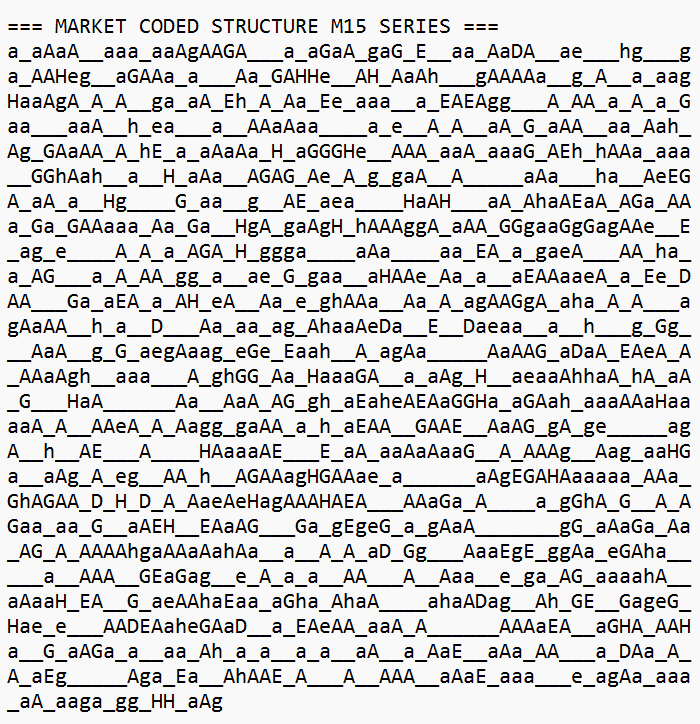
Figure 2: GBPUSD M15 Encoded Market Series
From this series, we identified 83 unique double-candlestick patterns. These patterns were sorted in descending order by frequency of occurrence. Table 3 presents the top five most frequent combinations, which again all contain at least one unclassified (_) symbol.
Table 3: Top 5 Double-Candlestick Patterns (GBPUSD M15)
| Pattern | Count | Percentage |
|---|---|---|
| __ | 205 | 13.68% |
| _a | 116 | 7.74% |
| a_ | 113 | 7.54% |
| _A | 106 | 7.07% |
| A_ | 104 | 6.94% |
The results closely resemble those obtained from the M5 timeframe. The pattern __ remains the most dominant, occurring 205 times and accounting for 13.68% of all extracted two-symbol combinations. The remaining four patterns each contain one unclassified candlestick (_) paired with either A or a, contributing between 6.94% and 7.74% of the total observations.
Since these patterns contain at least one candle outside the predefined classification scheme, they offer limited insight into the relationships between classified candlestick structures. Consequently, the analysis is extended to fully classified double-candlestick patterns. Table 4 presents the six most frequently occurring fully classified double-candlestick patterns.
Table 4: Top 6 Fully Classified Double-Candlestick Patterns (GBPUSD M15)
| Pattern | Count | Percentage |
|---|---|---|
| Aa | 70 | 4.67% |
| aA | 64 | 4.27% |
| aa | 64 | 4.27% |
| AA | 61 | 4.07% |
| ag | 18 | 1.20% |
| gA | 17 | 1.13% |
Similar to the M5 timeframe, the fully classified distribution is dominated by combinations involving A and a. The alternating pattern Aa ranks first with 70 occurrences (4.67%), followed by aA and aa, each contributing 4.27% of the extracted pairs. The repeated bullish pattern AA appears 61 times (4.07%), confirming that both alternating and repeated Marubozu-type structures remain the most common classified transitions on the M15 timeframe.
The patterns ag (bearish Marubozu followed by bearish spinning top) and gA (bearish spinning top followed by bullish Marubozu) each contribute just over 1% of the observations, indicating that transitions involving the g candlestick category occur much less frequently. All remaining fully classified two-symbol combinations individually account for less than 1.1% of the extracted market sequence.
GBPUSD H1Extending the analysis to the hourly (H1) timeframe, the same encoding and extraction procedures were applied. Figure 3 presents the encoded market series for the H1 dataset.
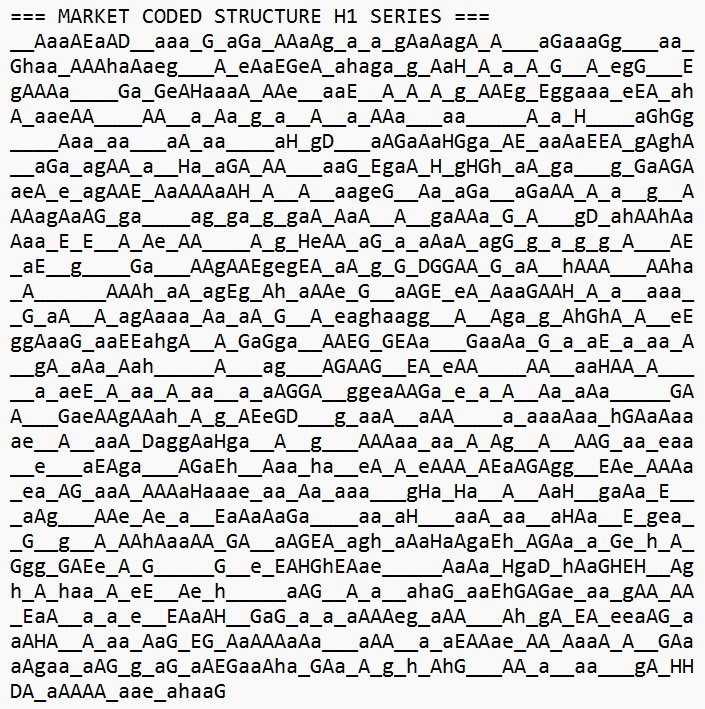
Figure 3: GBPUSD H1 Encoded Market Series
From this series, we identified 85 unique double-candlestick patterns. The patterns were sorted by descending frequency, and Table 5 displays the top five combinations— again all containing at least one unclassified symbol.
Table 5: Top 5 Double-Candlestick Patterns (GBPUSD H1)
| Pattern | Count | Percentage |
|---|---|---|
| __ | 194 | 12.94% |
| _a | 115 | 7.67% |
| A_ | 111 | 7.40% |
| _A | 106 | 7.07% |
| a_ | 99 | 6.60% |
The frequency distribution follows the same general pattern observed on the M5 and M15 timeframes. The pattern __ remains the most common, appearing 194 times and representing 12.94% of all extracted pairs. The remaining four dominant patterns each contain one unclassified candlestick combined with either A or a, contributing between 6.60% and 7.67% of the total observations.
The consistency of these results across all three timeframes indicates that unclassified candlesticks frequently occur adjacent to the dominant A and a categories. To focus exclusively on classified candlestick interactions, the analysis continues with fully classified double-candlestick patterns. Table 6 presents the six most frequently occurring fully classified double-candlestick patterns.
Table 6: Top 6 Fully Classified Double-Candlestick Patterns (GBPUSD H1)
| Pattern | Count | Percentage |
|---|---|---|
| aa | 68 | 4.54% |
| aA | 68 | 4.54% |
| AA | 68 | 4.54% |
| Aa | 65 | 4.34% |
| aG | 20 | 1.33% |
| Ga | 18 | 1.20% |
At the H1 timeframe, the Marubozu-based patterns again dominate the fully classified category. Interesting, three patterns: aa , aA , and AA each occur exactly 68 times representing 4.54% of all extracted pairs, while Aa follows closely with 65 occurrences (4.34%). The patterns aG and Ga appear considerably less often, contributing 1.33% and 1.20%, respectively. Every remaining fully classified two-symbol pattern individually contributes less than 1.2% of the extracted market sequence.
Overall, the H1 results reinforce the observations made on the lower timeframes. Across M5, M15, and H1, the A and a candlestick categories consistently dominate the distribution of classified double-candlestick structures. The primary difference lies in the ordering of the most frequent patterns.
Gold (XAUUSD) Double-Candlestick Patterns
Applying the identical methodology to gold (XAUUSD), we transformed candlestick data into encoded symbols across the M5, M15, and H1 timeframes, extracted two-symbol pairs, and ranked them by frequency. The following sections present the results for each timeframe.
XAUUSD M5
Figure 4 presents the encoded market series for gold at the M5 timeframe.
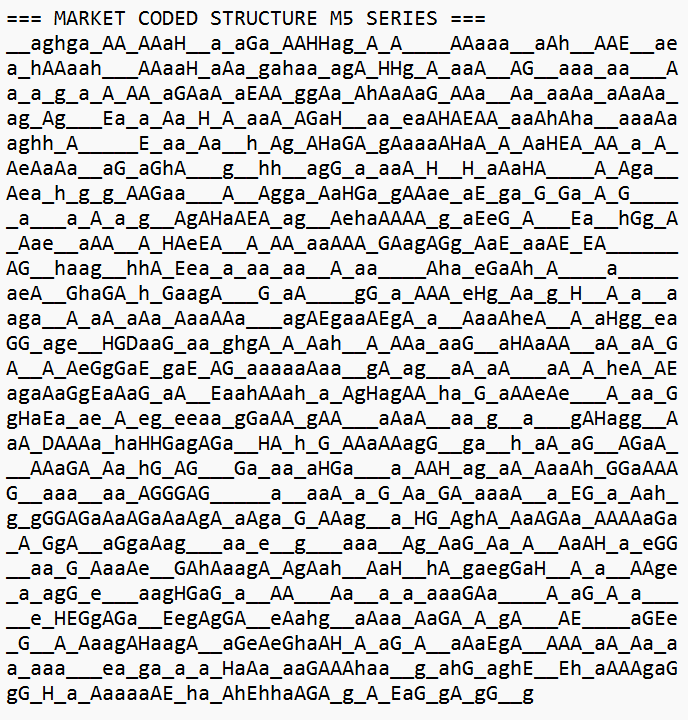
Figure 4: XAUUSD M5 Encoded Market Series
After processing the encoded sequence, 79 unique double-candlestick patterns were identified and sorted in descending order based on their frequency of occurrence. Table 7 presents the five most frequently occurring patterns.
Table 7: Top 5 Double-Candlestick Patterns (XAUUSD M5)
| Pattern | Count | Percentage |
|---|---|---|
| __ | 164 | 10.94% |
| _a | 120 | 8.01% |
| _A | 112 | 7.47% |
| a_ | 107 | 7.14% |
| A_ | 107 | 7.14% |
Consistent with the observations for GBPUSD, the five most frequent patterns all contain at least one unclassified candlestick (_). The pattern __ is the most dominant, appearing 164 times and accounting for 10.94% of all extracted two-symbol combinations. The remaining four patterns each pair the unclassified symbol with either A or a, contributing between 7.14% and 8.01% of the total observations.
The predominance of patterns containing the unclassified symbol indicates that a substantial proportion of consecutive candlestick pairs include at least one candle that falls outside the predefined classification scheme. To investigate the interaction between fully classified candlestick structures, these patterns are excluded from further analysis. Table 8 presents the six most frequent fully classified double-candlestick patterns.
Table 8: Top 6 Fully Classified Double-Candlestick Patterns (XAUUSD M5)
| Pattern | Count | Percentage |
|---|---|---|
| Aa | 74 | 4.94% |
| aa | 72 | 4.80% |
| aA | 69 | 4.60% |
| AA | 51 | 3.40% |
| ag | 28 | 1.87% |
| aG | 27 | 1.80% |
The fully classified patterns are again dominated by combinations involving A and a. The alternating pattern Aa ranks first with 74 occurrences (4.94%), closely followed by the repeated bearish pattern aa and the alternating pattern aA. The repeated bullish pattern AA contributes 3.40% of the extracted pairs.
Compared with GBPUSD, transitions involving the g candlestick category occur slightly more frequently on the XAUUSD M5 timeframe, with ag and aG contributing 1.87% and 1.80%, respectively. Nevertheless, all remaining fully classified double-candlestick patterns individually account for less than 1.8% of the total observations.
XAUUSD M15
Figure 5 presents the encoded market series for gold at the M15 timeframe.
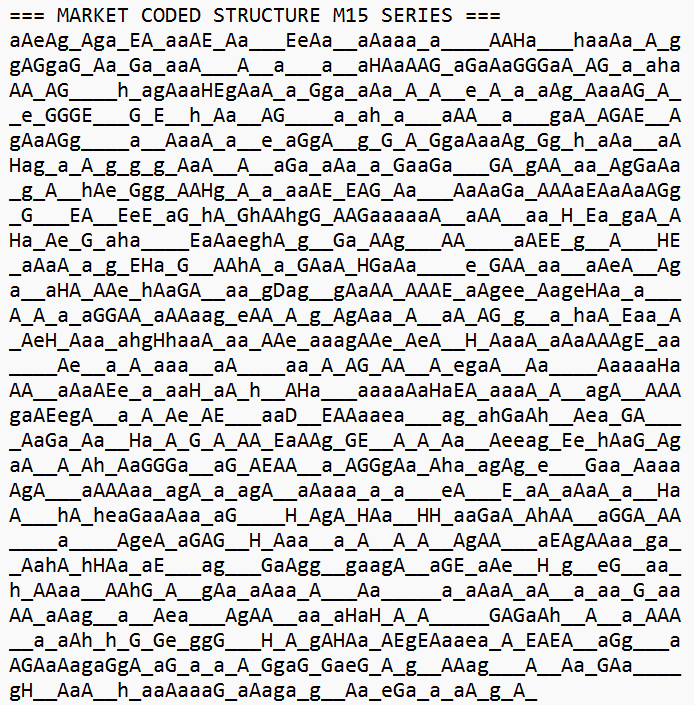
Figure 5: XAUUSD M15 Encoded Market Series
From this series, we identified 78 unique double-candlestick patterns. Table 9 presents the top five combinations, all containing at least one unclassified symbol.
Table 9: Top 5 Double-Candlestick Patterns (XAUUSD M15)| Pattern | Count | Percentage |
|---|---|---|
| __ | 187 | 12.47% |
| _a | 119 | 7.94% |
| _A | 116 | 7.74% |
| A_ | 114 | 7.61% |
| a_ | 109 | 7.27% |
The frequency distribution is remarkably similar to that observed on the M5 timeframe. The pattern __ remains the most common, appearing 187 times and accounting for 12.47% of all extracted pairs. The remaining four dominant patterns each contain one unclassified candlestick paired with either A or a, contributing between 7.27% and 7.94% of the total observations.
As with the previous analyses, these dominant patterns provide limited information about interactions between classified candlestick structures. Therefore, only fully classified double-candlestick patterns are considered in the subsequent analysis. Table 10 presents the six most frequent fully classified double-candlestick patterns.
Table 10: Top 6 Fully Classified Double-Candlestick Patterns (XAUUSD M15)
| Pattern | Count | Percentage |
|---|---|---|
| aA | 84 | 5.60% |
| Aa | 76 | 5.07% |
| aa | 65 | 4.34% |
| AA | 47 | 3.14% |
| aG | 25 | 1.67% |
| gA | 24 | 1.60% |
The alternating pattern aA is the most frequently occurring classified structure, contributing 5.60% of all extracted pairs. It is followed by Aa (5.07%), while the repeated patterns aa and AA contribute 4.34% and 3.14%, respectively.
The patterns aG and gA each account for approximately 1.6% of the observations, indicating that transitions involving the G/g candlestick categories remain relatively uncommon. Every remaining fully classified double-candlestick pattern individually contributes less than 1.6% of the extracted market sequence.
XAUUSD H1
Figure 6 illustrates the encoded market series for the H1 timeframe.
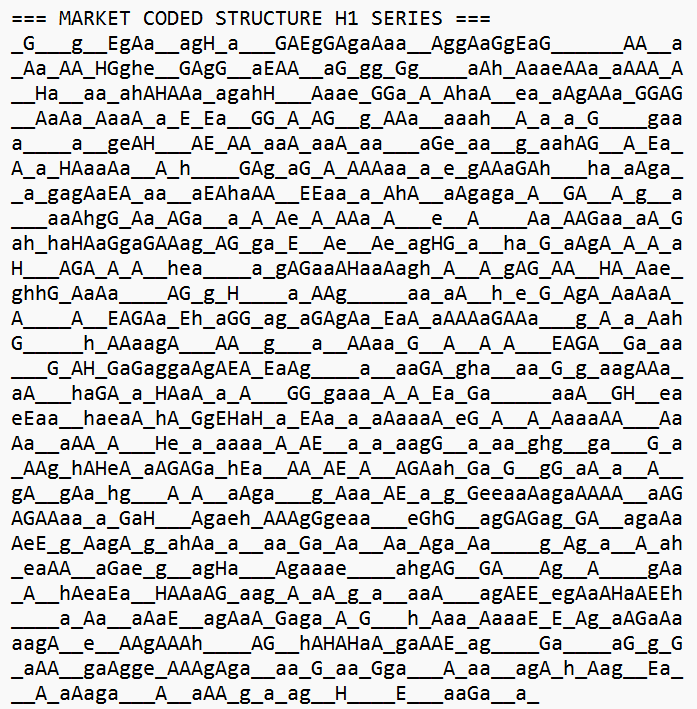
Figure 6: XAUUSD H1 Encoded Market Series
We identified 73 unique double-candlestick patterns from this series. Table 11 displays the top five combinations, all containing unclassified symbols.
Table 11: Top 5 Double-Candlestick Patterns (XAUUSD H1)
| Pattern | Count | Percentage |
|---|---|---|
| __ | 216 | 14.41% |
| a_ | 118 | 7.87% |
| _a | 109 | 7.27% |
| _A | 109 | 7.27% |
| A_ | 98 | 6.54% |
The overall distribution closely resembles that of the lower timeframes. The pattern __ remains the most dominant, occurring 216 times and representing 14.41% of all extracted two-symbol combinations, the highest proportion observed among the gold timeframes. The remaining four patterns each contain one unclassified candlestick paired with either A or a, contributing between 6.54% and 7.87% of the observations. Turning to fully classified patterns, Table 12 presents the top six.
Table 12: Top 6 Fully Classified Double-Candlestick Patterns (XAUUSD H1)
| Pattern | Count | Percentage |
|---|---|---|
| Aa | 65 | 4.34% |
| aa | 60 | 4.00% |
| aA | 59 | 3.94% |
| AA | 46 | 3.07% |
| ag | 28 | 1.87% |
| Ag | 26 | 1.73% |
The patterns ag and Ag occur much less frequently, contributing 1.87% and 1.73%, respectively, while all remaining classified double-candlestick structures individually account for less than 1.7% of the observations.
Overall, the H1 analysis reinforces the findings obtained from the M5 and M15 timeframes. Across all three gold timeframes, combinations involving the A and a candlestick categories consistently dominate the classified double-candlestick distribution.
Cross-Instrument Comparison: GBPUSD vs. GoldComparing the double-candlestick frequency profiles across instruments reveals both similarities and differences (Table 13):
Table 13: Comparison between GBPUSD vs. Gold
| Metric | GBPUSD (range across TFs) | Gold (range across TFs) |
|---|---|---|
| __ frequency | 11.34% – 13.68% | 10.94% – 14.41% |
| Top mixed (_) + (A or a ) | 6.5% – 7.7% | 6.5% – 8.0% |
| Top A or a pair frequency | 4.07% – 5.54% | 3.07% – 5.60% |
| Top G or g pair frequency | 1.13% – 1.47% | 1.60% – 1.87% |
| Number of unique patterns | 83 – 89 | 73 – 79 |
- Both instruments exhibit the same hierarchical structure: __ is the most frequent, followed by mixed underscore(_) + Marubozu (A/a) patterns, then Marubozu pairs, and finally patterns involving other classified types.
- Gold tends to have a higher frequency of __ at H1 (14.41%) compared to GBPUSD (12.94%), while GBPUSD has a higher frequency at M5 (11.34% vs. 10.94%). This suggests that unclassified candle clustering is more timeframe-sensitive for gold.
- Spinning top (G/g) combinations appear slightly more frequently in gold than in GBPUSD, indicating that these less extreme patterns play a larger role in gold's price action.
- Gold exhibits fewer unique patterns overall, implying less diversity in its two-symbol combinations, possibly due to stronger trend persistence or more repetitive price structures.
Code Structure
This section explains the structure of the script and how it generates the output results.
The PatternData structure is a simple container used to store a candlestick pattern and its corresponding frequency of occurrence. The pattern member stores the extracted candlestick sequence, while count records the number of times that pattern appears in the encoded market series.
//+------------------------------------------------------------------+
//| Pattern data structure                                           |
//+------------------------------------------------------------------+
struct PatternData
  {
   string            pattern;
   int               count;
  };
The CandleType() function, which converts each candlestick into its corresponding encoded symbol, was explained in Part 3 and is therefore not discussed further in this article.
The CountPatterns() function is responsible for extracting and counting all unique candlestick patterns of a specified length from the encoded market series. The function accepts three parameters: the encoded market series (series), the desired pattern length (plen), and an output array (patterns) that stores the extracted patterns and their frequencies. The procedure begins by determining the length of the encoded series. If the series is shorter than the requested pattern length, the function terminates because no valid pattern can be extracted. It then clears any previous results and calculates the total number of sliding windows.
For each sliding window, the function extracts a substring of length plen and searches the output array to determine whether the pattern has already been encountered. If the pattern exists, its frequency count is incremented. Otherwise, a new PatternData entry is created with an initial count of one. This process continues until every possible sliding window in the encoded series has been examined.
//+------------------------------------------------------------------+
//| Count all patterns of the specified length                       |
//+------------------------------------------------------------------+
void CountPatterns(string series, int plen, PatternData &patterns[])
  {
   int len = StringLen(series);
   if(len < plen)
      return;
   ArrayResize(patterns, 0); // Clears previous results.
   int totalSlides = len - plen + 1;

   for(int i = 0; i < totalSlides; i++)
     {
      string pat = StringSubstr(series, i, plen);
      //--- Search for existing pattern
      int arrSize = ArraySize(patterns);
      int found   = -1;
      for(int j = 0; j < arrSize; j++)
        {
         if(patterns[j].pattern == pat)
           {
            found = j;
            break;
           }
        }
      //--- Increment or add new
      if(found >= 0)
        {
         patterns[found].count++;
        }
      else
        {
         ArrayResize(patterns, arrSize + 1);
         patterns[arrSize].pattern = pat;
         patterns[arrSize].count   = 1;
        }
     }
  }
After all patterns have been counted, the SortPatternsByCount() function arranges them in descending order according to their frequency. The function receives the array of extracted patterns and applies the Bubble Sort algorithm to order the entries by their occurrence count in descending order. During each pass, adjacent elements are compared, and whenever a pattern with a lower count precedes one with a higher count, the two entries are swapped. The sorting process continues until the most frequently occurring patterns appear at the beginning of the array, making it straightforward to identify the dominant candlestick patterns in the dataset.
//+------------------------------------------------------------------+
//| Sort patterns by count descending (bubble sort)                  |
//+------------------------------------------------------------------+
void SortPatternsByCount(PatternData &patterns[])
  {
   int n = ArraySize(patterns);
   for(int i = 0; i < n - 1; i++)
     {
      for(int j = 0; j < n - i - 1; j++)
        {
         if(patterns[j].count < patterns[j + 1].count)
           {
            PatternData temp = patterns[j];
            patterns[j]      = patterns[j + 1];
            patterns[j + 1]  = temp;
           }
        }
     }
  }
The SaveMarketStructureToFile() function generates a text report with the encoded series and its pattern-frequency analysis. The function accepts four parameters: the encoded market series, the number of candles analyzed, the pattern length, and an optional output file name. If no filename is supplied, the function automatically generates one using the trading symbol, chart timeframe, and pattern length. The function then creates and opens the text file for writing. If the file cannot be created, an error message displaying the corresponding error code is shown, and the function terminates.
//+------------------------------------------------------------------+
//| Write series + single pattern frequency to TXT file              |
//+------------------------------------------------------------------+
void SaveMarketStructureToFile(string series, int nlookback, int plen, string filename = "")
  {
   if(StringLen(filename) == 0)
      filename = _Symbol + "_" + TimeFrameToString(Period()) + "_" + IntegerToString(plen) + "-Pattern" + ".txt";
   int handle = FileOpen(filename, FILE_TXT | FILE_WRITE);

   if(handle == INVALID_HANDLE)
     {
      int err = GetLastError();
      MessageBox("Failed to create file.\nError: " + IntegerToString(err), "File Error");
      return;
     }
//--- Write header and raw series
   FileWriteString(handle, "=== MARKET CODED STRUCTURE " + TimeFrameToString(Period()) + " SERIES ===\r\n");
   FileWriteString(handle, series);
   FileWriteString(handle, "\r\n\r\n");

//--- Analyze single pattern length
   PatternData patterns[];
   CountPatterns(series, plen, patterns);
   SortPatternsByCount(patterns);

   int totalPatterns = StringLen(series) - plen + 1;
   int uniqueCount   = ArraySize(patterns);

   FileWriteString(handle, "=== PATTERN FREQUENCY ANALYSIS ===\r\n");
   FileWriteString(handle, "Window: " + IntegerToString(nlookback) + " candles\r\n");
   FileWriteString(handle, "Pattern Length: " + IntegerToString(plen) + " candles\r\n");
   FileWriteString(handle, "Total Sliding Windows: " + IntegerToString(totalPatterns) + "\r\n");
   FileWriteString(handle, "Unique Patterns Found: " + IntegerToString(uniqueCount) + "\r\n");
   FileWriteString(handle, "----------------------------------------------------------------\r\n");
   FileWriteString(handle, "Rank | Pattern | Count | Percentage\r\n");
   FileWriteString(handle, "-----|---------|-------|------------\r\n");

   for(int i = 0; i < uniqueCount; i++)
     {
      double pct = (totalPatterns > 0) ? (patterns[i].count * 100.0 / totalPatterns) : 0.0;
      string report = StringFormat(" %2d  |   %s   |  %3d  |   %6.2f%%\r\n", i + 1, patterns[i].pattern, patterns[i].count, pct);
      FileWriteString(handle, report);
     }

   FileWriteString(handle, "----------------------------------------------------------------\r\n");
   FileClose(handle);
   MessageBox(StringFormat("Results saved to file:\n%s", filename), "Success");
  }
After successfully opening the file, the function writes the report header followed by the complete encoded market series. It then calls the CountPatterns() function to extract and count all unique patterns and invokes SortPatternsByCount() to arrange the results in descending order according to their frequency.
Next, the function computes the total number of sliding windows and the number of unique patterns. It writes these statistics and a table with rank, pattern, count, and percentage.
Finally, the function writes the remaining rows of the report, closes the text file to ensure all data are saved correctly, and displays a confirmation message indicating that the analysis has been successfully exported.
Code Workflow
The overall workflow of the pattern extraction and frequency analysis process is summarized in Figure 7.
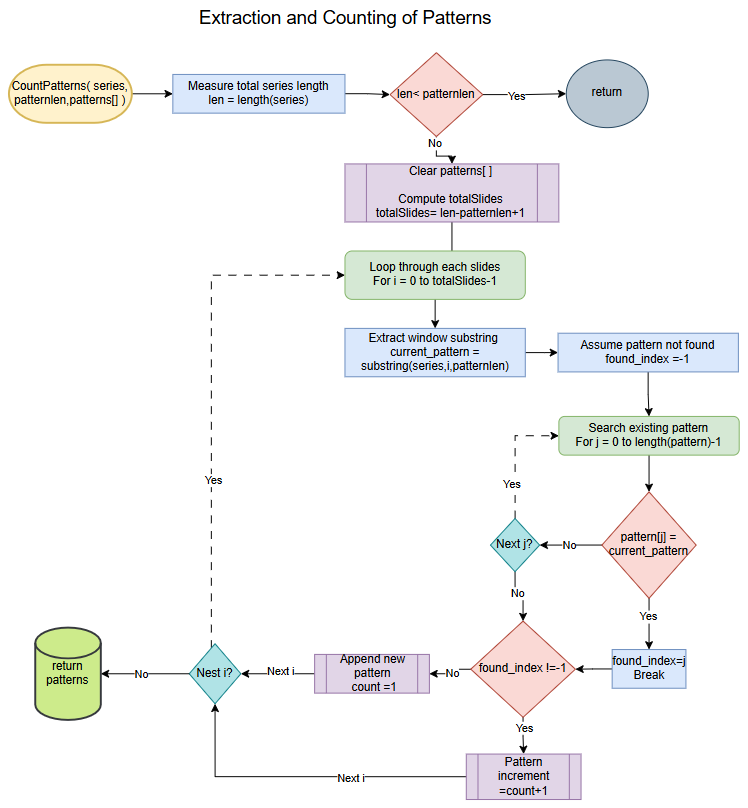
Figure 7: Extraction and Counting of Patterns
Demonstrating How the Code Works
This section demonstrates how the developed script is used to generate frequency statistics from price charts and where the output report can be found. Although this article focuses on the analysis of two-symbol candlestick patterns using 1,500 historical candlesticks, the script was designed to be flexible. It can analyze any financial instrument, process larger historical datasets, and extract patterns of varying lengths beyond the scope of this study.
To illustrate its flexibility, the script was applied to four different market scenarios:- GBPJPY (H1): double-candlestick pattern analysis using 2,500 candlesticks.
- EURAUD (H4): triple-candlestick pattern analysis using 5,000 candlesticks.
- US30Cash (M30): quadruple-candlestick pattern analysis using 7,000 candlesticks.
- BrentCash (H1): quintuple-candlestick pattern analysis using 10,000 candlesticks.
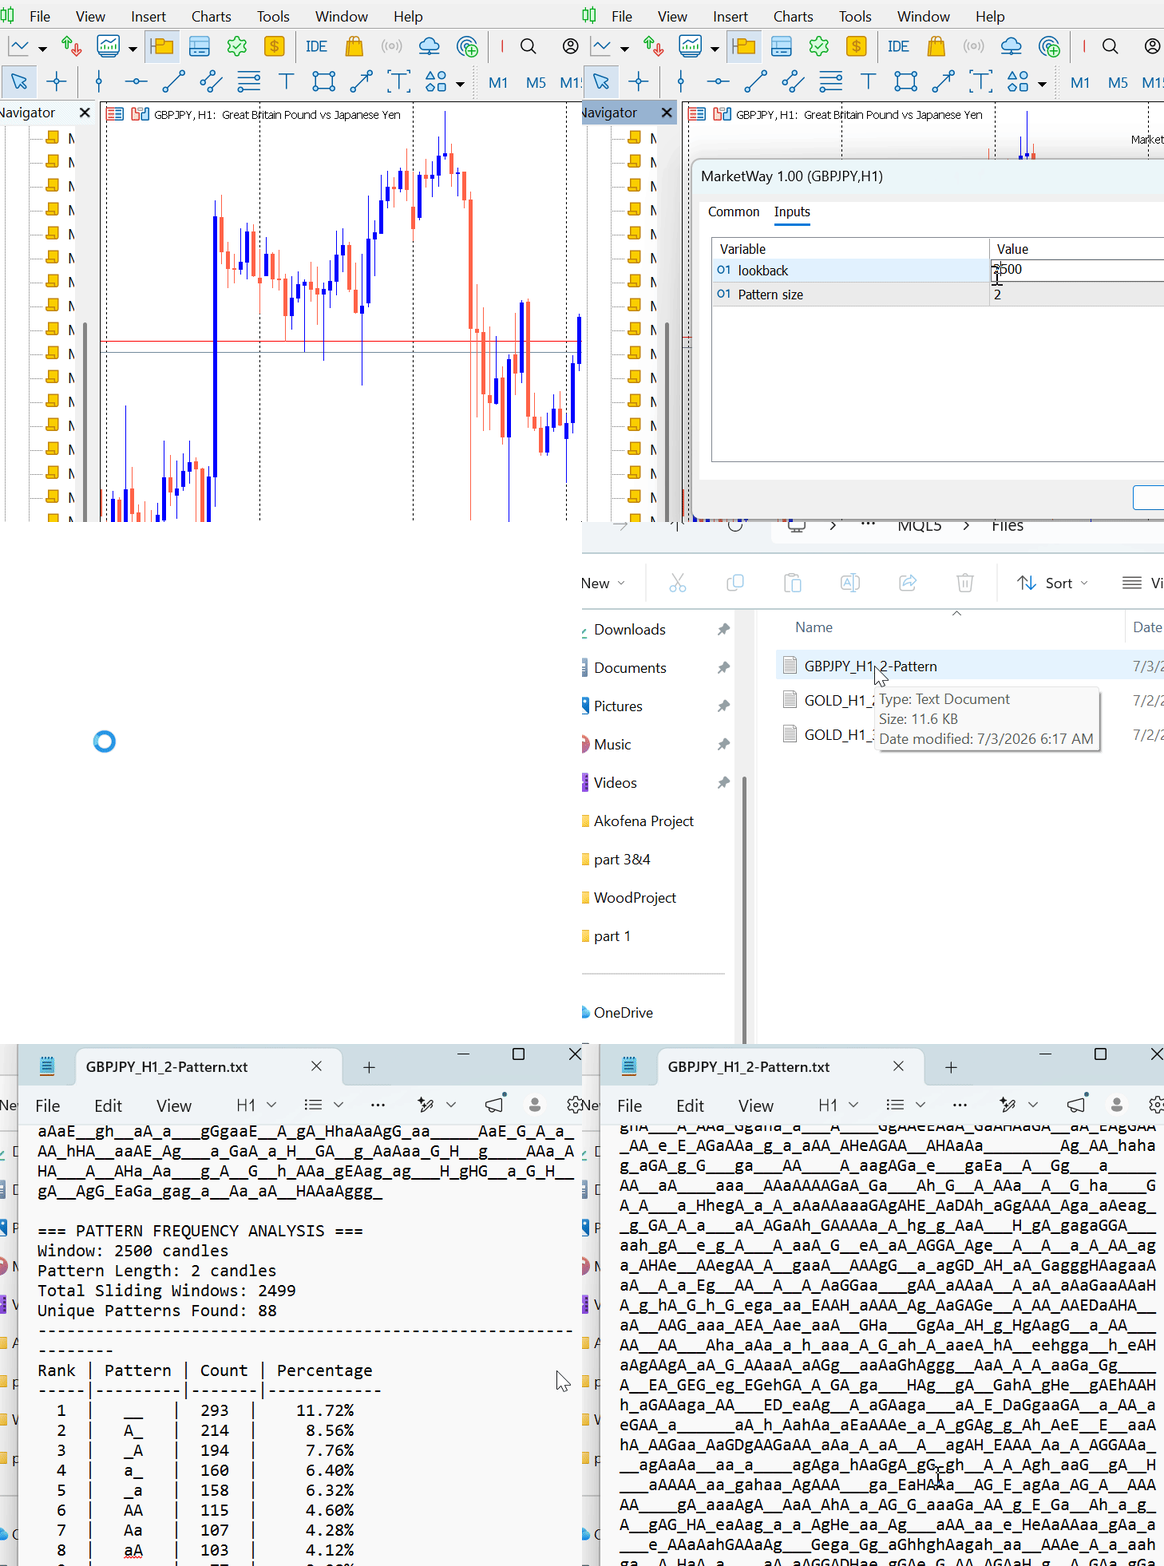
Figure 8: GBPJPY (H1)
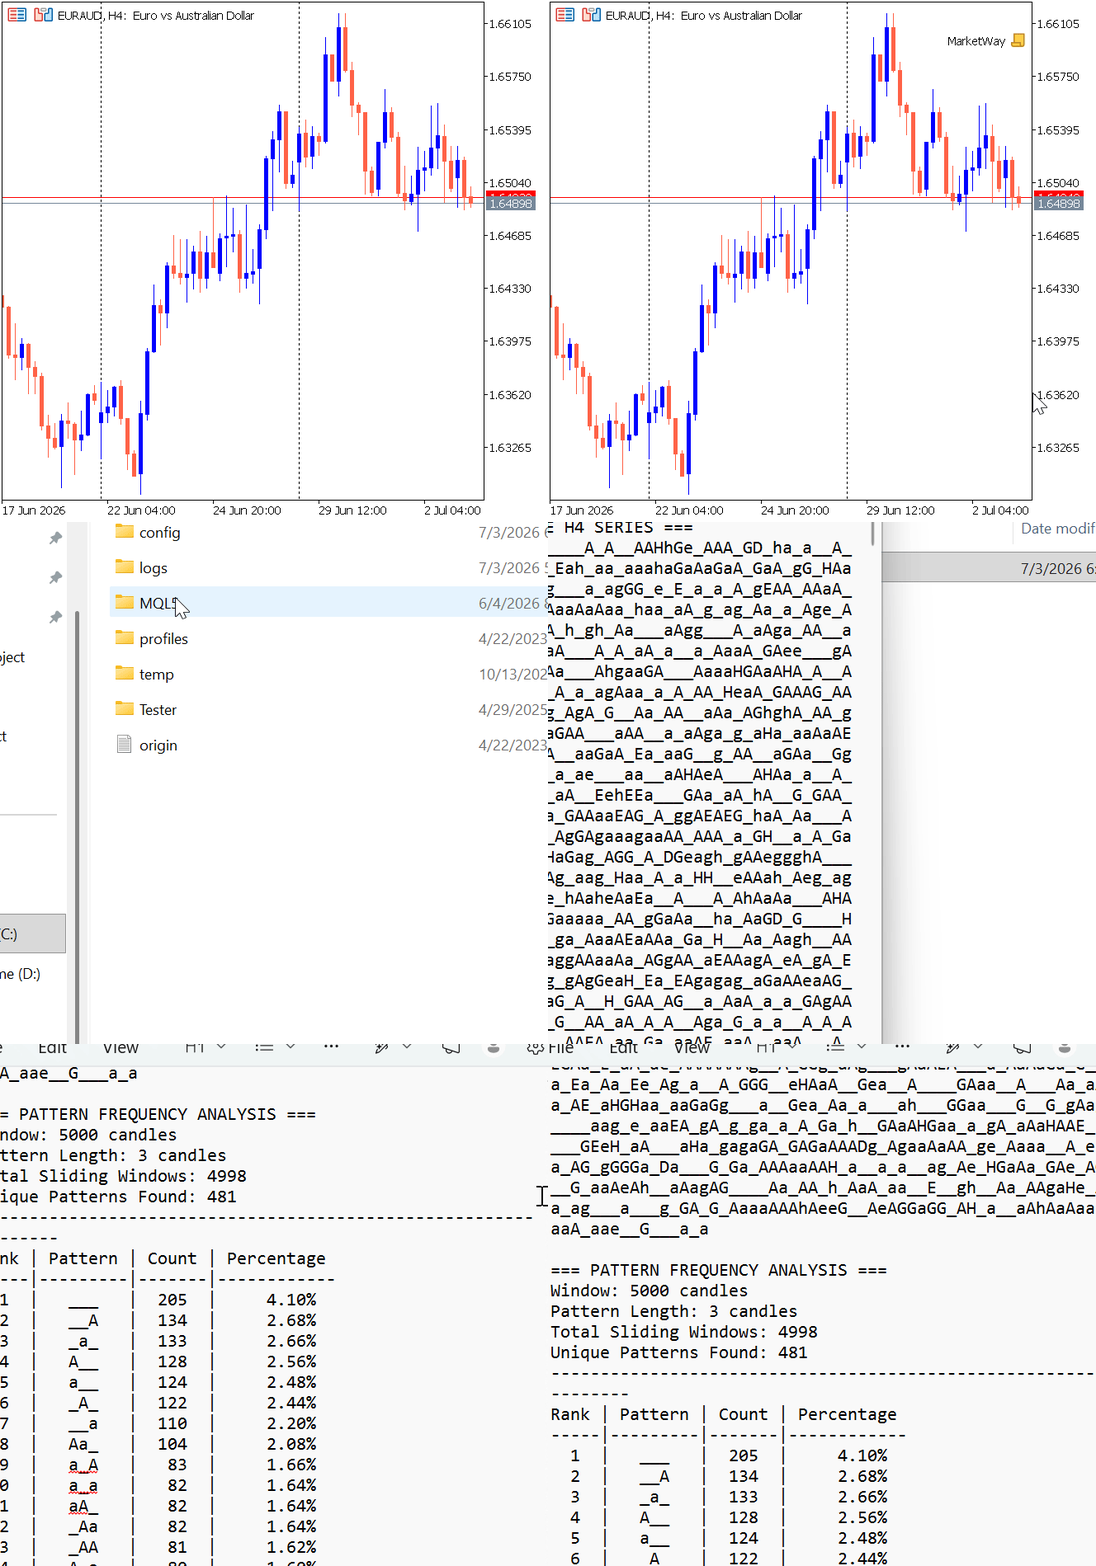
Figure 9: EURAUD (H4)
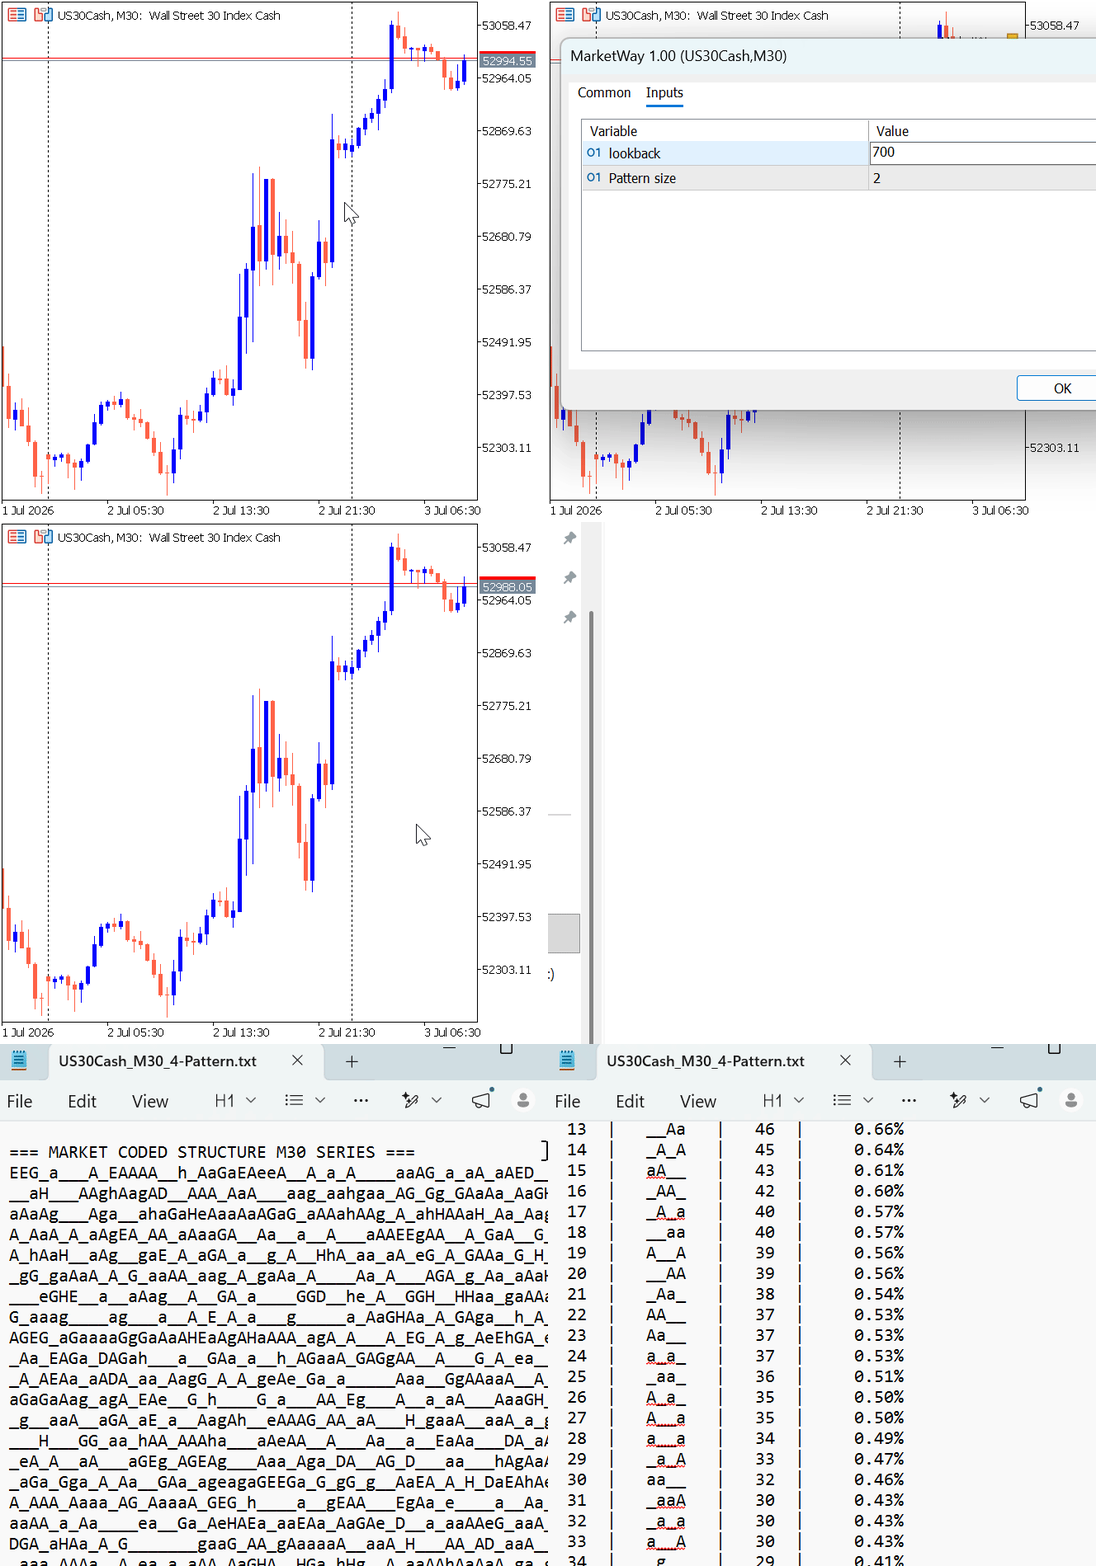
Figure 10: US500Cash (M30)
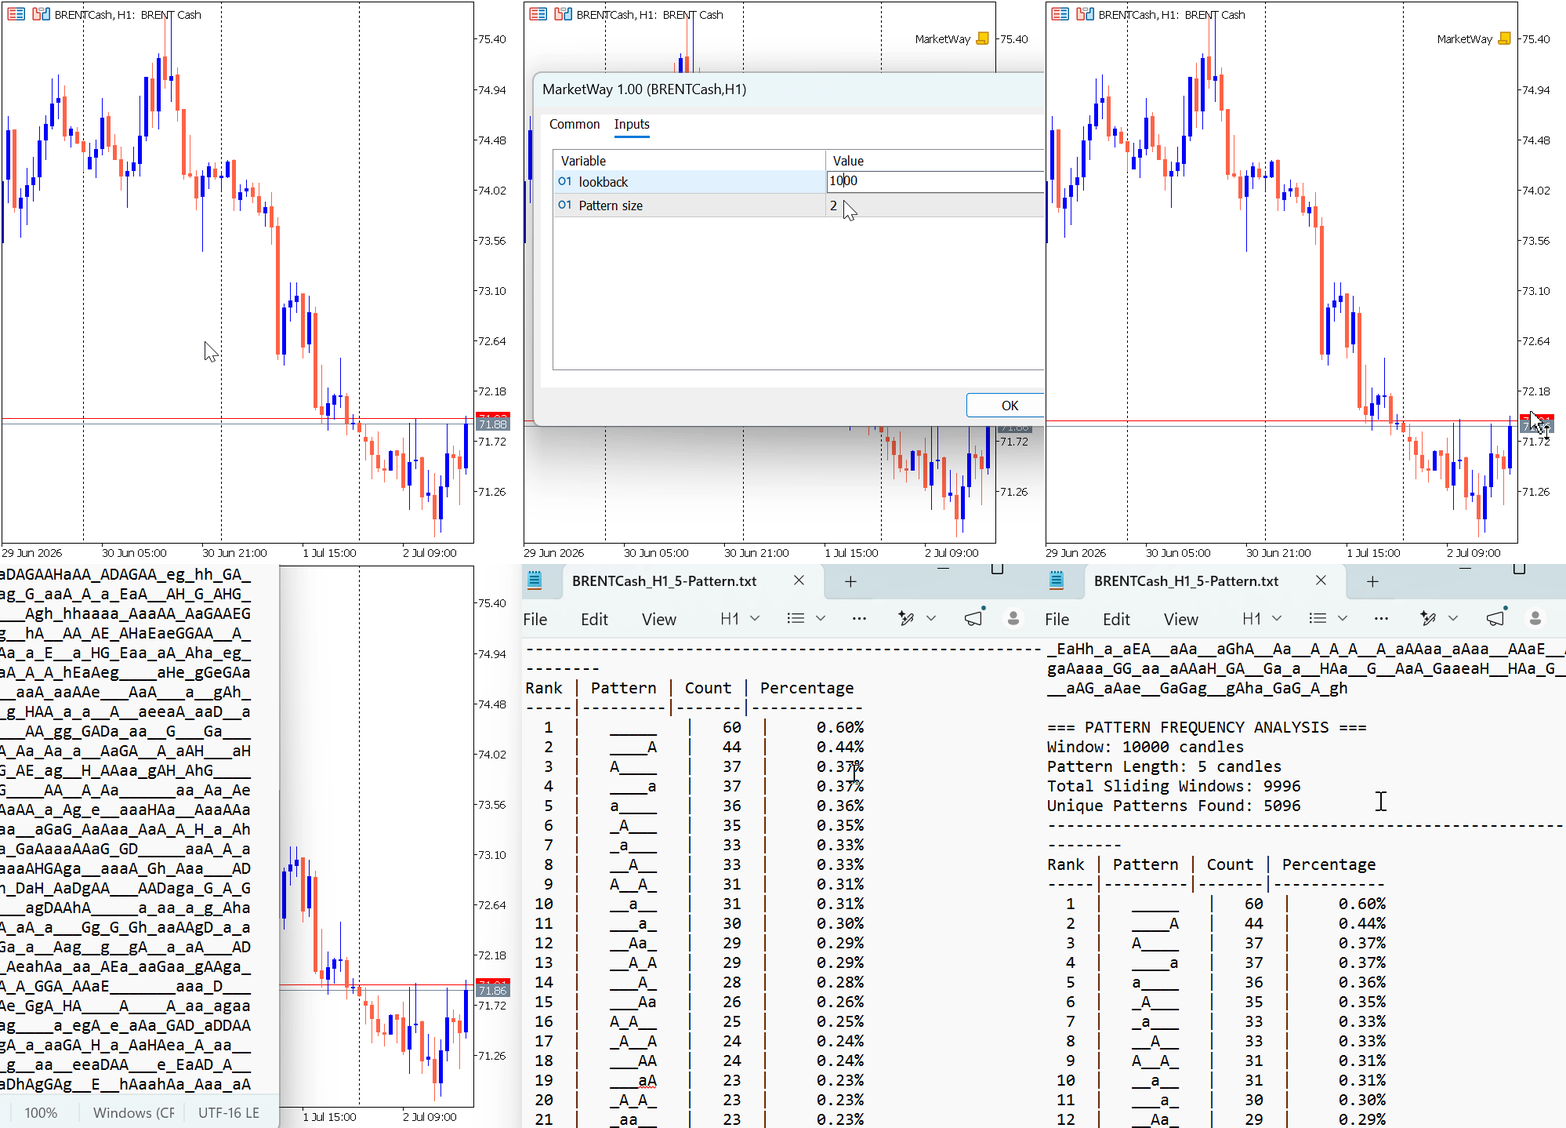
Figure 11: BrentCash (H1)
These demonstrations show that the same algorithm can be applied to different financial instruments, timeframes, historical sample sizes, and pattern lengths without modifying the underlying implementation.
We observed that as the extraction pattern size increases, the variety of unique patterns expands, leading to a decrease in pattern repetition. Consequently, given the diverse types of candlesticks, identical sequential patterns rarely occur as the extraction length grows. We also found that unclassified candlesticks formed the leading pattern combinations across all demonstrations.
As a result, traders and researchers interested in studying interactions between recognized candlestick structures may choose to filter out these patterns and focus exclusively on fully classified combinations or expand the candlestick taxonomy.
Conclusion
Encoding candlestick patterns into alphabetic symbols provides a systematic framework for analyzing price action as ordered sequences rather than isolated chart formations. This approach enables the frequency of both known and previously unexplored candlestick combinations to be quantified objectively. Instead of limiting the analysis to a handful of well-known patterns such as the engulfing, harami, or three white soldiers/black crows, traders and researchers can investigate every recurring candlestick sequence and determine its prevalence using statistical evidence.
In this article, we developed an MQL5 script that automatically encodes historical price data, extracts consecutive patterns of configurable length, computes their frequency and percentage occurrence, and ranks the results in descending order. The script is flexible enough to analyze different financial instruments, timeframes, lookback periods, and pattern lengths, making it a practical tool for exploratory market structure analysis.
The empirical results consistently showed that patterns containing the unclassified candlestick symbol (_) dominate the frequency distribution across both GBPUSD and gold on all examined timeframes. While this confirms that the current encoding framework successfully captures recurring market structures, it also reveals a limitation of the existing candlestick taxonomy. Because the unclassified category aggregates multiple candle characteristics into a single symbol, it provides limited insight into the underlying price-action behavior.
In the next article, we will refine the encoding scheme by subdividing the unclassified candlestick into bullish and bearish categories with more descriptive classifications. This enhanced taxonomy will reduce information loss, improve the interpretability of extracted patterns, and provide a richer foundation for subsequent statistical analyses and the identification of potentially meaningful trading patterns.
Warning: All rights to these materials are reserved by MetaQuotes Ltd. Copying or reprinting of these materials in whole or in part is prohibited.
This article was written by a user of the site and reflects their personal views. MetaQuotes Ltd is not responsible for the accuracy of the information presented, nor for any consequences resulting from the use of the solutions, strategies or recommendations described.

 Building an Object-Oriented Order Block Engine in MQL5
 Neural network trading EA based on PatchTST
 Persistence Entropy as a Market Regime Indicator in MQL5
 Analyzing the Hourly Movement of Trading Symbols and Their Spreads in MetaTrader 5

- Free trading apps
- Over 8,000 signals for copying
- Economic news for exploring financial markets
You agree to website policy and terms of use