
Trend criteria in trading

Introduction
All traders know the phrase "The trend is your friend". Indeed, trending price movements can bring quite large profits. Trend trading is based on the assumption that price movement will continue in the same direction. The main problem with this type of trading is to determine the start and end time of the trend with sufficient accuracy.
Today, there are many approaches to defining and calculating trend parameters. In this article, we will look at the most interesting of them and try to apply them in practice.
Smoothing and trends
Price movement can be represented using a simple model. There is some deterministic component that depends on time. Some random component is added to it, which does not depend on anything and behaves unpredictably. One of the tasks facing a trader is to somehow reduce the influence of this component.
One of the simplest filters is the simple moving average. But this indicator has one serious drawback - it lags. Let's simulate the trend and apply SMA to it with the period of 3.
| Trend | 0 | 1 | 2 | 3 | 4 | 5 |
|---|---|---|---|---|---|---|
| SMA | - | - | 1 | 2 | 3 | 4 |
Now let's try to get rid of the delay. The SMA equation looks like this:
![]()
Add a correction to it, which will be equal to the average price change for one bar:
![]()
Let's see how the ratios of our new indicator change:
![]()
The indicator with such ratios will accurately hit the trend. Let's generalize this indicator to any number of prices handled. The calculation of an indicator with a period of 4 will look like this.
First, find the SMA value:
![]()
There are now two corrections for the average price change:
![]()
![]()
In other words, we calculate the average price change relative to the SMA center. Then, the indicator equation will be as follows:
![]()
The difference between this indicator and SMA is especially noticeable with short periods.
The main disadvantage of this approach is that there are no criteria to be used to select the indicator period. Traders should choose it arbitrarily, based on their own considerations.
Let's try to build an indicator that will not depend on the period. Suppose we have the V time series that we would like to forecast one step ahead. For the forecast we will use the simplest method - previous actions define the future ones. For example, if we have the initial value of V, then the one-step-ahead forecast will be equal to this value:
![]()
Once the new value of V appears, we find the half-sum between the forecast and V. The resulting value will be the forecast for the next step:
![]()
In other words, the forecast will be adjusted as new values of the time series appear. This method of forecasting leads to exponential smoothing with the ratio of 0.5.
Now let's change the approach to forecasting a bit. Let's assume that the forecast change occurs with the same intensity:
![]()
In other words, all forecast values belong to the linear trend. The indicator equation built on this principle will look like this:
![]()
We have a recursive indicator - to calculate the current value of the indicator, its past values are used. But in this form it will be unstable - one of the ratios is equal to 1. To overcome this problem, we will apply the same recursion to Indicator[i+1]:
![]()
The indicator now consists of two parts - SMA with a period of 2 and half the speed of the indicator in previous readings. Let's make one more change to make the indicator more robust:
![]()
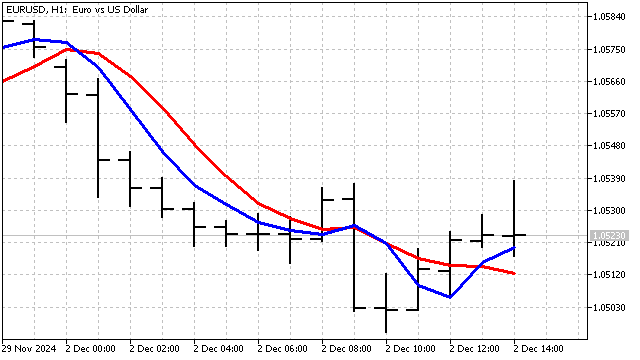
This is what our new indicator looks like compared to a similar EMA with a period of 3.
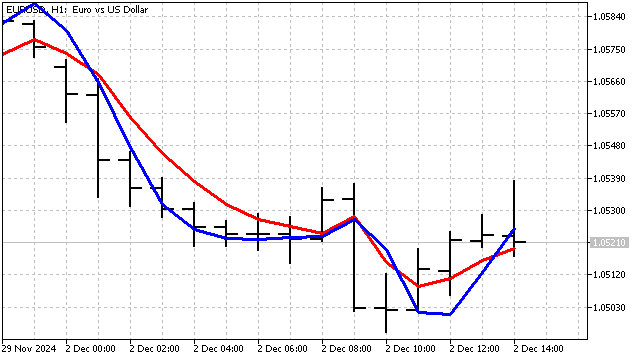
Unfortunately, suppressing noise completely is a nearly impossible task. But it is entirely possible to identify the trend component in price movement. Both indicators are sensitive to changes in trend parameters. At the same time, their delay is reduced to the minimum possible. These indicators can be used both independently, for price smoothing, and as a source of data for other indicators.
Trend criteria
It is more correct to call trend criteria randomness criteria. The essence of their application is very simple. The criterion allows us to check how random the price series is. If the criterion shows us that the series is not random, then we can say that it is a trend. Let's look at possible criteria and how they can be applied in technical analysis.
Abbe criterion. This criterion is based on calculating the variance in two different ways. Normal sample variance is sensitive to trend. In the Allan variance, the influence of the trend tends to zero. By comparing these dispersions, one can estimate the contribution of the trend component to the price change.
I will slightly change the calculation of this criterion for use in trading:
![]()
This criterion only indicates the presence of a trend. The direction of the trend needs to be determined in other ways.
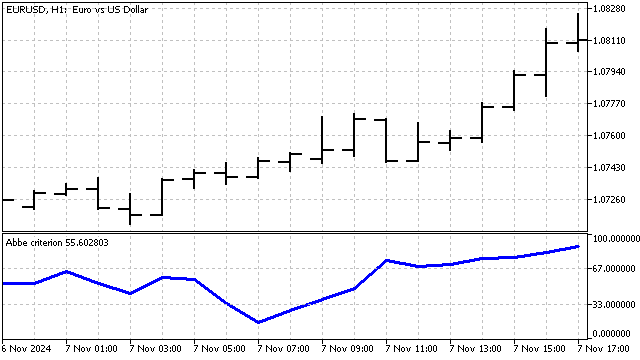
This criterion can help in identifying moments of trend changes.
Criterion of signs of first differences. This criterion is very simple and intuitive. We take N prices. We divide them into consecutive pairs, of which there will be N-1. We apply the sign function to each pair:
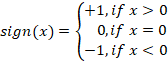
After that, obtain the criterion value:
![]()
In RSI, the same approach is used, but the price movements up and down are calculated separately, without taking into account the signs.
This statistic has one drawback - it does not distinguish the order in which the signs appear. In other words, we can swap the prices and get the same result. To get rid of this drawback, we can assign weights to each sign, depending on the moment of its appearance. Then the criterion calculation will look like this:
![]()
In this case, the sequence of signs becomes unique, and the same result is possible only if the two time series are similar.
Let's see how this criterion can be used for technical analysis. The values that can be obtained using this criterion lie within strictly limited bounds. Intuition suggests that values close to zero may be more common. But, it is better to perform the necessary checks.
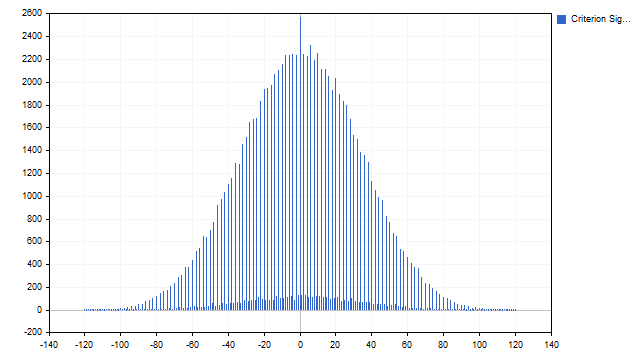
The assumption turned out to be correct. In strict trading language: we have obtained an empirical probability function. What can be learned from this feature? We can get overbought/oversold levels. I set this level to 33% - the indicator sorts out a third of the lowest and highest values. The third that remains in the middle is flat. The indicator itself looks like this:
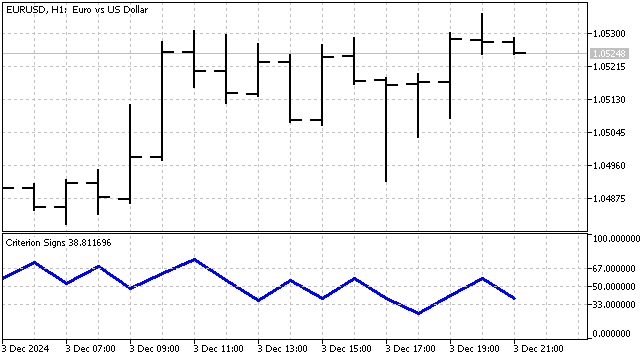
The sign criterion is non-parametric. The main advantage of such criteria is their stability and insensitivity to sudden price changes.
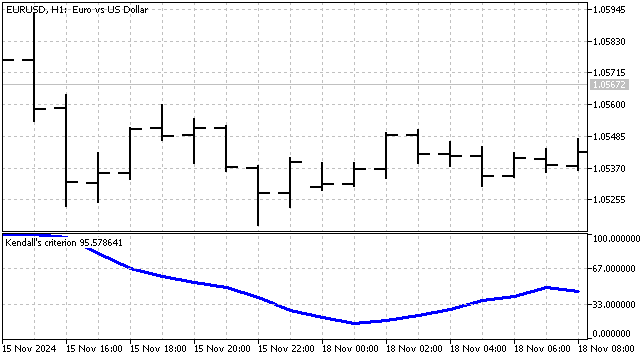
Kendall's criterion. This criterion is also based on the function of signs. But this function is applied a little differently.
The calculation of this criterion can be carried out in two stages. First, for each price we find the sum of the signs with all the prices preceding it:
![]()
After that, we find the total sum of these values:
![]()
With this criterion, we compare the number of price movements up and down for all pairwise price combinations. Thanks to this, we can assess the direction and strength of the trend more accurately.
Wald-Wolfowitz rank test. To calculate this criterion, we need to know the rank of each price. Rank is the number of prices that are below the current one. For example, I will take 5 price values:
| Index | 0 | 1 | 2 | 3 | 4 |
|---|---|---|---|---|---|
| Price | 1.05702 | 1.05910 | 1.05783 | 1.05761 | 1.05657 |
| Rank | 1 | 4 | 3 | 2 | 0 |
The price with index 0 is higher than a single price with index 4. This means that the rank of this price is 1. The price with index 1 is higher than all the others, and its rank is 4. The ranks of all other prices are calculated the same way.
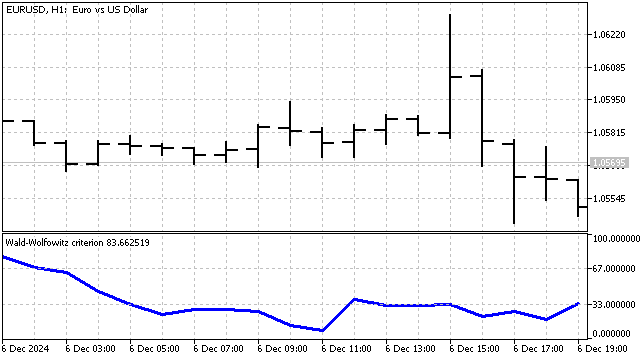
The essence of this criterion is very simple - if prices form a trend, then their ranks will also be organized. Conversely, if the ranks are mixed up in some incomprehensible way, then something incomprehensible happens with the prices as well. In this example, prices are partially ordered, which may indicate the presence of a trend.
The value of this criterion is calculated using the equation:
![]()
In essence, this criterion is a robust variant of the auto correlation function. The indicator built on its basis looks like this:
Foster-Stewart criterion. This criterion allows us to simultaneously assess the presence of a trend in the means and variances. It is based on counting the number of top and bottom records. For each price reading, we determine the value of two variables H and L.
The variable H is equal to 1 if the current price is higher than all previous ones. The variable L is equal to 1 if the price is lower than all previous ones. In all other cases, these variables are equal to zero. The criterion parameters are calculated as follows:
![]()
![]()
The T parameter shows the strength and direction of the trend. The D parameter is similar to the Abbe criterion and indicates only the presence of a trend. These parameters can be used either separately or in combination with each other.
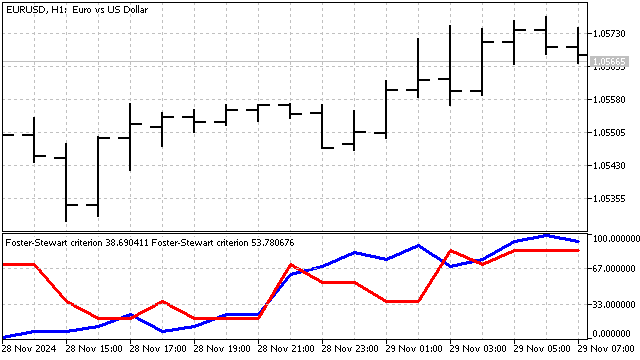
This criterion can be modernized to take into account both parameters simultaneously. In the classical version, a trend can be considered established if the value of T or D is large enough (of course, you need to take the absolute value for T). Thus, during a trend, the product of these parameters deviates maximally from zero. This approach allows us to identify the strongest trends.
Now let's look at how these criteria can be used in trading.
Trading strategies
Unfortunately, trend criteria do not tell us anything about the beginning of a trend. They only indicate that the trend has taken place. It is this property that can be used in trading - after a strong trend, the direction of price movement may change to the opposite.
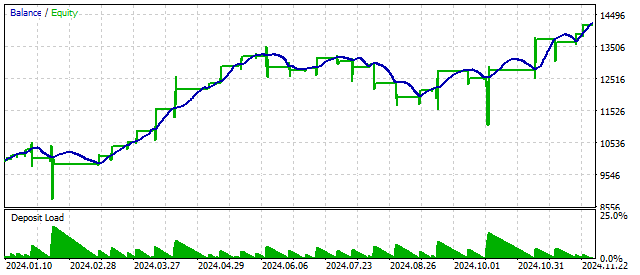
We can use this assumption to create a simple strategy. If the trend criterion has reached some minimum value, then you need to open a buy position. To open sell positions, the criterion should reach its maximum. In other words, trend criteria are used to determine overbought/oversold conditions. This approach looks promising.
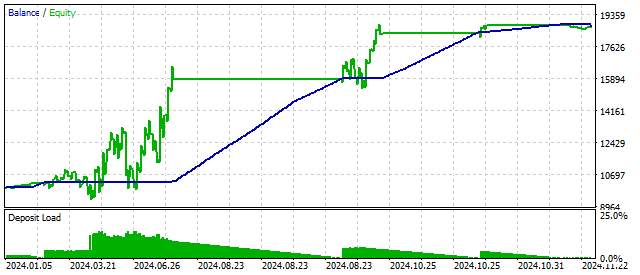
Using additional filters can improve the performance of the strategy. The Abbe criterion can be used as such filter. Let me remind you that this criterion only determines the presence of a trend. The direction of the trend needs to be determined in other ways. For example, I will determine the trend using the average speed of price movement:
![]()
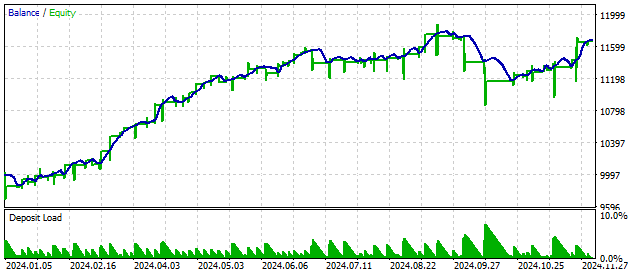
If the obtained value is above or below a certain level, then I consider the trend to be established. To confirm this assumption, I use the Abbe criterion. If its value is above a certain level, then the trend assumption is true. I leave the opening and closing of positions as in the previous example. The result of such a strategy looks like this:
The Foster-Stewart criterion allows one to immediately assess both the presence of a trend and its direction. In other words, this criterion can simultaneously serve as both a signal and a filter. The application of this criterion can give the following results:
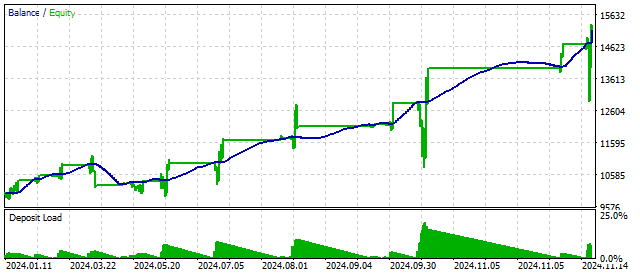
A modernized version of this criterion allows us to obtain different results.
The use of trend criteria is entirely justified, but is associated with some difficulties:
- First, it is necessary to use additional filters to reduce the number of false signals.
- Secondly, separate rules are needed for closing positions to reduce risks and the burden on the deposit.
- Third, trend criteria may be sensitive to the number of prices processed. Therefore, their application may require preliminary smoothing of the time series. For small periods, smoothing should be mandatory.
Conclusion
Currently, there are several dozen trend criteria. The application of these criteria can be useful both in analyzing market situations and in trading.
The following programs were used when writing this article.
| Name | Type | Description |
|---|---|---|
| tSMA | indicator | Trend analogue of SMA
|
| tEMA | indicator | Trend analogue of EMA with period 3 |
| Abbe criterion | indicator | Abbe criterion |
| Criterion Signs | indicator | Criterion of signs of first differences |
| scr Criterion Signs | script | The script allows evaluating the distribution of the sign criterion values
|
| Kendall's criterion | indicator | Kendall's criterion |
| Foster-Stewart criterion | indicator | Foster-Stewart criterion
|
| Foster-Stewart criterion I | indicator | A modernized version of the Foster-Stewart criterion |
| Wald-Wolfowitz criterion | indicator | Wald-Wolfowitz criterion |
| EA 3 criterions | EA | The EA trades according to 3 criteria
|
| EA Abbe criterion | EA |
|
| EA Foster-Stewart criterion | EA |
|
| EA Foster-Stewart criterion I | EA |
|
Translated from Russian by MetaQuotes Ltd.
Original article: https://www.mql5.com/ru/articles/16678
Warning: All rights to these materials are reserved by MetaQuotes Ltd. Copying or reprinting of these materials in whole or in part is prohibited.
This article was written by a user of the site and reflects their personal views. MetaQuotes Ltd is not responsible for the accuracy of the information presented, nor for any consequences resulting from the use of the solutions, strategies or recommendations described.

- Free trading apps
- Over 8,000 signals for copying
- Economic news for exploring financial markets
You agree to website policy and terms of use
I'll try... there are some other interesting criteria, including the definition of a pivot point. I need to figure out how to explain them in a simpler way.
I don't know what the problem is with the tester. I'm getting this.
Thanks, I'll give it a try. And where do you look for explanations of the criteria and mathematical mechanisms for detecting them? Looks like scientific sources ...
Thanks, I'll give it a try. And where do you look for explanations of the criteria and mathematical mechanisms for their detection? Looks like scientific sources ...
there is a lot of literature, but all the criteria are mostly scattered here and there. Here's a good selection of different criteria
I am working on the practical application of the Wald-Wolfowitz trend criterion described in your article. As I understand it, the Wald-Wolfowitz criterion tests the hypothesis of randomness/stationarity of data. In the code of trading Expert Advisors, it is important to understand what exactly the indicator returns?
Do I understand correctly that the Indicator calculates the probability (in per cent) that the sequence of prices (in this case - open values) is random on the basis of the Wald-Wolfowitz criterion.
The result is stored in buffer buffer[0] and represents the percentage probability (from 0 to 100).
The closer the value is to 100%, the higher the probability of randomness (no trend).
The closer to 0%, the higher the probability of non-randomness (presence of trend or clustering)?
Calculation logic:
The indicator ranks the open values for a selected period ( iPeriod ), then calculates statistics based on the ranks and converts it to a percentage value via CDF (empirical distribution function):
Levels in the graph:
indicator_level1 = 33 and indicator_level2 = 67 are benchmarks for interpretation:
<33% - strong non-randomness (trend possible).
>67% - high randomness (flat).
Do I understand the interpretation of the indicator presented in your article correctly?
I am working on the practical application of the Wald-Wolfowitz trend criterion described in your article. As I understand it, the Wald-Wolfowitz criterion tests the hypothesis of randomness/stationarity of data. In the code of trading Expert Advisors it is important to understand what exactly the indicator returns?
Do I understand correctly that the Indicator calculates the probability (in per cent) that the sequence of prices (in this case - open values) is random on the basis of the Wald-Wolfowitz criterion.
The result is stored in buffer buffer[0] and represents the percentage probability (from 0 to 100).
The closer the value is to 100%, the higher the probability of randomness (no trend).
The closer the value is to 0%, the higher the probability of non-randomness (presence of a trend or clustering)?
Calculation logic:
The indicator ranks open values for a selected period ( iPeriod ), then calculates statistics based on the ranks and converts it to a percentage value via CDF (empirical distribution function):
Levels in the graph:
indicator_level1 = 33 and indicator_level2 = 67 are benchmarks for interpretation:
<33% - strong non-randomness (possible trend).
>67% - high randomness (flat).
Do I understand the interpretation of the indicator presented in your article correctly?
Yes, you understand everything correctly. The only thing is that I set the levels 33 and 67 just because I needed some levels. You can set other levels, for example, 25 and 80.
Yes, you understand everything correctly. The only thing is that I set levels 33 and 67 simply because I needed some levels. You can set other levels, for example, 25 and 80.
Thank you for your reply.