
Predicting Renko Bars with CatBoost AI

Introduction
In the silence of my study, only the monitor screen glows. The MetaTrader 5 terminal produces the latest tick data, and the algorithm I developed methodically transforms the market chaos into an orderly system of Renko bars. Three a.m. is the time when real trading strategies are born. I run my hand over my unshaven chin and take a sip of my now cold coffee, my favorite Carte Noir. The model's accuracy of 59.27% is a victory. A real victory for those who understand the unpredictable nature of financial markets.
When Traditional Analysis Became Powerless
Almost 10 years ago, I entered the market with the conviction that technical analysis was a trader's gospel. I drew support and resistance lines, watched moving average crossovers, looked for divergences on the RSI and MACD, but year after year I watched the efficiency of these methods decline. The market was changing, high-frequency trading algorithms were transforming its nature, and classical methods no longer provided the same advantage.
One day, after a particularly bad trading week, I asked myself: what if all the technical analysis books written in the last century are now just entertaining fiction? This question led me to a radical rethinking of my approach to trading and ultimately to the creation of a machine learning-based Renko bar forecasting system.
Renko Bars – A Trader's Digital Zen
I first encountered Renko charts at a conference in Singapore. A Japanese trader, whose name I promised never to reveal, showed me his terminal with unusual rectangular blocks instead of the usual candlesticks. "These are Renko charts," he said, "charts that show only what matters - price movement".
In a world oversaturated with information, Renko charts offer digital Zen — stripping away noise, time factor and anything else that distracts from the true movement of the market. Each new block is formed only when the price moves a certain distance up or down. There is incredible power hidden in this simplicity.
I started experimenting with Renko charts on various instruments. EURUSD, GBPUSD, DAX, S&P 500 – across all of them Renko charts allowed me to see the market structure more clearly and transparently. But manual analysis required time, which is always in short supply. And then I turned to machine learning.
CatBoost - The Algorithm That Conquered Global Markets
The choice of the algorithm was no less important than the choice of trading strategy. After trying dozens of different machine learning models, I settled on CatBoost, a gradient boosting algorithm developed by Yandex. It was love at first run.
# Initialize the CatBoost model
params = {
    'iterations': 300,
    'learning_rate': 0.05,
    'depth': 5,
    'loss_function': 'Logloss',
    'random_seed': 42,
    'verbose': False
}

model = CatBoostClassifier(**params)
model.fit(X_train, y_train, eval_set=(X_test, y_test), early_stopping_rounds=30, verbose=False)
CatBoost not only handles categorical features well, which is critical for analyzing Renko bar patterns, but is also resistant to overfitting and fast enough to be retrained on fresh data every day.
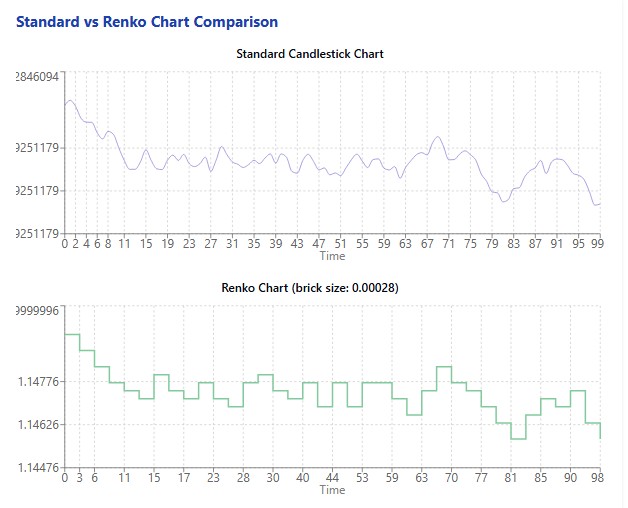
My experiment started by downloading 60 days of EURUSD data – over 12,000 five-minute bars. This data was transformed into 11,578 Renko bars with an algorithmically calculated optimal block size of 0.00028 price units. Feature preparation yielded 11,572 samples for model training.
Finally, the moment of truth has arrived: launching the training of the CatBoost model on the prepared data.
Revelation in Numbers: What the Experiment Showed
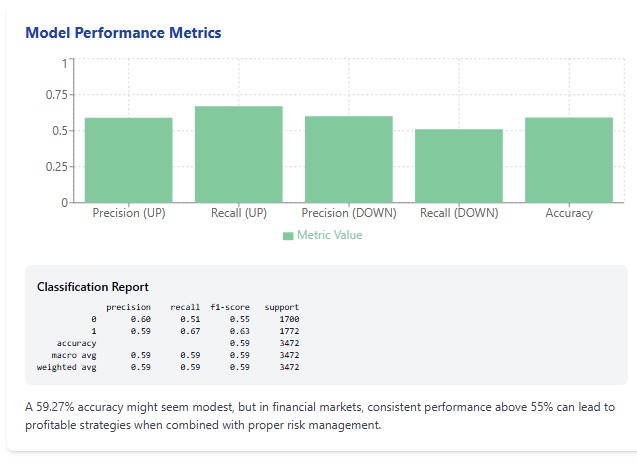
When the algorithm finished training and I saw the results, it was like a revelation. The accuracy of the model on the test sample was 59.27%. For someone inexperienced in trading, this figure may seem modest. But for those familiar with the brutal statistics of financial market trading, this is a remarkable result.
It is worth recalling the famous University of Michigan study that showed that most actively managed funds fail to outperform a simple buy-and-hold strategy. These funds employ brilliant analysts holding doctorates and having access to insider information. Considering this, the accuracy of 59.27% looks not just good, but phenomenal.
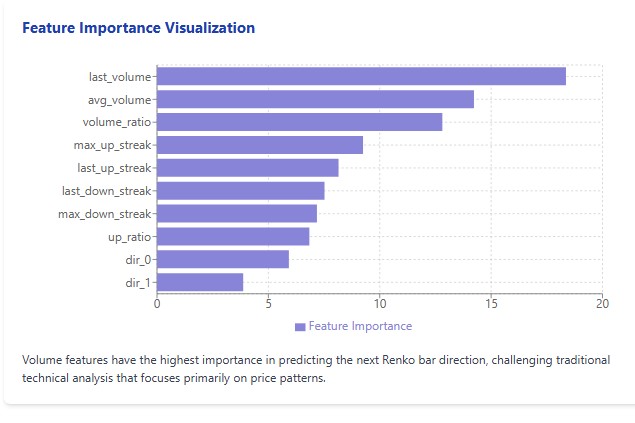
But even more surprising was the analysis of the importance of features. Contrary to all the canons of technical analysis, volume indicators turned out to be significantly more important than price patterns. Last_volume with the importance of 18.36, avg_volume with 14.23 and volume_ratio with 12.81 took the top three positions. They were followed by the parameters of consecutive price movements.
I saw a successful trader a couple of times on one of the well-known social networks who said that the Holy Grail is in dividing the volume into Renko blocks and volume clusters. Perhaps these results are not random at all and have meaning?
The Art of Renko Bars
Working with Renko charts begins with determining the optimal block size. It is like adjusting a microscope: too little magnification will not see details, while too much magnification will distort the overall picture. The Renko block size is a kind of resolution, with which we look at the market.
# Create Renko bars with adaptive block size
def create_renko_bars(df, brick_size=None):
    if brick_size is None:
        # Calculate ATR to determine block size
        df['tr'] = np.maximum(
            df['high'] - df['low'],
            np.maximum(
                np.abs(df['high'] - df['close'].shift(1)),
                np.abs(df['low'] - df['close'].shift(1))
            )
        )
        df['atr'] = df['tr'].rolling(window=14).mean()
        brick_size = df['atr'].mean() * 0.5
        print(f"Renko block size: {brick_size:.5f}")

    # Create Renko bars
    renko_bars = []
    current_price = df.iloc[0]['close']
    # ... the rest of the code
After much experimentation, I have come to the conclusion that the best way to determine the block size is through the ATR (Average True Range) indicator. This approach makes the block size adaptive to the current volatility of the instrument.
In the case of EURUSD, the algorithm determined the optimal block size to be 0.00028 price units, which corresponds to approximately 2.8 pips. At first glance, this may seem insignificant, but it is this granularity that allows us to capture significant movements and filter out market noise.
Creating Renko bars is not just a mechanical transformation of price data. It is the art of extracting signal from noise, isolating meaningful motion from an ocean of vibrations. And when I saw the transformed data displayed on the chart, a crystal-clear picture of the market appeared before my eyes - a ladder of red and green blocks, reflecting the true price movement without the distortions caused by the time factor.
Feature Formation: What Really Matters for Forecasting
The success of any machine learning model depends heavily on the quality and relevance of its features. To predict the direction of the next Renko Bar, I developed a multi-level system of features that takes into account both the history of movements and volume characteristics.
# Prepare features for the model
def prepare_features(renko_df, lookback=5):
    features = []
    targets = []

    for i in range(lookback, len(renko_df) - 1):
        window = renko_df.iloc[i-lookback:i]

        feature_dict = {
            # Directions of the last n bars
            **{f'dir_{j}': window['direction'].iloc[-(j+1)] for j in range(lookback)},

            # Movement statistics
            'up_ratio': (window['direction'] > 0).mean(),
            'max_up_streak': window['consec_up_streak'].max(),
            'max_down_streak': window['consec_down_streak'].max(),
            'last_up_streak': window['consec_up_streak'].iloc[-1],
            'last_down_streak': window['consec_down_streak'].iloc[-1],

            # Volume
            'last_volume': window['volume'].iloc[-1],
            'avg_volume': window['volume'].mean(),
            'volume_ratio': window['volume'].iloc[-1] / window['volume'].mean()
                if window['volume'].mean() > 0 else 1
        }

        features.append(feature_dict)

        # Direction of the next bar (1 - up, 0 - down)
        next_direction = 1 if renko_df.iloc[i+1]['direction'] > 0 else 0
        targets.append(next_direction)

    return pd.DataFrame(features), np.array(targets)
First, I included the obvious features - the directions of the last few bars. Then, I added statistical metrics - the ratio of ascending and descending bars, the length of consecutive movements in one direction, maximum series. And finally, I included volume indicators - the volume of the last bar, the average volume for the period, the ratio of the current volume to the average.
To my surprise, it was the volume indicators that turned out to be the most significant for the forecast. This changed my understanding of price analysis. For years, like most traders, I focused on candlestick shapes, patterns, and trend lines. And the answer all along has been volume — a metric often ignored in Forex due to the decentralized nature of the market.
The final feature set included 14 parameters, which proved to be optimal in terms of the balance between model complexity and its predictive power. More features led to overfitting, fewer features led to underfitting.
Forecasting in Action: From Theory to Practice
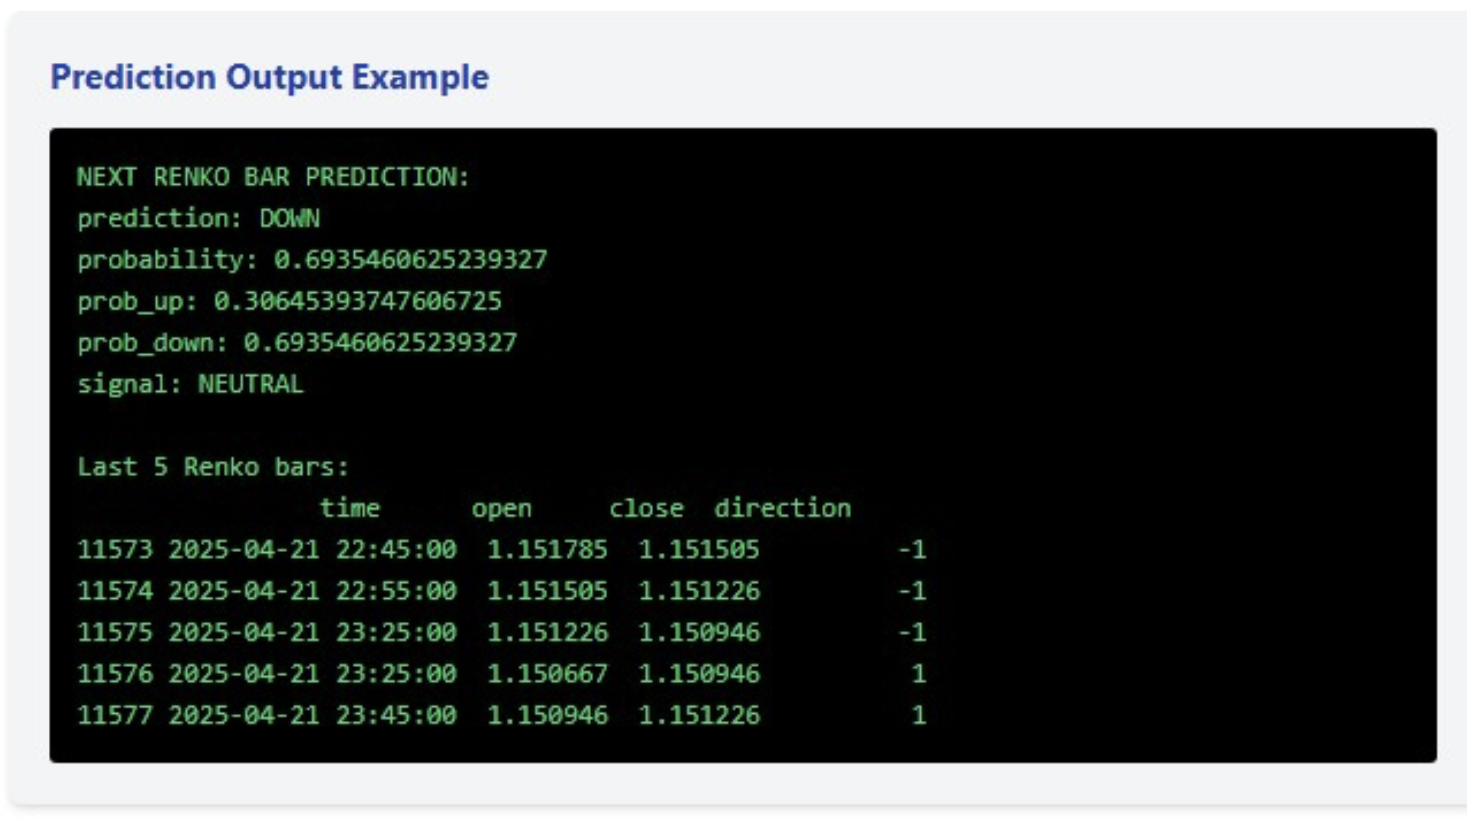
The constructed model produces not only a binary forecast of the direction of the next bar, but also the probability of this movement. In the last example, the model predicted a decline with a probability of 69.35%, which is a fairly confident forecast, but not enough to generate a trading signal (for which I set the threshold at 75%).
# Forecast the next bar
def predict_next_bar(model, renko_df, lookback=5, feature_names=None):
    if len(renko_df) < lookback:
        return {"error": "Insufficient data"}

    window = renko_df.iloc[-lookback:]

    feature_dict = {
        **{f'dir_{j}': window['direction'].iloc[-(j+1)] for j in range(lookback)},
        'up_ratio': (window['direction'] > 0).mean(),
        'max_up_streak': window['consec_up_streak'].max(),
        'max_down_streak': window['consec_down_streak'].max(),
        'last_up_streak': window['consec_up_streak'].iloc[-1],
        'last_down_streak': window['consec_down_streak'].iloc[-1],
        'last_volume': window['volume'].iloc[-1],
        'avg_volume': window['volume'].mean(),
        'volume_ratio': window['volume'].iloc[-1] / window['volume'].mean()
            if window['volume'].mean() > 0 else 1
    }

    X_pred = pd.DataFrame([feature_dict])

    # Make sure all the features are present
    if feature_names:
        for feature in feature_names:
            if feature not in X_pred.columns:
                X_pred[feature] = 0
        X_pred = X_pred[feature_names]

    prob = model.predict_proba(X_pred)[0]
    prediction = model.predict(X_pred)[0]

    return {
        'prediction': 'UP' if prediction == 1 else 'DOWN',
        'probability': prob[prediction],
        'prob_up': prob[1],
        'prob_down': prob[0],
        'signal': 'BUY' if prob[1] > 0.75 else
                 'SELL' if prob[0] > 0.75 else
                 'NEUTRAL'
    }
However, the real value lies not in a single forecast, but in a comprehensive trading system. The last five Renko bars show an interesting dynamic: three consecutive declines, followed by two increases. This upward microtrend, combined with a downward forecast, with a high, but not sufficient probability to signal, indicates possible consolidation and uncertainty in the market.
It is precisely these moments that are the most dangerous for trading, and the system correctly identified this condition, not generating a trading signal, despite the relatively high probability of a decline.
Looking Under the Hood: System Architecture
The developed system is a multi-layered mechanism, in which each component plays its role within the overall forecasting framework. Let's look at the key elements of this architecture.
python# Main function
def main():
    # Get EURUSD data
    print("Load EURUSD data from MetaTrader5...")
    df = get_mt5_data(symbol='EURUSD', days=60)

    if df is None or len(df) == 0:
        print("Unable to retrieve data")
        return

    print(f"Loaded {len(df)} bars")

    # Create Renko bars
    print("Creating Renko bars...")
    renko_df, brick_size = create_renko_bars(df)
    print(f"Created {len(renko_df)} Renko bars")

    # Prepare features
    print("Preparing features...")
    X, y = prepare_features(renko_df)
    print(f"Prepared {len(X)} samples")

    # Train the model
    print("Training the model...")
    model, X_test, y_test = train_model(X, y)

    # Next bar forecast
    feature_names = X.columns.tolist()
    prediction = predict_next_bar(model, renko_df, feature_names=feature_names)

    print("\nNEXT RENKO BAR FORECAST:")
    for k, v in prediction.items():
        print(f"{k}: {v}")

    # Info about the latest bars
    print("\nLast 5 Renko bars:")
    print(renko_df.tail(5)[['time', 'open', 'close', 'direction']])
The basis of the system is a module for downloading data from MetaTrader 5. Integration with MetaTrader 5 allows us to receive up-to-date market data in near real time. This module uses the official MetaTrader 5 API, which ensures reliability and stability.
The next layer is converting standard time bars into Renko. The algorithm calculates the optimal block size based on ATR and performs transformation taking into account volumes and time. A key feature of the implementation is the calculation of sequential movements and their characteristics directly during the formation of Renko bars, which increases the efficiency of the entire system.
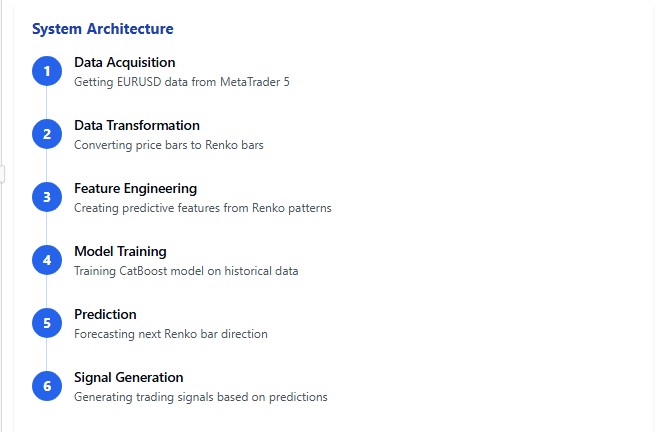
The core of the system is the module for generating features and training the model. Here, each Renko bar is converted into a set of numerical characteristics, which are then fed into the CatBoost algorithm. The selection of optimal model parameters is carried out through cross-validation, taking into account the specifics of financial time series.
Finally, the forecasting module takes the trained model and the current data, generates a forecast, and, when a specified confidence threshold is reached, generates a trading signal.
The entire system is written in Python using numpy, pandas, MetaTrader 5 and catboost libraries. The choice of Python is due not only to the ease of development, but also to the wide range of possibilities for data analysis and visualization of results.
Conclusions and Prospects: The Future of Algorithmic Trading
After developing and testing the Renko bar forecasting system, I came to several important conclusions that may change the way you think about algorithmic trading.
Firstly, classical methods of technical analysis are inferior in efficiency to modern machine learning algorithms. An accuracy of 59.27% may not sound impressive, but it consistently outperforms most technical indicators over long periods of time.
Secondly, volume indicators turned out to be significantly more important than price patterns in predicting market movements. This contradicts many classic trading textbooks, but is confirmed by the results of simulations on real data.
Third, Renko charts actually remove noise from price data, allowing machine learning algorithms to identify more consistent patterns in market movement.
But the most important thing is that this is just the beginning. I see great potential for further development of the system. It is possible to include fundamental data, news events, and market sentiment analysis via social media. Expansion to other instruments and timeframes can also be considered. It is possible to create an ensemble of models to improve forecasting accuracy.
Conclusion
The world of algorithmic trading is on the brink of a new revolution, and the combination of Renko charts with modern machine learning algorithms could be one of its drivers. I invite anyone interested in this topic to dive into the world of data, algorithms, and forecasting. The future of trading is here – and it is algorithmic.
Translated from Russian by MetaQuotes Ltd.
Original article: https://www.mql5.com/ru/articles/17531
Warning: All rights to these materials are reserved by MetaQuotes Ltd. Copying or reprinting of these materials in whole or in part is prohibited.
This article was written by a user of the site and reflects their personal views. MetaQuotes Ltd is not responsible for the accuracy of the information presented, nor for any consequences resulting from the use of the solutions, strategies or recommendations described.

- Free trading apps
- Over 8,000 signals for copying
- Economic news for exploring financial markets
You agree to website policy and terms of use
You can't get more than 63 per cent. Whatever signs are added. 63 for forex is a fiasco
I got more than 75% on Midas (multimodular, where many modules combine their signals into a single signal). But then another problem arises - signals once a month and a half))))The more reliable the signal, the less often it occurs...That's why I started to forget about high winrate in recent robots, I try to predict the depth of movements to take the risk to profit in 1:3, 1:4, etc. I set up marks in such a way that they give bonuses to models through DQN for correct marking of deep movements....This eventually resulted in the robot LSTM Europe.
I got above 75% on Midas (multi-modular, where many modules combine their signals into a single signal). But then another problem arises - signals once a month and a half))))The more reliable the signal, the less often it occurs...That's why I started to forget about high profitability in recent robots, I try to predict the depth of movements to take the risk to profit in 1:3, 1:4, etc. I set up marks in such a way that they give bonuses to models through DQN for correct marking of deep movements....This eventually resulted in the robot LSTM Europe.
75 on LTSM at lookback = 5 bars_ahead = 1 but this is for binary trading, not for forex.
So where's the AI? Or have you elevated catbust to that rank?
You should do a test or something. 58% is okay? This Accuracy is just a benchmark. The main indicator is the balance on the test based on the signals received.
It's not interesting.