
CAPM Model Indicator for the Forex Market

Historical development of the CAPM model
The emergence of the capital asset pricing model was the result of revolutionary changes in the understanding of the relationship between risk and return in financial markets. In the early 1960s, finance as a discipline was undergoing a period of rapid development, as researchers sought to create mathematically rigorous models to explain asset pricing.
The foundations of CAPM were laid in the works of Harry Markowitz, who introduced modern portfolio theory in 1952. Markowitz demonstrated how investors can optimize risk-return ratios by diversifying their portfolios. His concept of the efficient frontier became the foundation for further theoretical developments in finance.
William Sharpe, while developing Markowitz's ideas, encountered the practical problem of the computational complexity of portfolio optimization. At that time, computer power was limited, and calculating the covariance matrix for a large number of assets presented a serious technical challenge. This prompted Sharpe to search for a simplified model that would retain theoretical rigor but be more practical in application.
In 1964, Sharpe published his famous article "Capital Asset Prices: A Theory of Market Equilibrium under Conditions of Risk", where the CAPM model was first presented. Independently of Sharpe, similar ideas were developed by John Lintner and Jan Mossin, which underscored the fundamental nature of these findings. For his contributions to financial theory, Sharpe was awarded the Nobel Prize in Economics in 1990.
The model quickly gained acceptance in academic circles and became the basis for many practical applications in investment management. By the 1970s, CAPM was already widely used by investment funds and corporations to estimate the cost of capital and make investment decisions.
The mathematical structure of the classical CAPM model
The classical CAPM model is based on a number of key assumptions that determine its mathematical structure and practical applicability. The central equation of the model expresses the expected return of an asset through a system of interrelated parameters:
E(Ri) = Rf + βi × (E(Rm) - Rf)
where E(Ri) represents the expected return of asset i, Rf denotes the risk-free rate of return, βi is the beta coefficient for asset i, and E(Rm) is the expected return of the market portfolio.
The beta coefficient plays a central role in the model and is defined as the ratio of the covariance of the asset return with the market return to the variance of the market return:
βi = Cov(Ri, Rm) / Var(Rm)
This indicator measures the sensitivity of a particular asset's returns to changes in overall market returns. Assets with a beta greater than one exhibit greater volatility than the market, while assets with a beta less than one are less volatile.
The model assumes that there is a linear relationship between systematic risk (measured by beta) and expected return. This relationship is graphically represented by the Security Market Line, which shows the equilibrium relationship between risk and return for all assets in the economy.
The fundamental assumptions of CAPM include perfectly competitive markets, no transaction costs, all investors having the same expectations of future returns, the ability to lend and borrow at a risk-free rate, and a normal distribution of asset returns.
The model also assumes that all investors are rational utility maximizers who make decisions solely based on the expected return and risk of the portfolio. Furthermore, it is assumed that investors have the same investment horizon and the same market information.
Unsystematic risk in the CAPM is completely eliminated through portfolio diversification, so investors are compensated only for taking on systematic risk. This means that in equilibrium, all efficient portfolios should lie on the same straight line in the risk-return coordinates.
Theoretical foundations of adapting CAPM to the foreign exchange market
The classic CAPM equation expresses the expected return of an asset in terms of the risk-free rate and a systematic risk premium. In the context of currency pairs, this concept takes on particular significance, since each currency pair represents the relative value of two national economies along with their inherent macroeconomic risks.
In our implementation for the MetaTrader 5 platform, we modified the classical approach by replacing the beta coefficient with a dynamic risk premium based on the historical volatility of the currency pair. This decision is driven by the specific nature of the foreign exchange market, where systematic risk manifests itself through the variability of exchange rate fluctuations rather than through correlation with the market portfolio.
//--- input parameters
input int      InpPeriod = 20;              // Calculation period
input double   InpRiskFreeRate = 0.05;      // Risk-free rate (annual)
input double   InpRiskPremium = 0.02;       // Currency pair risk premium
input bool     InpShowInfo = true;          // Show the info panel

//--- indicator buffers
double ExpectedReturnBuffer[];
double RiskPremiumBuffer[];
A key feature of the implementation is the use of a robust approach to calculating the dispersion of returns. We employ unbiased variance estimation and properly handle cases of insufficient data, which is critical to maintaining computational stability in the face of market disruptions or low liquidity.
Volatility is annualized using the standard square root factor of 252, which corresponds to the number of trading days in a year. This approach allows volatility indicators to be brought to a comparable scale with risk-free rates, which are traditionally quoted on an annual basis.
//--- annualize the indicators (252 trading days)
double annual_volatility = volatility * MathSqrt(252.0);
double annual_return = mean_return * 252.0;

//--- calculate the risk premium based on volatility
double dynamic_risk_premium = InpRiskPremium * (annual_volatility / 0.15);
Economic interpretation of the indicator results
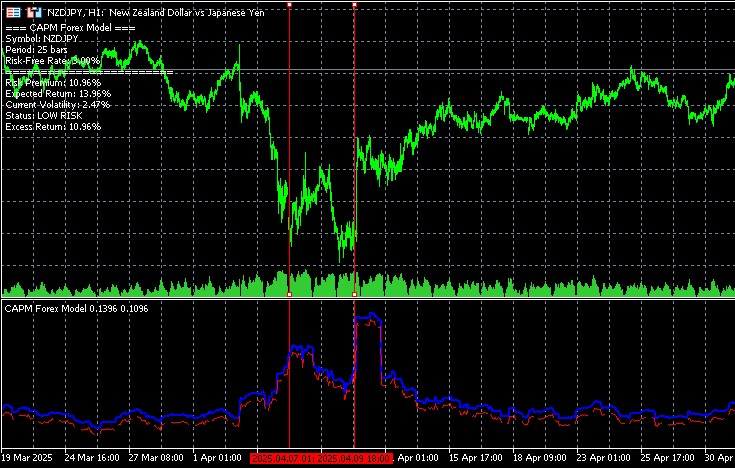
The most interesting aspect of the developed indicator is its behavior under different market conditions. Empirical observations show that expected returns and risk premiums exhibit a pronounced tendency to increase precisely during periods of extreme market conditions. This phenomenon has deep economic roots and reflects the fundamental principles of pricing in financial markets.
During the formation of local peaks, the volatility of a currency pair naturally increases as market participants revise their expectations regarding future exchange rate movements. Increased uncertainty leads to an increase in the risk premium that investors demand for owning a given asset. A similar situation is observed during the formation of market bottoms, when panic and widespread position liquidation create higher expected future returns.
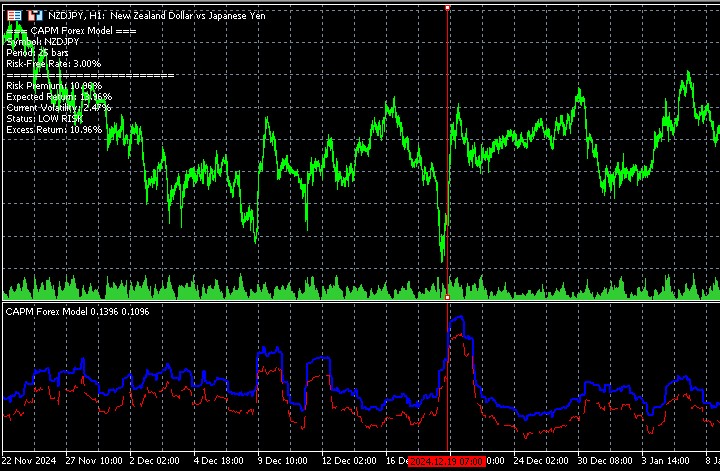
void ShowInfoPanel(int current_bar)
{
    string info = "";
    info += "=== CAPM Forex Model ===\n";
    info += StringFormat("Risk Premium: %.2f%%\n", RiskPremiumBuffer[current_bar] * 100);
    info += StringFormat("Expected Return: %.2f%%\n", ExpectedReturnBuffer[current_bar] * 100);

    if(current_volatility > 0.20)
        info += "Status: HIGH RISK\n";
    else if(current_volatility > 0.10)
        info += "Status: MEDIUM RISK\n";
    else
        info += "Status: LOW RISK\n";
}
This indicator behavior is consistent with the classical theory of efficient markets, according to which higher risk should be compensated by higher expected returns. In the context of currency trading, this means that periods of increased volatility potentially offer more favorable opportunities for profit, but require a correspondingly more cautious approach to risk management.
Technical implementation and computational aspects
The indicator architecture is based on the use of two main data buffers, each of which performs a specific analytical function. ExpectedReturnBuffer contains expected return values calculated based on the modified CAPM equation, while RiskPremiumBuffer reflects the dynamics of the risk premium depending on changes in volatility.
//--- plot Expected Return
#property indicator_label1  "Expected Return"
#property indicator_type1   DRAW_LINE
#property indicator_color1  clrBlue
#property indicator_style1  STYLE_SOLID
#property indicator_width1  2

//--- plot Risk Premium
#property indicator_label2  "Risk Premium"
#property indicator_type2   DRAW_LINE
#property indicator_color2  clrRed
#property indicator_style2  STYLE_DASH
#property indicator_width2  1
The CalculateCurrentVolatility function is an optimized implementation of the current volatility calculation algorithm using built-in MetaTrader 5 functions for working with historical data. Using the CopyClose function provides efficient access to price data without having to iterate through the entire array of quotes.
double CalculateCurrentVolatility(int current_bar)
{
    if(current_bar < InpPeriod)
        return 0.0;

    double returns_sum = 0.0;
    double returns_sq_sum = 0.0;
    int valid_count = 0;

    // Obtain close price data for calculation
    double prices[];
    int copied = CopyClose(Symbol(), PERIOD_CURRENT, current_bar - InpPeriod, InpPeriod + 1, prices);

    if(copied <= InpPeriod)
        return 0.0;

    // Calculate returns
    for(int j = 1; j < ArraySize(prices); j++)
    {
        if(prices[j-1] > 0)
        {
            double daily_return = (prices[j] - prices[j-1]) / prices[j-1];
            returns_sum += daily_return;
            returns_sq_sum += daily_return * daily_return;
            valid_count++;
        }
    }

    if(valid_count < 2)
        return 0.0;

    double mean_return = returns_sum / valid_count;
    double variance = (returns_sq_sum / valid_count) - (mean_return * mean_return);
    double volatility = MathSqrt(MathMax(variance, 0.0));

    return volatility * MathSqrt(252.0); // annualized volatility
}
Practical significance of the indicator in trading systems
The developed CAPM indicator demonstrates high practical value, precisely due to its ability to quantitatively assess changes in the risk-return ratio in market dynamics. When a currency pair approaches critical support or resistance levels, the indicator records an increase in volatility and, accordingly, increases the expected return estimate.
This feature makes the indicator especially useful for traders using counter-trend strategies. An increase in risk and return indicators at extremes can serve as a signal to look for entry points against the current trend, since increased volatility often precedes reversal movements.
For trend-following strategies, the indicator provides information on how well the current price movement corresponds to a fair risk assessment. If the actual movement significantly exceeds the expected return calculated by the indicator, this may indicate the formation of a speculative bubble or an overreaction of the market to the news.
Model drawbacks and development directions
Despite its practical usefulness, the adapted CAPM model for the foreign exchange market has a number of conceptual limitations that should be taken into account when interpreting the results. The underlying assumption of a normal distribution of returns does not always correspond to the real characteristics of currency markets, especially during periods of macroeconomic shocks or political crises.
The model also does not take into account autocorrelation effects in the return series, which may be significant for high-frequency data. Furthermore, using a fixed risk-free rate may not reflect the real dynamics of central bank interest rates, especially during periods of active monetary policy.
A promising direction for the indicator development is integration with macroeconomic data for dynamic adjustment of the risk-free rate in accordance with current decisions of central banks. Also of interest is the implementation of adaptive algorithms for automatic adjustment of model parameters depending on the volatility regime of a particular currency pair.
Incorporating machine learning elements can allow the indicator to adapt to changing market conditions and improve the accuracy of predicting expected returns. This approach is particularly relevant in the context of modern algorithmic trading systems, where the speed of adaptation to new market regimes is a critical factor for success.
The developed CAPM indicator represents a successful attempt to apply classical financial theory to the specifics of currency trading. Its ability to quantify changes in the risk-return relationship makes it a valuable tool for making informed trading decisions in a constantly changing market environment.
Conclusion
The study showed that the adaptation of the CAPM model to the foreign exchange market can be effectively implemented as an indicator for MetaTrader 5. The developed tool dynamically estimates the expected return of currency pairs based on volatility and successfully identifies periods of increased risk and potential.
The indicator demonstrates that classic models, when properly implemented technically, remain relevant in modern trading and can improve the quality of trading decisions.
Translated from Russian by MetaQuotes Ltd.
Original article: https://www.mql5.com/ru/articles/18281
Warning: All rights to these materials are reserved by MetaQuotes Ltd. Copying or reprinting of these materials in whole or in part is prohibited.
This article was written by a user of the site and reflects their personal views. MetaQuotes Ltd is not responsible for the accuracy of the information presented, nor for any consequences resulting from the use of the solutions, strategies or recommendations described.

- Free trading apps
- Over 8,000 signals for copying
- Economic news for exploring financial markets
You agree to website policy and terms of use
very good