MQL5 Wizard Techniques you should know (Part 77): Using Gator Oscillator and the Accumulation/Distribution Oscillator
Introduction
Continuing with our exploration of indicator pairings in generating key trade signals, we now look at the Gator oscillator and the Accumulation/Distribution oscillator (AD). Unlike the AD, the gator oscillator is direction neutral, however we use both for their complimentary use of tracking momentum and volume as a signal confirmation. Direction neutrality for the gator means we will rely on another indicator or price action in order to establish the trend. For this article, we are using the latter.
The Gator Oscillator
The gator was created by Bill Williams to measure the amount of convergence and divergence between his three moving averages within another of his umbrella indicators, the Alligator. This Alligator consists of the three famous buffers of ‘jaws’, ‘teeth’, and ‘lips’. The gator though, creates a ‘visualization’ of this Alligator by defining its phases as four, namely sleeping, waking, eating, and sating. These four phases map points on a cycle that includes trending markets and flat/choppy situations. They are particularly instrumental in spotting the start of a trend aka the jaws opening or its exhaustion which is also referred to jaws closing.
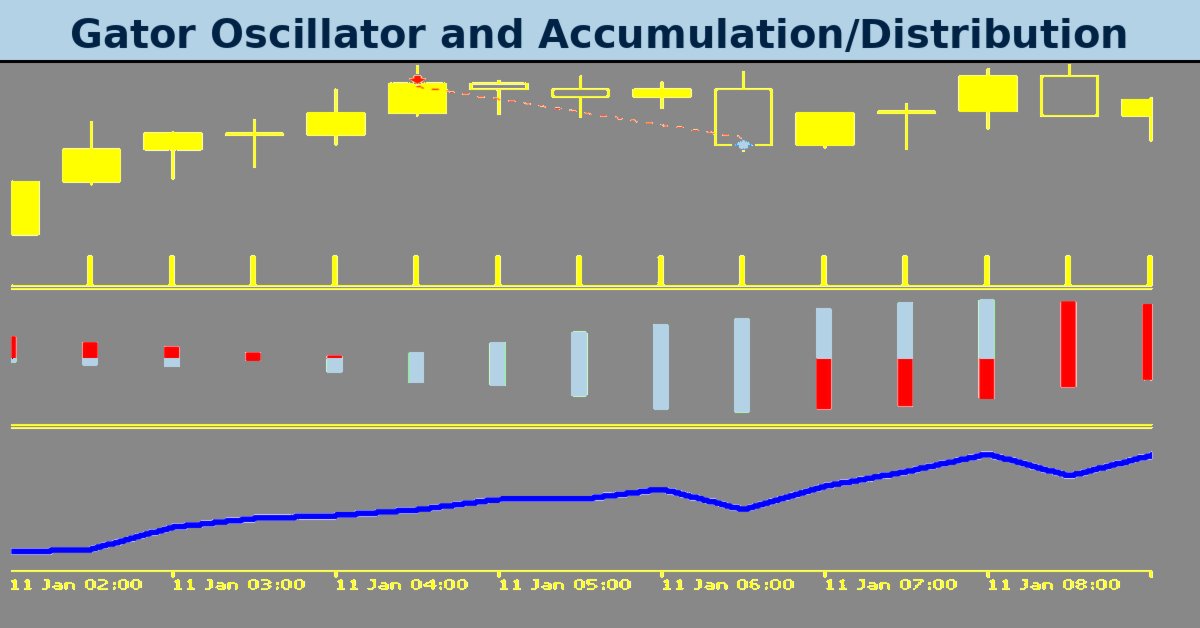
Proponents say its strength is the clean visual signal of trend phase changes via the green/red histogram colouring as seen above and below the zero threshold. Weakness is it is not predictive by itself and in fact needs price action or other indicators for actual entry/exit logic. The formula for the gator is defined in the following steps. First, we establish the median price:

Then the moving average buffers of the ‘jaw’, the ‘teeth’ and the ‘lips’:

Where:
- SMMA(series, n): Smoothed Moving Average of a price type ‘series’ with period n. Our ‘series’ is the median price.
- jaw_period=13, jaw_shift=8
- teeth_period=8, teeth_shift=5
- lips_period=5, lips_shift=3
With the signature-three buffers defined, we can now set the upper and lower histogram indicator values.

Where:
- ∣⋅∣: Absolute value.
- Gator_Up (plotted above zero), Gator_Down (plotted below zero, negative).
The ‘alligator lines’, our signature buffers of ‘jaws’,’teeth’, and ‘lips’ use SMMAs with forward shift - making the indicator ‘see ahead’ and perform more like a market phase detector as opposed to a regular MA crossover. The gator-up histogram is the absolute difference between the jaw and teeth. When this increases, we can infer that the gator’s mouth is opening and therefore trends are commencing. The gator-down histogram on the other hand is the negative absolute difference between the teeth and the lips - an increase in this, meaning it is becoming more negative, confirms a trend phase or its exhaustion. The bar colours often used are green to mark increases in bar length. Red is for marking declines, and with stalls we maintain the previous bar colour.
The gator oscillator can be resourceful in timing entries to avoid sleepy/low-volatility markets. Entry can be devoted to only when the histogram bars are both expanding, as marked by the green signal - the eating phase. This indicator is also ideal for trend following and not range trading or mean-reversion. The use of shifts for these MA buffers is critical - the replacing of these with zero leads to a very different and not very helpful indicator. Finally, combination with price action in spotting breakouts or higher highs or lower lows, is essential as this is the only way this indicator can be used since it is direction neutral.
The AD Oscillator
Our second indicator for this article is the Accumulation/Distribution oscillator (AD). This measures buying and selling pressure with the aid of price and volume. It spots real money flow by identifying the accumulation aka smart-buying as well as the distribution/smart-selling. When in use, divergence from price is often a red flag or a green light, depending on the situation. For instance, in some cases, price rising and AD falling can point to a hidden distribution. Its strength is the integration of volume and not just price, which tends to provide a better context for trend sustainability. Its weaknesses are in its struggles in low-volume settings or easily ‘manipulated’ thin markets.
In addition, for forex trading, we are constrained to use tick volume only. Arriving at the formula for this indicator starts with working out the money flow multiplier. This is as follows:

Where:
- Hight − Lowt ≠ 0; if zero, set result to NaN (avoid division by zero).
We then need to work out the money flow volume. This is given by our formula below:

With this, we then need to get the ADL or Accumulation-Distribution-Line.

Where this is a summation of trailing money flow volume values. The final value we need to determine are the actual AD oscillator values. These are got from the formula below:

Where:
- EMA(series,n): Exponential Moving Average with period n for the respective series. The series in our case are ADL buffers.
- Typically used periods are: fast_period=3, slow_period=10, where fast_period<slow_period. For our purposes, in order to sync the AD oscillator with the gator oscillator, we are using Fibonacci numbers of 5 and 13 for the two periods respectively.
The money flow multiplier tells you where the close price is at in the day’s range. A value of +1 marks the top while the bottom is indicated by -1, with zero bing the middle. The money flow volume weights this multiplier by volume - this means a price change with more volume counts more or is more significant. The ADL is the running total of the money flow - an indication of whether bulls or bears are in charge of the tape. In the end, the AD oscillator serves a signed-volume indicator - highlighting the difference between fast and slow EMAs’ on the ADL. Positive readings are bullish, while negative ones are bearish.
To sum up, the AD oscillator is useful in confirming trends - for instance whether price is going up and the chart price move is ‘real’. Divergences between price and the AD can function as early warnings that the prevalent price-trend is fake or ending. This indicator has limited utility in illiquid markets or situations with missing or erroneous volume data. It better serves as a filter to established trade setups or as a divergence detector. It's not suitable as a naked entry/exit tool.
With the two indicators introduced, let's now focus on their 10 signal patterns. We are going to be training with the pair GBP JPY, on the 30-minute timeframe for the year 2023 with 2024 being a forward walk test year. We test these 10 signal patterns that are each assigned an index, one at a time, while being guided by these rules:
Indexing is from 0 to 9 allowing us to easily compute the map value for their exclusive use by the Expert Advisor. For instance, if a pattern is indexed 1 then we have to set the parameter ‘PatternsUsed’ to 2 to the power 1 which comes to 2. If the index is 4 then this is 2 to the power 4 which comes to 16, and so on. The maximum value that this parameter can be assigned, meaningfully, is 1023 since we have only 10 parameters. Any number between 0 and 1023 that is not a pure exponent of 2 would represent a combination of more than one of these 10 patterns.
Volume-Confirmed Breakout (Gator “Awakening” + A/D Surge)
Our first pattern is registered if after a spat of consolidation aka the gator napping, the oscillator indicates an awakening. With this, we would have one bar turning green, while the other would remain red. This is taken as a sign that the gator’s jaw/teeth/lips are beginning to diverge, and a new uptrend may be starting. This bullish breakout indication is confirmed once a sharp rise in the AD oscillator is also registered. A surge in volume based buying pressure with AD making new highs or a steep upturn implies recent price uptrends are backed by volume. Therefore, together, these two signs mark a robust upward breakout with trend and volume in agreement. We implement this in MQL5 as follows:
//+------------------------------------------------------------------+
//| Check for Pattern 0.                                             |
//+------------------------------------------------------------------+
bool CSignalGator_AD::IsPattern_0(ENUM_POSITION_TYPE T)
{  if
   (
      clrRed == Color_UP(m_gator, X()) &&
      clrGreen == Color_LO(m_gator, X())
   )
   {  if
      (
         T == POSITION_TYPE_BUY &&
         High(X() + 2) > High(X() + 3) &&
         High(X() + 1) >= High(X() + 2) &&
         Close(X()) >= High(X() + 1) &&
         AD(X() + 1) > AD(X() + 2) &&
         AD(X()) > AD(X() + 1)
      )
      {  return(true);
      }
      else if
      (
         T == POSITION_TYPE_SELL &&
         Low(X() + 2) < Low(X() + 3) &&
         Low(X() + 1) <= Low(X() + 2) &&
         Close(X()) <= Low(X() + 1) &&
         AD(X() + 1) < AD(X() + 2) &&
         AD(X()) < AD(X() + 1)
      )
      {  return(true);
      }
   }
   return(false);
}
The bearish setup, conversely, is also following the gator awakening with a similar histogram colour flip as with the bullish signal above, since the gator colour is trend agnostic. This direction neutral gator signal can also mean a downside breakout. While this is indicated on the gator, the AD line would drop - making new lows. This drop would indicate a distribution or heavy selling. Gator’s neutrality means we are incorporating some price action signals into this pattern, as can be seen above in our code where we consider the highs and lows. AD fall implies transactional volume is in price declines, this reinforces bearish thesis.
The strengths of this pattern are that it catches starts of new trends by waiting for the gator to transition from sleeping to jaw opening. The volume confirmation via the AD filter helps eliminate false breakouts. When these two match up, follow through tends to be strong. This is partly exhibited in our report below that spans both training and testing periods as defined above.

Even though we have a flat to profitable forward walk, it is not entirely convincing. This therefore leads us to this pattern's weakness. Potentially this is in timing - the gator awakening can lag slightly, especially if the jaw/teeth/lips buffers cross only after the breakout bar closes. This is important because in very sharp breakouts such, as on news, these can register before the gator gets a chance to indicate green. Also, volume surges can be one-offs, such as in the low-liquidity late Asia sessions. In these situations, tick-volume spikes can be misleading.
Strong Trend Continuation (Gator “Eating” Phase + Sustained A/D Uptrend)
Our second pattern, pattern-1, has its bullish setup laid out in an established uptrend where the gator oscillator would be in eating mode with both the upper and lower histograms indicating green. This is a sign the jaw/teeth/lips lines are wide apart and therefore trending. With this backdrop, the AD would also be steadily ascending by showing consistent accumulation or buying volume, as price advances. A sustained AD rise does affirm the price uptrend is volume supported, since each push higher reflects significant participation. This healthy pairing signals a bullish trend that has sufficient runway. Traders can therefore use minor pauses to join the trend when volume metrics are positive. We implement this in MQL5 as follows:
//+------------------------------------------------------------------+
//| Check for Pattern 1.                                             |
//+------------------------------------------------------------------+
bool CSignalGator_AD::IsPattern_1(ENUM_POSITION_TYPE T)
{  if
   (
      clrGreen == Color_UP(m_gator, X() + 1) &&
      clrRed == Color_LO(m_gator, X() + 1) &&
      clrGreen == Color_UP(m_gator, X()) &&
      clrGreen == Color_LO(m_gator, X())
   )
   {  if
      (
         T == POSITION_TYPE_BUY &&
         Close(X() + 1) > Close(X() + 2) &&
         Close(X()) > Close(X() + 1) &&
         AD(X() + 1) > AD(X() + 2) &&
         AD(X()) > AD(X() + 1)
      )
      {  return(true);
      }
      else if
      (
         T == POSITION_TYPE_SELL &&
         Close(X() + 1) < Close(X() + 2) &&
         Close(X()) < Close(X() + 1) &&
         AD(X() + 1) < AD(X() + 2) &&
         AD(X()) < AD(X() + 1)
      )
      {  return(true);
      }
   }
   return(false);
}
The bearish counterpart would have a similar gator reading since this oscillator is direction neutral as already pointed out in the introduction. So, we are in an eating phase with both histograms being green while price action reflects a descent lower. A steadily falling AD line in tandem points to persistent distribution - with significant volume accompanying a selloff. With the gator confirming sustained trend momentum and AD indicating selling pressure, the downward trend would be intact. Testing this pattern with the input for patterns used assigned to 2 does give us the following report:

Our results indicate a more convincing walk than what we had with pattern-0. This could be down to this pattern’s strengths of leveraging trend-following with volume confirmation. Zeroing in on the eating phase identifies the sweet spot where ‘most money can be made’. The jaw/teeth/lips buffers are in their proper order and diverging strongly with clear directionality. Having AD in agreement brings confidence that the trend is not weakening internally, there is no visible divergence, and no significant loss of interest from big players. In forex, in particular, such alignment on the H1-H4 timeframes does signal reliable continuation. This is a pattern that allows traders to ride winners for relatively longer. A bearish chart representation of pattern-1 can appear as follows, for context:

Pullback Continuation Entry (Gator Dip “Filling Out” then resuming + A/D Holds Up)
Our next signal-pattern has its bullish setup defined within a price action uptrend, where temporary retracements or sideways pullbacks such as the bull flag are common. The gator oscillator thus reflects a brief weakening of the prevalent trend where one histogram may turn red while the other is still green, meaning the jaw/teeth/lips lines have started converging in a gator fill-out-stage. This can be due to a momentum pause. Crucially, in this pullback, the AD oscillator would be either flat or rising slightly, meaning there is no noteworthy distribution. In fact, in these dips, volume could be quietly accumulating.
We thus have a continuation pattern for bullish re-entry that should trigger when the gator oscillator flips back to green for both the upper and lower histograms. In addition, the AD should be close to or at recent highs, indicating that the bullish volume is still intact. We code this in MQL5 as follows:
//+------------------------------------------------------------------+
//| Check for Pattern 2.                                             |
//+------------------------------------------------------------------+
bool CSignalGator_AD::IsPattern_2(ENUM_POSITION_TYPE T)
{  if
   (
      clrRed == Color_UP(m_gator, X() + 1) &&
      clrGreen == Color_LO(m_gator, X() + 1) &&
      clrGreen == Color_UP(m_gator, X()) &&
      clrGreen == Color_LO(m_gator, X())
   )
   {  if
      (
         T == POSITION_TYPE_BUY &&
         High(X()) > High(X() + 1) &&
         Close(X()) <= Close(X() + 1) &&
         AD(X() + 1) > AD(X() + 2) &&
         AD(X()) > AD(X() + 1)
      )
      {  return(true);
      }
      else if
      (
         T == POSITION_TYPE_SELL &&
         Low(X()) < Low(X() + 1) &&
         Close(X()) >= Close(X() + 1) &&
         AD(X() + 1) < AD(X() + 2) &&
         AD(X()) < AD(X() + 1)
      )
      {  return(true);
      }
   }
   return(false);
}
The bearish mirrors what we have above, with price action clearly showing a downtrend. In this situation, the AD line would barely rise from its descent, showing a lack of true accumulation on the bounce. The bearish continuation entry is confirmed when, as we highlighted with the bullish pattern, all histograms turn green from a situation where one of them was red. Testing of pattern-2 gives us the following report:

We are able to forward walk profitably in a slightly more convincing fashion than the last 2 patterns, albeit without the proper risk measures an Expert Advisor would have in place. To recall, our testing is done with take profit targets and no stop losses, where the Expert Advisor’s close-threshold serves as the stop loss. And as always given the small test window extra diligence is required on the reader’s part before this pattern can be deployed. A chart display of this pattern for a bullish opening is as follows:

Volume Divergence Reversal (Price vs. A/D Divergence + Gator Trend Weakening)
Our fourth signal, pattern-3, has its bullish setup defined as a counter-trend reversal signal that happens when a downtrend shows signs of weakening and volume action hints at an incoming bullish swing. Usually, price will make a lower low, but the AD oscillator would make a higher low or begin rising against the price trend. This divergence that is bullish implies that despite prices falling, the volume buying is creeping in, and smart money may be accumulating at the lows.
The direction neutral, umbrella signal, of the gator oscillator, at this point may reflect a downtrend that is fading where for instance the bottom histograms that could have been green start to retreat by turning red. It is a gator fill-out stage, which means the jaw/teeth/lips lines are converging. In some instances, both the upper and bottom histograms can turn red. We implement this in MQL5 as follows:
//+------------------------------------------------------------------+
//| Check for Pattern 3.                                             |
//+------------------------------------------------------------------+
bool CSignalGator_AD::IsPattern_3(ENUM_POSITION_TYPE T)
{  if
   (
      clrRed == Color_UP(m_gator, X() + 1) &&
      clrRed == Color_LO(m_gator, X() + 1) &&
      clrRed == Color_UP(m_gator, X()) &&
      clrGreen == Color_LO(m_gator, X())
   )
   {  if
      (
         T == POSITION_TYPE_BUY &&
         Close(X()) - Low(X() + 1) > 0.5 * (High(X() + 1) - Low(X() + 1)) &&
         AD(X() + 2) > AD(X()) &&
         AD(X()) > AD(X() + 1)
      )
      {  return(true);
      }
      else if
      (
         T == POSITION_TYPE_SELL &&
         High(X() + 1) - Close(X()) > 0.5 * (High(X() + 1) - Low(X() + 1)) &&
         AD(X() + 2) < AD(X()) &&
         AD(X()) < AD(X() + 1)
      )
      {  return(true);
      }
   }
   return(false);
}
The bearish setup happens in an uptrend that is close to its exhaustion where price pushes to a higher high, but the AD line fails to make a new high or begins a decline, which signals a bearish volume divergence. Said differently, we would have diminishing accumulation or emerging distribution even as price gets to new peaks. At this stage, the gator oscillator will indicate that the uptrend’s bite is weakening. As with the afore mentioned bullish signal, the upper histogram that was green may flip red, or even both histograms could turn red in the interim.
This would be a sign of momentum loss as the jaw/teeth/lips are converging more. Base rules for this are that a price spike to a fresh high that is unconfirmed by AD would have the gator transition from the eating phase to the sated phase, and a bearish reversal signal is in play. As Bill Williams would put it ‘the Alligator is about to go back to sleep after being “full”, and the bears may take over’. Testing this pattern over the same periods as patterns 0 to 2 above gives us the following report;

Our pattern, struggles in the forward test and in the end it was unable to profitably forward walk. Its weaknesses stem from timing confirmation, which can be tricky. A divergence can persist for some time before a reversal happens or, as they say, ‘markets can stay divergent longer than one can stay solvent’. Because most traders, especially forex traders, use leverage, this is a very important point. While the gator might flash early indicative signs like one bar turning red, but this could be followed by the trend resuming briefly by say making a deeper price low and even the AD just flattening instead of rising. Such double bottom scenarios can whipsaw early entrants. Basically, no one divergence guarantees a reversal immediately, which is why might need additional confirmation of a price breaking a trend line or a crossover of the jaws/teeth/lips buffers.
In addition, in very strong trends volume divergences can sometimes fail outright - a situation where big trends have several small divergences before the final top bottom/top is formed. AD is cumulative as well, therefore after a long trend it may indicate divergence simply because it cannot keep rising at the same rate even though price could still make one or two more extremes. Therefore, relying only on the first divergence is bound to be risky. Moreover, news events can also invalidate divergence setups, for example if a bullish divergence is taking hold then a negative fundamental shock hits the wires, price can drop to new lows with volume in tow thus negating prior divergence.
Trend Exhaustion & Exit Signal (Gator “Sated” Phase + Volume Wanes)
We have a total of 10 signal patterns lined up for this indicator pairing as has been the case in previous articles, however for this particular article we will only look at the first five. Patterns 5 to 9 will be examined in the next article.
Therefore, for our final pattern for this article, pattern-4, the bullish setup is based on trend exhaustion. When in a prolonged downtrend, there comes a tipping point when the trend indicates signs of exhaustion as opposed to a sharp divergence reversal. The gator oscillator will then transition into what Bill Williams referred to as the ‘sated’ or ‘satisfied’ phase - a stage following the ‘eating’ phase in which the upper and lower histograms were green. Following this, though, one of the histograms would turn red. As already argued above, this tends to indicate that the jaws/teeth/lips are beginning to converge and that the downtrend momentum is fading. However, instead of an immediate divergence and reversal, the market simply stagnates or enters into a range, with the key thing here being that the downtrend is likely over or close to ending.
Concurrently, AD oscillator will typically flatten out or begin rising slightly, a signal that the heavy distribution has stopped - sellers are not the dominant player and that volume pressure is no longer strongly negative. Even though it is not a full bullish divergence, volume is yet to confirm further downside. For a trader holding short positions, this union of gator no longer expanding downward and volume no longer falling can be a solid exit signal. The bearish trend would have run out of steam, meaning aggressive traders can pre-position for the upturn in anticipation that accumulation will soon kick in as the market bottoms out. We implement this pattern in MQL5 as follows:
//+------------------------------------------------------------------+
//| Check for Pattern 4.                                             |
//+------------------------------------------------------------------+
bool CSignalGator_AD::IsPattern_4(ENUM_POSITION_TYPE T)
{  if
   (
      clrGreen == Color_UP(m_gator, X() + 1) &&
      clrRed == Color_LO(m_gator, X() + 1) &&
      clrRed == Color_UP(m_gator, X()) &&
      clrGreen == Color_LO(m_gator, X())
   )
   {  if
      (
         T == POSITION_TYPE_BUY &&
         Close(X()) > Close(X() + 1) &&
         Low(X() + 1) > Low(X()) &&
         AD(X()) > AD(X() + 1)
      )
      {  return(true);
      }
      else if
      (
         T == POSITION_TYPE_SELL &&
         Close(X()) < Close(X() + 1) &&
         High(X() + 1) < High(X()) &&
         AD(X()) < AD(X() + 1)
      )
      {  return(true);
      }
   }
   return(false);
}
The bearish formation also is based on a long trend exhaustion. Following an extended uptrend, the gator oscillator would get sated following its feast. Signalling this, as seen in the bullish signal, one of the histograms would flip from green to red, once again indicating that the jaws/teeth/lips buffers are getting more compressed. Price could still be near its highs, however whipsaw/sideways action would start to be evident - the gator’s appetite for price increases would be waning. Correspondingly, the AD might stop climbing or even ticking higher despite no large price drop being in play yet as a marker that buying volume has ebbed and buyers are no longer aggressively pushing the rally.
In the interim, reasons for this could be profit taking or simply buyer exhaustion. Traders can use this as a sell signal by preparing to go short, especially if additional indicators confirm this, since they would now know that the tide of volume and momentum would have turned against further price increases. Testing of this pattern give us this report:

We are able to stay flat in the forward period, which strictly speaking means our pattern has some potential, however it still falls short when compared to patterns 2 or 1. This signal pattern’s strengths are that unlike sharp divergence signals, this exhaustion is more about catching the end of a trend gracefully. This can be particularly useful for trade management since it helps in answering the question - ‘when do I exit my winning trade?’ The gator oscillator’s first red bar following a lengthy green run is a strong alert that things are changing.
When this is merged with the volume cues of the AD flattening, it becomes arguably clear that continuing to hold in the trend direction only provides diminishing returns. Trend strength and volume strength would be rolling over, a pattern that precedes a whipsawed market or a slow reversal. This affords traders enough time to react since it is less sudden than a quick snap back.
Conclusion
We have looked at the first 5 of our intended 10 signal patterns that can be generated from merging the gator oscillator and the accumulation/distribution oscillator. This indicator union unlocks richer, volume–aware signal detection that could improve both trend following and trade management. As highlighted, their interaction provides a multidimensional filter - helping to confirm momentum, spotting exhaustion early, and also avoiding false moves that trip up single-indicator trade systems.
However, no method is foolproof; signal timing, late entries and the quirks of volume data still require some active oversight. At its core, this indicator pairing, when used with the MQL5 wizard (a good reference for new readers) to assemble an Expert Advisor, can become a robust toolkit for systematic traders after more nuance than trend or volume alone have to offer. We cover patterns 5 to 9 in the next article.
| name | description |
|---|---|
| WZ-77.mq5 | Wizard assembled Expert Advisor whose header describes files included |
| SignalWZ_77.mqh | Custom Signal Calss file used in Wizard to assemble Expert Advisor |
Warning: All rights to these materials are reserved by MetaQuotes Ltd. Copying or reprinting of these materials in whole or in part is prohibited.
This article was written by a user of the site and reflects their personal views. MetaQuotes Ltd is not responsible for the accuracy of the information presented, nor for any consequences resulting from the use of the solutions, strategies or recommendations described.
- Free trading apps
- Over 8,000 signals for copying
- Economic news for exploring financial markets
You agree to website policy and terms of use
Thanks for the article! Which inputs were you using on GBPJPY in the M30 timeframe? I can't reproduce the outcome. Thanks in advance!
Hi @Stephen Njuki
Thanks for the article! Which inputs were you using on GBPJPY in the M30 timeframe? I can't reproduce the outcome. Thanks in advance!
The statement in the Article that references GBPJPY is:
"We are going to be training with the pair GBP JPY, on the 30-minute timeframe for the year 2023 with 2024 being a forward walk test year."