• Übersicht
  • Bewertungen (5)
  • Diskussion (8)
  • Neue Funktionen

Moving Average Trend Scanner MT4

5

40% off. Original price: $50


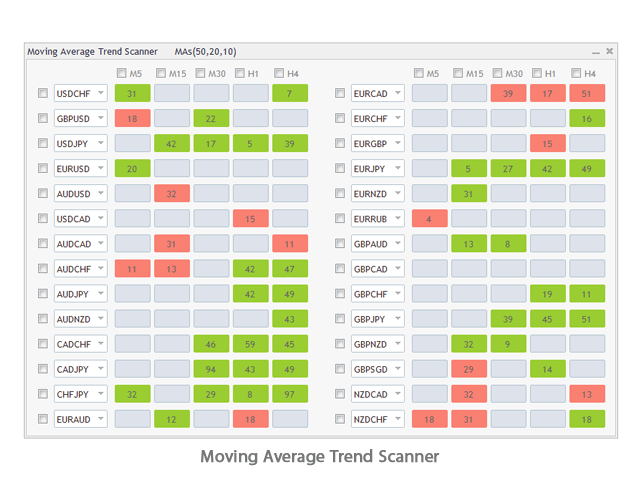
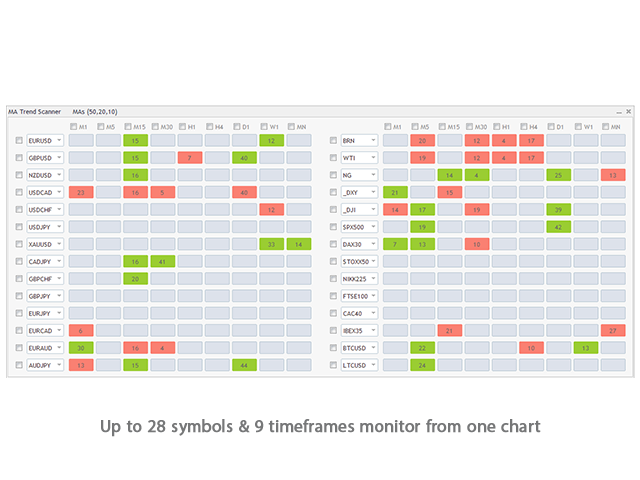
Moving Average Trend Scanner is a multi symbol multi timeframe triple MA crossover dashboard that helps traders to monitor, and identify potential market trends from one chart.

This panel scans 3 moving averages in up to 28 configurable instruments and 9 timeframes for triple moving average alignment and moving average crossover with a deep scan feature to scan all market watch symbols (up to 1000 instruments!).


Download Demo here (Scans only M1 and M5)

Settings description here

MT5 version here


After the purchase, don't forget to message me to receive a copy of the MT5 full version for 1 trading account as a bonus.


Moving Average Trend Scanner features:

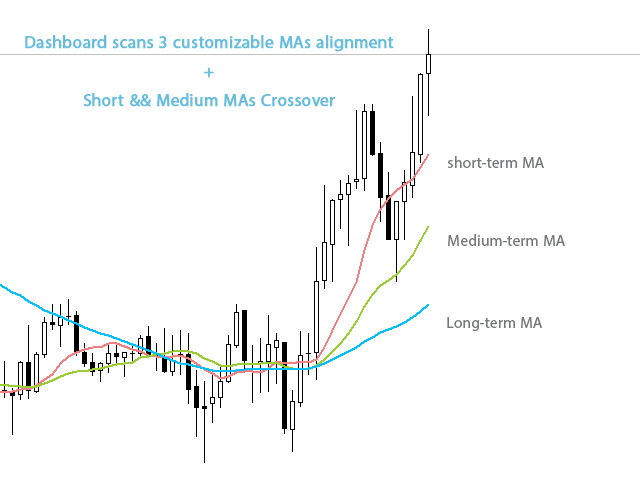
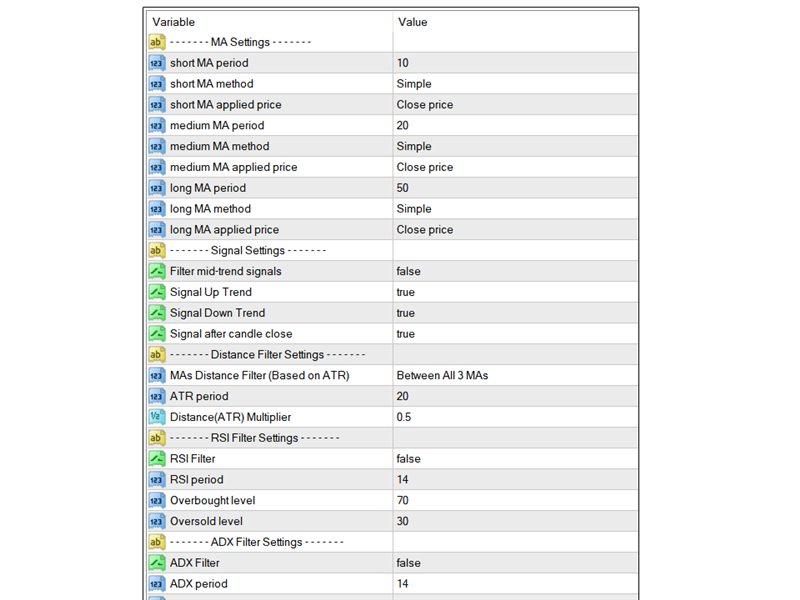
  • Customizable short-term, medium-term, and long-term MAs.
  • Works on all instruments such as currency pairs, CFD, metals, cryptocurrencies, etc.
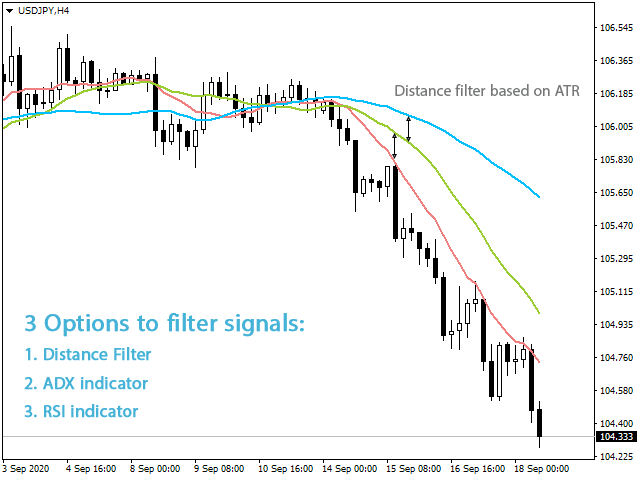
  • Option to filter signals based on a minimum distance between moving averages to avoid premature MAs alignment.
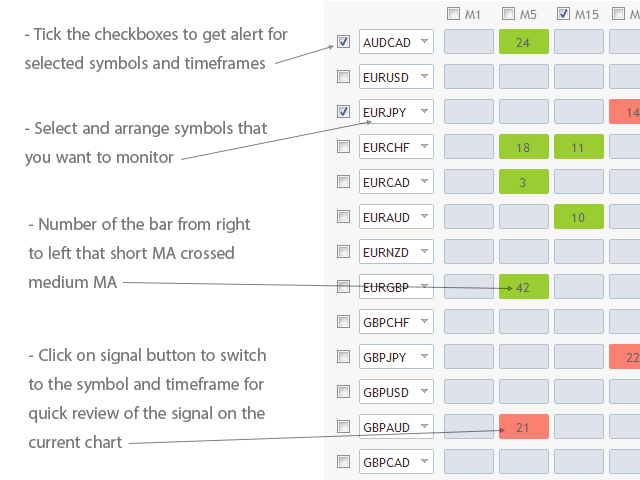
  • Option to show the number of the bar that short MA crossed medium MA on dashboard buttons.
  • Optional Filter of signals with RSI indicator overbought/oversold levels.
  • Optional Filter of signals with ADX indicator.
  • You can set different MA periods for different timeframes.
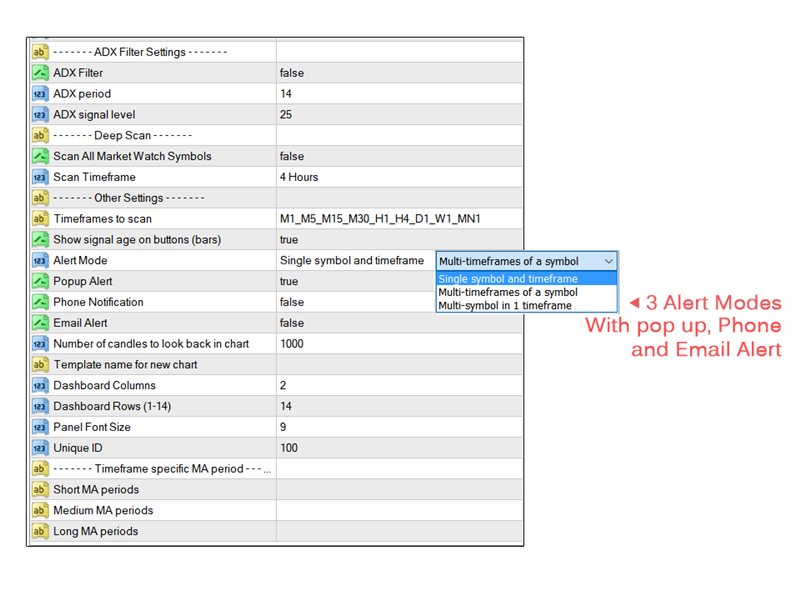
  • Deep Scan mode to scan all market watch symbols for MAs alignment in a chosen timeframe.
  • You can choose between 3 alert modes: 
  1. Single symbol and timeframe
  2. Multiple timeframes of a symbol
  3. Multiple symbols for a timeframe
      • Quick review of signals on the same chart by clicking on signal buttons.
      • Easy setup and arrange of symbols in any order with any instrument that your broker provides.
      • Popup, email, and phone notification alerts for selected symbols and timeframes.


      Some Notes:

      1. The moving average dashboard signals are based on 3 MAs alignment. Green color is for uptrend where short MA is above medium MA and medium MA is above long MA and red color for the downward alignment . Note that if you enable the distance or ADX filter, the dashboard might not give an immediate MA cross signal. 
      2. The signals of this moving average scanner (Green/Red colors) are not Buy/Sell signals. They indicate a potential market trend that should be checked. The classic trend following approach is to find a strong trend then look at lower timeframes for a pullback or breakout trade setup in the direction of the main trend. If you have a particular MA trading system you can set up the MA scanner accordingly to get buy/sell signals. 
      3. If you want 2 MAs setup, set the long MA period to zero.
      4. By default, the MA dashboard scans moving averages and doesn't consider the current price position relative to MAs. If you want that set the short MA period to '1' then it resembles the price.
      5. If you want to monitor more than 28 instruments you can load the indicator on another chart with different "Unique ID" in the settings and set different symbols for it.
      6. The symbols that you want to add to the dashboard must be visible in the MetaTrader market watch window. The first time you run the indicator or load a new symbol in the dashboard it might take a few seconds to update its data and show signals.


      If you are experienced at trading strong trends, you may want to try the Reward Multiplier tool.


      Bewertungen 5
      Kevin_alves
      100
      Kevin_alves 2024.05.26 16:16 
       

      Quality indicator, Very responsive and helpful seller!

      Oh-chan
      92
      Oh-chan 2023.07.29 11:02 
       

      I have to say, this indicator is absolutely fantastic! It does an incredible job of alerting me to trends that are gaining momentum, which is exactly what I need as a trend follower. Before using this indicator, I had no idea that the distances between the moving averages based on ATR could be so crucial in identifying strong trends with momentum. Thanks to this tool, my trading approach has been revolutionized. Thank you so much, Amir, for your exceptional work!

      Rich2017
      267
      Rich2017 2023.06.04 11:31 
       

      Very good indicator with excellent filters

      Empfohlene Produkte
      Introducing the "Extreme Exhaustion Levels": A powerful tool for traders looking to identify market exhaustion and potential trend reversals. The Exhaustion Indicator is an advanced technical analysis tool that helps traders identify when markets are overbought or oversold, potentially indicating an imminent reversal in the trend. With a unique combination of price action, moving averages, and Bollinger Bands, the Exhaustion Indicator provides traders with a comprehensive view of market condit
      SRP Pro
      Farhad Kia
      5 (1)
      Strong Retracement Points Pro edition! SRP (Strong Retracement/Reversal Points) is a powerful and unique support and resistance indicator. It displays the closest important levels which we expect the price retracement/reversal! If all level are broken from one side, it recalculates and draws new support and resistance levels, so the levels might be valid for several days depending on the market! If you are still hesitating to start using this wonderful tool, you can check this link to see how ef
      The SPV Cross indicator is based on the SPV  indicator. Works as two indicators together on the same chart. With different settings, you can react to the intersection of lines. Clearly reflects the cyclical nature of the market. Just two key settings! It works on the basis of the principle - one is fast and the other is slow. You can see the ups and downs of the indicator alternate and have such a relationship with the market, which can be used to draw conclusions to predict price behavior. The
      PABT Pattern Indicator - it's classical system one of the signal patterns. Indicator logic - the Hi & Lo of the bar is fully within the range of the preceding bar, look to trade them as pullback in trend. In the way if indicator found PABT pattern it's drawing two lines and arrow what showing trend way.  - First line - it's entry point and drawing at: 1. On the high of signal bar or on middle of the signal bar (depending from indicator mode) for buy; 2. On the low of signal bar or on middle of t
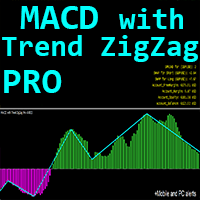
      Crypto_Forex Indikator „MACD mit Trend ZigZag Pro“ für MT4. – Der MACD-Indikator selbst ist eines der beliebtesten Tools für Trendhandel. – „MACD mit Trend ZigZag Pro“ eignet sich hervorragend für Price-Action-Einträge oder in Kombination mit anderen Indikatoren. – Verwenden Sie diesen Indikator, um die genauesten Einstiegssignale auszuwählen: – Liegt der MACD über 0 (grün) und die ZigZag-Linie zeigt nach oben – suchen Sie nur nach Price-Action-Mustern für Kaufkurse. – Liegt der MACD unter 0 (
      EZZ Elite Zig Zag is an indicator for the MetaTrader 4 terminal. This indicator traces the peak of the trend based on the market reversal, thus showing various opportunities in the financial market. EZZ Elite Zig Zag is a visual tool, intuitive, and easy to understand and use.  Test it Yourself by Downloading it for Free. Author Paulo Rocha all rights reserved
      G99 GRAVITY G99 Gravity is a channel indicator for the MetaTrader 4 terminal. This indicator allows finding the most probable trend reversal points. Unlike most channel indicators, G99 Gravity does not redraw. Attach the indicator to a chart, and the alert will trigger once a signal emerges. With our alerting system, you will never miss a single position opening signal! Advantages of the indicator Perfect for scalping. Excellent for identifying trend reversals. Suitable for beginners and exper
      Infinity Trend Pro
      Yaroslav Varankin
      1 (1)
      This is a trend indicator without redrawing Developed instead of the binary options strategy (by the color of the Martingale candlestick) Also works well in forex trading When to open trades (binary options) A signal will appear in the place with a candle signaling the current candle It is recommended to open a deal for one candle of the current timeframe M1 and M5 When a blue dot appears, open a deal up When a red dot appears, open a trade down. How to open trades on Forex. When a signal is rec
      Arriator
      Nadiya Mirosh
      The Arriator forex indicator algorithm allows you to quickly determine the current trend in the market. The Elephant indicator accompanies long-term trends and can be used without restrictions on instruments or timeframes. This indicator not only helps predict future values, but also generates buy and sell signals. It tracks market trends, ignoring wild swings and market noise around the average price. The indicator implements a type of technical analysis based on the idea of ​​market cyclicalit
      Trend Oscillator – ist ein erweiterter benutzerdefinierter Crypto_Forex-Indikator, ein effizientes Handelstool! - Es wird eine erweiterte neue Berechnungsmethode verwendet – 20 Optionen für den Parameter „Preis für Berechnung“. - Der sanfteste Oszillator, der je entwickelt wurde. - Grüne Farbe für Aufwärtstrends, Rote Farbe für Abwärtstrends. - Überverkaufte Werte: unter 5, überkaufte Werte: über 95. - Es gibt viele Möglichkeiten, selbst Standardstrategien mit diesem Indikator zu verbessern. -
      ATR Line MT4
      Evgeny Levchenko
      The indicator - "ATR Line" determines the current trend and gives signals to buy (green arrow to the top) or sell (red arrow to the bottom). The indicator calculation is based on the deviation of the average price of the instrument from its average true range - ATR. The moving average of prices is used to reduce "market noise". If the main line of the indicator - "ATR Line" is lower the instrument price chart, then the market is in a "bullish" trend. If the main line of the indicator is higher t
      Master Scalping M1 ist ein innovativer Indikator, der einen Algorithmus verwendet, um den Trend schnell und genau zu bestimmen. Der Indikator berechnet den Zeitpunkt zum Öffnen und Schließen von Positionen, die Indikatoralgorithmen ermöglichen es Ihnen, die idealen Zeitpunkte für den Einstieg in einen Handel (Kauf oder Verkauf eines Vermögenswerts) zu finden, was den Erfolg von Transaktionen für die meisten Händler erhöht. Vorteile des Indikators: Einfach zu bedienen, überladen Sie das Diagramm
      [ZhiBiCCI] Indikatoren sind für alle Zyklusanwendungen und auch für alle Marktsorten geeignet. [ZhiBiCCI] Die grüne durchgezogene Linie ist eine Umkehrung der bullischen Divergenz. Die grüne gestrichelte Linie ist eine klassische bullische Divergenz. [ZhiBiCCI] Die durchgehende Linie zum Rot ist eine umgekehrte bearishe Divergenz. Die rote gepunktete Linie ist eine klassische bearishe Divergenz. [ZhiBiCCI] kann in den Parametern (Alert, Mail senden, Benachrichtigung senden) eingestellt werden
      OFFER PRICE FROM 14-16TH AT JUST 100 DOLLARS GRAB IT Smart Set up leve l is a very powerful indicator based on the concept of order blocks and set up entries with proper fvg and breakouts to make a very nice level to enter like a pro trader. Very easy to use interface and friendly to enter on buy and sell signals. Works Best on M15 Time frame on Gold, Bitcoin and Fx pairs. Daily 4-5 trades on each pair  Works great on gold like a pro on M15 It is non repainting nor lagging It is very powerful in
      ADX arrow N
      Pavel Shutovskiy
      ADX arrow Dieser Indikator zeigt die Signale des ADX-Indikators (Average Directional Movement Index) als Punkte auf dem Chart an. Dies erleichtert die visuelle Identifizierung von Signalen. Der Indikator verfügt auch über Warnungen (Pop-up-Meldungsfelder) Push-und Senden von Signalen an E-Mail. Rahmenbedingungen Zeitraum - Mittelungszeitraum. Anwenden auf - Preis für Berechnungen verwendet: Schließen, Öffnen, Hoch, Niedrig, Median (hoch + niedrig) / 2, Typisch (hoch + niedrig + schließen)
      The indicator is designed for opening trades for a long period. he is set up to get as many points from each trade as possible. he uses the scalping method... you can trade on any currency pairs indicator is already  you can trade at any time of the day but the preferred time of trading during the European American session. currency pairs eur / jpy, eur / usd currency pairs with high volatility then the results are much better.
      "Scalper Channel MT4" is a modern channel indicator that shows the trader the direction of the trade. For work, the indicator uses built-in and proprietary technical means and a new secret formula. Load it on the chart and the indicator will show you the entry direction in color: If the upper limit of the price channel of the indicator is blue, open a buy position. If the lower limit of the price channel of the indicator is red, open a sell position. If the border of the indicator is gray, neut
      MetaCOT 2 is a set of indicators and specialized utilities for the analysis of the U.S. Commodity Futures Trading Commission reports. Thanks to the reports issued by the Commission, it is possible to analyze the size and direction of the positions of the major market participants, which brings the long-term price prediction accuracy to a new higher-quality level, inaccessible to most traders. These indicators, related to the fundamental analysis, can also be used as an effective long-term filter
      FXC iDeM-DivergencE MT4 Indicator This is an advanced DeMarker indicator that finds trend-turn divergences on the current symbol. The indicator detects divergence between the DeMarker and the price movements as a strong trend-turn pattern. Main features: Advanced divergence settings Price based on Close, Open or High/Low prices Give Buy/Sell open signals PUSH notifications E-mail sending Pop-up alert Customizeable Information panel Input parameters: DeM Period: The Period size of the DeMarker in
      The Extreme point indicator helps in determining the probable price reversal points on the chart. The indicator facilitates the search for points to enter the market with greater accuracy. The indicator displays certain impulses, after which there is a high probability of the price continuing its movement in the same direction. The indicator can be used in conjunction with other indicators for a more accurate detection of the position entry points. The indicator can also be used independently. F
      RaysFX MACD Divergence Presentiamo RaysFX MACD Divergence, un indicatore di trading avanzato progettato per i trader moderni. Questo indicatore utilizza la divergenza MACD, uno dei metodi più affidabili nel mondo del trading, per fornirti segnali di trading precisi e tempestivi. Caratteristiche principali: Divergenza MACD: L’indicatore identifica e traccia le divergenze MACD, fornendo segnali di trading potenzialmente redditizi. Personalizzabile: Puoi personalizzare i parametri dell’EMA veloce,
      FXC iMACD-DivergencE MT4 Indicator This is an advanced MACD indicator that finds trend-turn divergences on the current symbol. The indicator detects divergence between the MACD and the price movements as a strong trend-turn pattern. Main features: Advanced divergence settings Price based on Close, Open or High/Low prices Give Buy/Sell open signals PUSH notifications E-mail sending Pop-up alert Customizeable Information panel Input parameters: MACD Fast-EMA: The Fast-EMA variable of the MACD indi
      MACD Divergence
      Sergey Deev
      2.5 (2)
      The indicator detects divergence signals - the divergences between the price peaks and the MACD oscillator values. The signals are displayed as arrows in the additional window and are maintained by the messages in a pop-up window, e-mails and push-notifications. The conditions which formed the signal are displayed by lines on the chart and in the indicator window. Indicator Parameters MacdFast - fast MACD line period MacdSlow - slow MACD line period MacdSignal - MACD signal line period MacdPric
      Alpha Trend Zeichen ist seit langem ein sehr beliebtes Handelstool in unserem Unternehmen. Es kann unser Handelssystem überprüfen und Handelssignale klar anzeigen, und die Signale werden nicht driften. Hauptfunktionen: Anhand der Marktanzeige aktiver Bereiche können Indikatoren intuitiv bestimmen, ob der aktuelle Markttrend zu einem Trendmarkt oder zu einem volatilen Markt gehört. Und betreten Sie den Markt gemäß den Indikatorpfeilen, mit grünen Pfeilen für Kauf und roten Pfeilen für Verkauf
      Der Crypto_Forex-Indikator „Auto FIBO Pro“ ist ein großartiges Hilfsmittel beim Handel! - Der Indikator berechnet automatisch Fibo-Level und lokale Trendlinien (rote Farbe) und platziert sie im Diagramm. - Fibonacci-Level zeigen Schlüsselbereiche an, in denen der Preis umkehren kann. - Die wichtigsten Level sind 23,6 %, 38,2 %, 50 % und 61,8 %. - Sie können ihn für Reversal Scalping oder für Zone Grid Trading verwenden. - Es gibt auch viele Möglichkeiten, Ihr aktuelles System mit dem Auto FIBO
      The Context Aviation indicator analyzes the price behavior and if there is a temporary weakness in the trend, you can notice this from the indicator readings, as in the case of a pronounced change in the trend direction. It is not difficult to enter the market, but it is much more difficult to stay in it. The Context Aviation indicator makes it much easier to stay in trend! This indicator allows you to analyze historical data and, based on them, display instructions for the trader for further a
      This indicator is another variant of the famous powerful indicator Fibonacci-SS https://www.mql5.com/en/market/product/10136 but has different behaviour in placing Pending Order and TP Line. Automatically places Fibonacci retracement lines from the last highest and lowest visible bars on the chart with: An auto Pending Order (Buy/Sell). Taking Profit 1, Taking Profit 2 is pivot point and Taking Profit 3 for extended reward opportunity. The best risk and reward ratio. Simple and powerful indicat
      Description: The CCI Arrow Indicator is a powerful trading tool designed to offer clear buy and sell signals based on the Commodity Channel Index (CCI). Buffer 0 signifies the buy signal, while Buffer 1 represents the sell signal, providing a straightforward visual representation of market conditions. Users can easily install and apply the indicator to their MetaTrader platform, where arrows indicate potential entry and exit points, aiding in informed trading decisions. A green arrow (Buffer 0)
      The indicator detects and displays the AB=CD harmonic pattern on the chart according to the scheme provided in the screenshot. The pattern is plotted by the extreme values of the ZigZag indicator (included in the resources, does not require additional installation). After detecting the pattern, the indicator notifies of that by the pop-up window, a mobile notification and an email. The indicator highlights not only the complete figure, but also the time of its formation. During the formation the
      Käufer dieses Produkts erwarben auch
      Gann Made Easy
      Oleg Rodin
      4.8 (125)
      Gann Made Easy ist ein professionelles und einfach zu bedienendes Forex-Handelssystem, das auf den besten Handelsprinzipien unter Verwendung der Theorie von Mr. basiert. W.D. Gann. Der Indikator liefert genaue KAUF- und VERKAUFSsignale, einschließlich Stop-Loss- und Take-Profit-Levels. Mit PUSH-Benachrichtigungen können Sie auch unterwegs handeln. Bitte kontaktieren Sie mich nach dem Kauf! Ich werde meine Handelstipps und tolle Bonusindikatoren kostenlos mit Ihnen teilen! Wahrscheinlich haben Si
      Cycle Maestro
      Stefano Frisetti
      HANDEL mit CYCLEMAESTRO Das Signal ist einfach und unmittelbar: Sobald der Hintergrund eines Bereichs grün oder rot wird, bedeutet dies, dass ein Handelssignal aktiv ist: GRÜN = KAUFEN und ROT = VERKAUFEN. Der HÄNDLER kann den HANDEL eröffnen und den nächsten Anweisungen folgen.  HINWEIS: CYCLEMAESTRO wird nur über diese Website vertrieben, es gibt keine anderen Vertriebshändler. Die DEMO-Version dient nur als Referenz und wird nicht unterstützt. Die endgültige Version wird unterstützt und f
      Trend Screener
      STE S.S.COMPANY
      4.78 (93)
      Trendindikator, bahnbrechende, einzigartige Lösung für Trendhandel und -filterung mit allen wichtigen Trendfunktionen in einem Tool! Es handelt sich um einen 100 % nicht neu zu malenden Multi-Timeframe- und Multi-Währungs-Indikator, der für alle Symbole/Instrumente verwendet werden kann: Forex, Rohstoffe, Kryptowährungen, Indizes und Aktien. ZEITLICH BEGRENZTES ANGEBOT: Der Support- und Resistance-Screener-Indikator ist für nur 50 $ und lebenslang verfügbar. (Ursprünglicher Preis 250 $) (Angebot
      Scalper Inside PRO
      Alexey Minkov
      4.77 (65)
      !SPECIAL SALE! An exclusive indicator that utilizes an innovative algorithm to swiftly and accurately determine the market trend. The indicator automatically calculates opening, closing, and profit levels, providing detailed trading statistics. With these features, you can choose the most appropriate trading instrument for the current market conditions. Additionally, you can easily integrate your own arrow indicators into Scalper Inside Pro to quickly evaluate their statistics and profitability
      Gold Stuff
      Vasiliy Strukov
      4.87 (260)
      Gold Stuff-Ein Trendindikator, der speziell für Gold entwickelt wurde, kann auch auf allen Finanzinstrumenten verwendet werden. Der Indikator wird nicht neu gezeichnet und verzögert sich nicht. Empfohlener Zeitrahmen H1. Nach diesem Indikator geschrieben EA Gold Stuff Berater, können Sie es in meinem Profil finden. WICHTIG! Kontaktieren Sie mich sofort nach dem Kauf, um Anweisungen und Bonus zu erhalten!   Sie können eine kostenlose Kopie unseres Strong Support- und Trendscanner-Indikators er
      TPSproTREND PrO
      Roman Podpora
      4.68 (25)
      VERSION MT5        —        ИНСТРУКЦИЯ RUS           —        INSTRUCTIONS  ENG Hauptfunktionen: Präzise Eingangssignale OHNE RENDERING! Wenn ein Signal erscheint, bleibt es relevant! Dies ist ein wichtiger Unterschied zu Redraw-Indikatoren, die ein Signal liefern und es dann ändern können, was zu einem Verlust des eingezahlten Geldes führen kann. Jetzt können Sie mit größerer Wahrscheinlichkeit und Genauigkeit in den Markt eintreten. Es gibt auch eine Funktion zum Einfärben der Kerzen nach de
      Algo Pumping MT4
      Ihor Otkydach
      4.91 (11)
      PUMPING STATION – Ihre persönliche „All-inclusive“-Strategie Wir präsentieren Ihnen PUMPING STATION – einen revolutionären Forex-Indikator, der Ihr Trading in eine spannende und effektive Erfahrung verwandeln wird. Es handelt sich nicht nur um ein Hilfsmittel, sondern um ein vollwertiges Handelssystem mit leistungsstarken Algorithmen, die Ihnen helfen, stabiler zu traden. Beim Kauf dieses Produkts erhalten Sie KOSTENLOS: Exklusive Set-Dateien: Für automatische Einrichtung und maximale Leistung.
      PRO Renko System ist ein hochpräzises Handelssystem, das speziell für den Handel mit RENKO-Charts entwickelt wurde. Dies ist ein universelles System, das auf verschiedene Handelsinstrumente angewendet werden kann. Das System neutralisiert effektiv so genannte Marktgeräusche, die Ihnen Zugang zu genauen Umkehrsignalen geben. Der Indikator ist sehr einfach zu bedienen und hat nur einen Parameter, der für die Signalerzeugung verantwortlich ist. Sie können das Tool einfach an jedes Handelsinstrum
      Max Paynex
      Abdulkarim Karazon
      Max Payne ist ein Umkehr-/Trendsignalindikator, der Signale in Form eines Pfeils ausgibt. Dieser Indikator gibt sein Signal beim Schließen desselben Balkens aus. Dieser Indikator kann mehrmals mit unterschiedlichen Perioden auf dem Chart fallen, um eine doppelte/dreifache Bestätigung der Signale zu erhalten Der Indikator ist hochgradig anpassbar, um sich an jeden Handelsstil anzupassen, während er niemals neu lackiert oder rücklackiert wird. Sie erhalten nach dem Kauf das gesamte System, das in
      IQ Gold Gann Levels a non-repainting, precision tool designed exclusively for XAUUSD/Gold intraday trading. It uses W.D. Gann’s square root method to plot real-time support and resistance levels, helping traders spot high-probability entries with confidence and clarity. William Delbert Gann (W.D. Gann) was an exceptional market analyst, whose trading technique was based on a complex blend of mathematics, geometry, astrology, and ancient mathematics which proved to be extremely accurate. Download
      Volatility Trend System – ein Handelssystem, das Signale für Einstiege gibt. Das Volatilitätssystem liefert lineare und punktuelle Signale in Richtung des Trends sowie Signale zum Verlassen des Trends, ohne Neuzeichnung und Verzögerungen. Der Trendindikator überwacht die Richtung des mittelfristigen Trends, zeigt die Richtung und deren Änderung an. Der Signalindikator basiert auf Änderungen der Volatilität und zeigt Markteintritte an. Der Indikator ist mit mehreren Arten von Warnungen ausgestat
      TPSpro RFI Levels
      Roman Podpora
      4.85 (27)
      Umkehrzonen / Spitzenvolumina / Aktive Zonen eines Hauptakteurs =       TS TPSPROSYSTEM ANLEITUNG RUS       /       ANWEISUNGEN       ENG              /          Version MT5 Jeder Käufer dieses Indikators erhält zusätzlich KOSTENLOS: 6 Monate Zugriff auf Handelssignale vom Dienst RFI SIGNALS – vorgefertigte Einstiegspunkte gemäß dem TPSproSYSTEM-Algorithmus. Schulungsmaterialien mit regelmäßigen Updates – tauchen Sie in die Strategie ein und steigern Sie Ihr berufliches Niveau. 24/5-Support an
      Dynamic Forex28 Navigator
      Bernhard Schweigert
      5 (5)
      Dynamic Forex28 Navigator – Das Forex-Handelstool der nächsten Generation AKTUELL 49 % RABATT. Dynamic Forex28 Navigator ist die Weiterentwicklung unserer seit langem beliebten Indikatoren und vereint die Leistung von drei in einem: Advanced Currency Strength28 Indicator (695 Bewertungen) + Advanced Currency IMPULSE mit ALERT (520 Bewertungen) + CS28 Combo Signals (Bonus) Details zum Indikator https://www.mql5.com/en/blogs/post/758844 Was bietet der Strength Indicator der nächsten Generation?
      Enigmera
      Ivan Stefanov
      5 (7)
      ENIGMERA: Der Kern des Marktes Wichtig: Die MQL5.com-Demo wird im Strategy Tester ausgeführt und spiegelt möglicherweise nicht vollständig die Funktionalität von Enigmera wider. Überprüfen Sie die Beschreibung, Screenshots und das Video für Details. Zögern Sie nicht, mir bei Fragen eine Nachricht zu senden! Der Code des Indikators wurde vollständig neu geschrieben. Version 3.0 fügt neue Funktionen hinzu und behebt Fehler, die seit der Einführung des Indikators aufgetreten sind. Einführung Dies
      Currency Strength Exotics
      Bernhard Schweigert
      4.88 (32)
      Stärke von 8 Währungen plus EIN EXOTISCHES Paar oder Rohstoffe oder Indexe! Jedes Produkt kann als 9. Linie hinzugefügt werden. Fügen Sie Rohstoffe, Indexes oder exotische Währungen hinzu (Gold, Silber, Öl, DAX, US30, MXN, TRY, CNH ...). Eine neue noch nie dagewesene TRADING STRATEGIE  !!! Dieser Indikator ist einzigartig, weil wir eine Reihe von proprietäre Funktionen und neue Formeln eingebaut haben. Es funktioniert für alle Zeitrahmen. Basierend auf neuen zugrunde liegenden Algorithmen ist e
      Advanced Supply Demand
      Bernhard Schweigert
      4.91 (294)
      Derzeit 33% Rabatt! Die beste Lösung für jeden Anfänger oder erfahrenen Händler! Dieser Indikator ist ein einzigartiges, qualitativ hochwertiges und erschwingliches Trading-Tool, da wir eine Reihe von proprietären Funktionen und eine neue Formel integriert haben. Mit diesem Update werden Sie in der Lage sein, doppelte Zeitrahmenzonen anzuzeigen. Sie können nicht nur einen höheren TF (Zeitrahmen) anzeigen, sondern sowohl den Chart-TF als auch den höheren TF: SHOWING NESTED ZONES. Alle Supply Dema
      Supply and Demand Dashboard PRO
      Bernhard Schweigert
      4.8 (20)
      Derzeit 20% reduziert! Dieses Dashboard ist eine sehr leistungsfähige Software, die mit mehreren Symbolen und bis zu 9 Zeitrahmen arbeitet. Es basiert auf unserem Hauptindikator (Beste Bewertungen: Advanced Supply Demand ).   Das Dashboard gibt einen guten Überblick. Es zeigt: Gefilterte Angebots- und Nachfragewerte einschließlich der Zonenstärkebewertung, Pips-Abstände zu/und innerhalb von Zonen, Es hebt verschachtelte Zonen hervor, Es gibt 4 Arten von Alarmen für die gewählten Symbole in al
      Trend Arrow Super
      Aleksandr Makarov
      5 (2)
      Special offer! https://www.mql5.com/ru/users/bossik2810 Trend Arrow Super The indicator not repaint or change its data. A professional, yet very easy to use Forex system. The indicator gives accurate BUY\SELL signals. Trend Arrow Super is very easy to use, you just need to attach it to the chart and follow simple trading recommendations. Buy signal: Arrow + Histogram in green color, enter immediately on the market to buy. Sell signal: Arrow + Histogram of red color, enter immediately on the m
      FX Volume
      Daniel Stein
      4.6 (35)
      FX Volume: Erleben Sie den echten Marktüberblick aus der Sicht eines Brokers Kurzüberblick Möchten Sie Ihre Handelsstrategie auf das nächste Level bringen? FX Volume liefert Ihnen Echtzeit-Einblicke in die Positionierung von Retail-Tradern und Brokern — lange bevor verzögerte Berichte wie der COT verfügbar sind. Ob Sie nach beständigen Gewinnen streben oder einfach einen tieferen Vorteil am Markt suchen, FX Volume hilft Ihnen, große Ungleichgewichte zu erkennen, Breakouts zu bestätigen und Ihr
      Beast Super Signal
      Dustin Vlok
      4.73 (89)
      Suchen Sie nach einem leistungsstarken Indikator für den Devisenhandel, der Ihnen dabei helfen kann, profitable Handelsmöglichkeiten mit Leichtigkeit zu erkennen? Suchen Sie nicht weiter als das Beast Super Signal. Dieser benutzerfreundliche trendbasierte Indikator überwacht kontinuierlich die Marktbedingungen, sucht nach neuen sich entwickelnden Trends oder springt auf bestehende Trends ein. Das Beast Super Signal gibt ein Kauf- oder Verkaufssignal, wenn alle internen Strategien aufeinander ab
      Scalper Vault
      Oleg Rodin
      5 (31)
      Scalper Vault ist ein professionelles Scalping-System, das Ihnen alles bietet, was Sie für erfolgreiches Scalping benötigen. Dieser Indikator ist ein komplettes Handelssystem, das von Forex- und Binäroptionshändlern verwendet werden kann. Der empfohlene Zeitrahmen ist M5. Das System liefert Ihnen genaue Pfeilsignale in Richtung des Trends. Es liefert Ihnen auch Top- und Bottom-Signale und Gann-Marktniveaus. Die Indikatoren bieten alle Arten von Warnungen, einschließlich PUSH-Benachrichtigungen.
      M1 Arrow
      Oleg Rodin
      5 (17)
      Eine Intraday-Strategie, die auf zwei Grundprinzipien des Marktes basiert. Der Algorithmus basiert auf der Analyse von Volumina und Preiswellen mit zusätzlichen Filtern. Der intelligente Algorithmus des Indikators gibt nur dann ein Signal, wenn sich zwei Marktfaktoren zu einem vereinen. Der Indikator berechnet Wellen eines bestimmten Bereichs auf dem M1-Diagramm unter Verwendung der Daten des höheren Zeitrahmens. Und um die Welle zu bestätigen, verwendet der Indikator eine Volumenanalyse. Dieser
      FX Power MT4 NG
      Daniel Stein
      4.94 (18)
      FX Power: Analysieren Sie die Stärke von Währungen für intelligentere Handelsentscheidungen Übersicht FX Power ist Ihr unverzichtbares Werkzeug, um die tatsächliche Stärke von Währungen und Gold unter allen Marktbedingungen zu verstehen. Indem Sie starke Währungen kaufen und schwache verkaufen, vereinfacht FX Power Ihre Handelsentscheidungen und deckt Chancen mit hoher Wahrscheinlichkeit auf. Ob Sie Trends folgen oder extreme Delta-Werte nutzen, um Umkehrungen zu prognostizieren, dieses Tool p
      Special offer : ALL TOOLS , just $35 each! New tools   will be   $30   for the   first week   or the   first 3 purchases !  Trading Tools Channel on MQL5 : Join my MQL5 channel to update the latest news from me Entfesseln Sie die Kraft des Inversion Fair Value Gap (IFVG) -Konzepts von ICT mit dem Inversion Fair Value Gaps Indicator ! Dieses hochmoderne Tool hebt Fair Value Gaps (FVGs) auf die nächste Ebene, indem es umgekehrte FVG-Zonen identifiziert und anzeigt – wichtige Unterstützungs- und W
      Stratos Pali
      Michela Russo
      5 (3)
      Stratos Pali Indicator   is a revolutionary tool designed to enhance your trading strategy by accurately identifying market trends. This sophisticated indicator uses a unique algorithm to generate a complete histogram, which records when the trend is Long or Short. When a trend reversal occurs, an arrow appears, indicating the new direction of the trend. Important Information Revealed Leave a review and contact me via mql5 message to receive My Top 5 set files for Stratos Pali at no cost! Dow
      Trend Line Map Pro
      STE S.S.COMPANY
      4.47 (15)
      Trend Line Map Indicator ist ein Add-On für Trend Screener Indicator . Es arbeitet als Scanner für alle Signale, die vom Trendscreener (Trendliniensignale) erzeugt werden. Es ist ein Trend Line Scanner basierend auf dem Trend Screener Indicator. Wenn Sie keinen Trend Screener Pro Indicator haben, funktioniert die Trend Line Map Pro nicht. Wenn Sie auf unseren MQL5-Blog zugreifen, können Sie die kostenlose Version des Trend Line Map-Indikators herunterladen. Probieren Sie es aus, bevor Sie e
      This indicator works on MT4 and is very easy to use. When you receive a signal from it, you wait for that candle with the signal to close and you enter your trade at the beginning of the next new candle . A red arrow means sell and a green arrow means buy. All arrows comes with Alert  like for easy identification of trade signal. Are you okay with that? 1 minute candle 1 minute expire
      Support Resistance screnner
      STE S.S.COMPANY
      4.94 (36)
      Support And Resistance Screener ist ein Level-Indikator für MetaTrader, der mehrere Tools innerhalb eines Indikators bietet. Die verfügbaren Werkzeuge sind: 1. Marktstruktur-Screener. 2. Bullische Pullback-Zone. 3. Bärische Pullback-Zone. 4. Tägliche Pivot-Punkte 5. wöchentliche Pivots-Punkte 6. monatliche Pivots-Punkte 7. Starke Unterstützung und Widerstand basierend auf harmonischem Muster und Volumen. 8. Zonen auf Bankebene. ZEITLICH BEGRENZTES ANGEBOT: HV Support and Resistance Indicator ist
      Lux Trend
      Mohamed Hassan
      5 (4)
      After purchase, please contact me to get your trading tips + more information for a great bonus!   Lux Trend is a professional strategy based on using Higher Highs and Lower Highs to identify and draw Trendline Breakouts! Lux Trend  utilizes two Moving Averages to confirm the overall trend direction before scanning the market for high-quality breakout opportunities, ensuring more accurate and reliable trade signals. This is a proven trading system used by real traders worldwide, demonstrating
      FX Dynamic: Volatilität und Trends mit anpassbarer ATR-Analyse im Blick Übersicht FX Dynamic ist ein leistungsstarkes Tool, das die Berechnungen des Average True Range (ATR) nutzt, um Tradern unübertroffene Einblicke in die tägliche und intraday-Volatilität zu geben. Durch das Festlegen klarer Volatilitätsschwellen — beispielsweise 80%, 100% und 130% — kannst du schnell potenzielle Gewinnchancen erkennen oder Warnungen erhalten, wenn der Markt seine üblichen Spannen überschreitet. FX Dynamic p
      Weitere Produkte dieses Autors
      RSI Divergence Scanner is a multi-timeframe and multi-symbol dashboard and alert that checks all timeframes and symbols to find divergences between price chart and RSI indicator. This divergence scanner is integrated with support and resistance zones so you can check the RSI divergences in the most important areas of the chart to find trend reversals in the price chart. Download demo version   (works on M 1,M5,M30,W1 timeframes) Full description of scanner parameters ->   click here . How to get
      RSI Divergence Scanner ist ein Multi-Timeframe- und Multi-Symbol-Dashboard, das alle Timeframes und Symbole überprüft, um regelmäßige und versteckte Divergenzen zwischen Preisdiagramm und RSI-Indikator zu finden. Dieser Divergenz-Scanner ist mit Unterstützungs- und Widerstandszonen integriert, so dass Sie die RSI-Divergenzen in den wichtigsten Bereichen des Charts überprüfen können, um Trendumkehrungen im Preisdiagramm zu finden. Demo-Version herunterladen ( funktioniert auf M4,M5,M6,M12,H3,H8 Z
      Candlestick Pattern Scanner ist ein Dashboard- und Alarmsystem für mehrere Zeitrahmen und Symbole, das alle Zeitrahmen und Währungspaare auf verschiedene Candlestick-Muster überprüft, die sich in ihnen bilden. Der Scanner ist mit Unterstützungs- und Widerstandszonen integriert , so dass Sie die Candlestick-Muster in den wichtigsten Bereichen des Charts überprüfen können, um Ausbruchs- und Umkehrmuster im Preisdiagramm zu finden. Laden Sie die Demoversion herunter ( funktioniert in den Zeitrahmen
      Der RSI-Divergenz-Indikator findet Divergenzen zwischen dem Kurschart und dem RSI-Indikator und informiert Sie mit Warnungen (Popup, mobile Benachrichtigung oder E-Mail). Seine Hauptaufgabe besteht darin, Trendumkehrungen im Chart zu finden. Verwenden Sie die Divergenz-Indikatoren immer zusammen mit anderen technischen Hilfsmitteln wie Unterstützungs- und Widerstandszonen, Candlestick-Mustern und Preisaktionen, um eine höhere Wahrscheinlichkeit zu haben, Trendumkehrungen zu finden. Drei Bestätig
      FREE
      50% Rabatt. Ursprünglicher Preis: $60 Triangle Finder ist ein Multisymbol-Multi-Zeitrahmen-Dashboard, das symmetrische Dreiecksmuster in 28 Symbolen und 9 Zeitrahmen mit einer Tiefenscan-Funktion findet, um alle Marktbeobachtungssymbole zu scannen (bis zu 1000 Instrumente!). Demo hier herunterladen (Scannt nur M1, M5 und M10) Beschreibung der Einstellungen hier MT4-Version hier Triangle Finder Eigenschaften: Echtzeitüberwachung von 28 anpassbaren Instrumenten und 9 Timeframes zur gleichen Zei
      Der MACD-Divergenz-Indikator findet Divergenzen zwischen dem Kurschart und dem MACD-Indikator und informiert Sie mit Warnungen (Popup, mobile Benachrichtigung oder E-Mail) . Seine Hauptaufgabe besteht darin, Trendumkehrungen im Chart zu finden. Verwenden Sie die Divergenzindikatoren immer zusammen mit anderen technischen Hilfsmitteln wie Unterstützungs- und Widerstandszonen, Candlestick-Mustern und Preisaktionen, um eine höhere Wahrscheinlichkeit zu haben, Trendumkehrungen zu finden. Drei Bestät
      FREE
      40% Rabatt. Ursprünglicher Preis: $50 Moving Average Trend Scanner ist ein Multi-Symbol-Multi-Zeitrahmen-Triple-MA-Crossover-Dashboard, das Händlern hilft, potenzielle Markttrends von einem Chart aus zu überwachen und zu identifizieren. Dieses Panel scannt 3 gleitende Durchschnitte in bis zu 28 konfigurierbaren Instrumenten und 9 Zeitrahmen für dreifache gleitende Durchschnittsausrichtung und gleitenden Durchschnitts-Crossover mit einer tiefen Scan-Funktion, um alle Marktbeobachtungssymbole zu
      40% Rabatt. Ursprünglicher Preis: $50 Ichimoku Trend Finder ist ein Multi-Symbol-Multi-Timeframe-Trend-Dashboard, das Händlern hilft, potenzielle Markttrends von einem Chart aus zu überwachen und zu identifizieren. Dieses Panel scannt den Ichimoku Kinko Hyo-Indikator in 28 konfigurierbaren Instrumenten und 9 Zeitrahmen für klassische Ichimoku-Trendsignale mit einer Tiefenscan-Funktion, um alle Marktbeobachtungssymbole zu scannen (bis zu 1000 Instrumente!) . Demo hier herunterladen (Scannt nur
      Candlestick Pattern Scanner is a multi-timeframe and multi-symbol dashboard and alert system that checks all timeframes and currency pairs for different candlestick patterns that are formed in them. Scanner is integrated with support and resistance zones so you can check the candlestick patterns in the most important areas of the chart to find breakout and reversal patterns in the price chart. Download demo version   (works on M30,D1,W1 timeframes and 20 symbols of Market Watch window) Read the
      RSI divergence indicator finds divergences between price chart and RSI   indicator and informs you with alerts (popup, mobile notification or email). Its main use is to find trend reversals in the chart. Always use the divergence indicators with other technical assets like support resistance zones, candlestick patterns and price action to have a higher possibility to find trend reversals. Three confirmation type for RSI   divergences: RSI   line cross 50 level (doesn't repaint) Price returns to
      FREE
      Ichimoku Trend Alert ist der Ichimoku Kinko Hyo Indikator mit Alerts und Signalfiltern. Ichimoku Trend Alert Funktionen: Optionale Überprüfung von Ichimoku-Wolke, Tenkan sen (Umkehrlinie), Kijun sen (Basislinie), Senkou-Spanne A, Senkou-Spanne B und Chikou-Spanne relativ zum Preis und mehr. Popup-, E-Mail- und Telefon-Benachrichtigungen für ausgewählte Symbole und Zeitrahmen. Es gibt 9 klassische Ichimoku-Trendfilter, die Sie in den Einstellungen aktivieren/deaktivieren können : Price/Cloud Or
      FREE
      50% Rabatt. Ursprünglicher Preis: $60 Order Manager ist ein Handelsassistent und Handelskopierer mit einem Money Manager, der Händlern hilft, manuelle Trades zu eröffnen, zu ändern und zu schließen und auch ihre Trades zwischen mehreren Konten auf die einfachste Art und Weise zu kopieren, um ihnen zu helfen, sich mehr auf ihre Marktanalyse zu konzentrieren und Aufträge mit nur wenigen Klicks zu eröffnen. Demo hier herunterladen (Es funktioniert nur auf Demo-Konten für 14 Tage) Vollständiger Le
      Der MACD Divergence Scanner ist ein Dashboard mit mehreren Zeitrahmen und Symbolen, das alle Zeitrahmen und Symbole überprüft, um regelmäßige und versteckte Divergenzen zwischen dem Preisdiagramm und dem MACD-Indikator zu finden. Dieser Divergenz-Scanner ist mit Unterstützungs- und Widerstandszonen integriert , so dass Sie die MACD-Divergenzen in den wichtigsten Bereichen des Charts überprüfen können, um Trendumkehrungen im Kurschart zu finden. Demo-Version herunterladen ( funktioniert auf den Z
      Order Manager MT4
      Amir Atif
      3.67 (3)
      50% off. Original price: $60 Order Manager is a trade assistant and trade copier with a money manager that helps traders open, modify and close manual trades and also copy their trades between multiple accounts in the most simple way to help them focus more on their market analysis and open orders with just a few clicks. Download Demo here  (It only works on demo accounts) Full guide   here MT5 version here Order Manager features: Works on all instruments such as currency pairs, indexes, CFDs
      Moving Average Trend Alert ist ein dreifacher MA-Indikator, der Händlern hilft, potenzielle Markttrends auf der Grundlage der Ausrichtung und Überkreuzung von 3 MAs zu erkennen. Merkmale von Moving Average Trend Alert: Anpassbare kurzfristige, mittelfristige und langfristige MAs. Option zum Filtern von Signalen basierend auf einem Mindestabstand zwischen gleitenden Durchschnitten, um eine vorzeitige Ausrichtung der MAs zu vermeiden. Optionale Filterung von Signalen mit dem RSI-Indikator für übe
      FREE
      50% Rabatt. Ursprünglicher Preis: $375 Reward Multiplier ist ein halbautomatischer Handelsmanager, der auf dem Pyramidenhandel basiert und zusätzliche Orders mit dem laufenden Gewinn Ihrer Trades eröffnet, um den Ertrag exponentiell zu maximieren, ohne das Risiko zu erhöhen. Im Gegensatz zu anderen ähnlichen EAs zeigt dieses Tool den potenziellen Gewinn/Verlust und das Verhältnis von Belohnung und Risiko an, noch bevor Sie den ersten Handel eingehen! Demo hier herunterladen (Startlot ist auf 0.
      MACD divergence indicator finds divergences between price chart and MACD indicator and informs you with alerts (popup, mobile notification or email). Its main use is to find trend reversals in the chart. Always use the divergence indicators with other technical assets like support resistance zones, candlestick patterns and price action to have a higher possibility to find trend reversals. Three confirmation type for MACD divergences: MACD line cross zero level Price returns to previous H/L Creat
      FREE
      50% Rabatt. Ursprünglicher Preis: $60 Unterstützung und Widerstand Zonen Indikator für MT5 ist ein Multi-Timeframe-Panel und Warnung, die Unterstützung und Widerstand Zonen und Pivot-Punkte für alle Timeframes von MetaTrader 5 findet und gibt Alarm, wenn der Preis hat Interaktion mit ihnen. Demo-Version herunterladen (funktioniert mit den Symbolen GBPUSD, EURJPY und NZDUSD) Lesen Sie die vollständige Beschreibung der Scanner-Parameter auf der Blog-Seite . Viele einzigartige Funktionen in einem
      50% off. Original price: $60 Triangle Finder is a multi symbol multi timeframe dashboard that monitors and finds symmetrical triangle pattern in 28 symbols and 9 timeframes with a deep scan feature to scan all market watch symbols (up to 1000 instruments!). Download Demo here  (Scans only M1 and M5) Settings description   here MT5 version   here Triangle Finder features: Realtime monitoring of 28 customizable instruments and 9 timeframes at the same time. Deep scan mode to scan all market wat
      25% Rabatt. Ursprünglicher Preis: $40 RSI Scanner ist ein RSI-Dashboard mit mehreren Symbolen und Zeitrahmen, das den Relative Strength Index-Indikator auf überkaufte und überverkaufte Kurse in bis zu 28 Symbolen und 9 Zeitrahmen überwacht. Demo hier herunterladen (Scannt nur M1, M5 und M10) Beschreibung der Einstellungen hier MT4-Version hier RSI Scanner Eigenschaften: Signalisiert, wenn der RSI in die überkaufte und überverkaufte Zone eintritt oder diese verlässt. Überwacht 28 anpassbare In
      Advanced Indicator Scanner is a multi-symbol multi-timeframe scanner that works with hundreds of custom indicators available across the web including mql5 website market and codebase indicators. Advanced Indicator Scanner features: Scans your indicator in 28 customizable instruments and 9 timeframes. Monitors up to 2 lines(buffers) of an indicator. Showing of indicator value on buttons. You can choose between 3 alert modes:  Single symbol and timeframe Multiple timeframes of a symbol Multiple
      Ichimoku Trend Alert is the Ichimoku Kinko Hyo indicator with Alerts and signal filters. Ichimoku Trend Alert features: Optional check of Ichimoku cloud, Tenkan sen(Conversion Line), Kijun sen(Base Line), Senkou span A, Senkou span B, and Chikou span relative to price, and more. Popup, email, and phone notification alerts for selected symbols and timeframes. There are 9 classic Ichimoku trend filters you can enable/disable in settings: Price/Cloud Order: Checks the price position relative to t
      FREE
      Moving Average Trend Alert is a triple MA indicator that helps traders to identify potential market trends based on 3 MAs alignment and crossover. Moving Average Trend Alert features: Customizable short-term, medium-term, and long-term MAs. Option to filter signals based on a minimum distance between moving averages to avoid premature MAs alignment. Optional Filter of signals with RSI indicator overbought/oversold levels. Optional Filter of signals with ADX indicator. Popup, email, and phone no
      FREE
      50% off. Original price: $60 Support and Resistance zones indicator for MT4 is a multi-timeframe panel and alert that finds support and resistance zones and pivot points for all timeframes of MetaTrader 4 and gives alert when price has interaction with them. Download demo version (works on GBPUSD, EURJPY and NZDUSD symbols) Read the full description of scanner parameters in the blog page . Many unique features in one indicator: Integrating support and resistance zones and pivot points in one i
      Reward Multiplier ist ein halbautomatischer Handelsmanager, der auf dem Pyramidenhandel basiert und zusätzliche Orders mit dem laufenden Gewinn Ihrer Trades eröffnet, um die Rendite exponentiell zu maximieren, ohne das Risiko zu erhöhen - im Gegensatz zu anderen ähnlichen EAs zeigt dieses Tool den potenziellen Gewinn/Verlust und das Verhältnis von Belohnung und Risiko an, noch bevor Sie den ersten Trade eingehen! Laden Sie die Vollversion hier herunter (In der Miniversion. Das Startlot ist auf 0
      FREE
      Advanced Indicator Scanner ist ein Multi-Symbol-Multi-Timeframe-Scanner, der mit Hunderten von benutzerdefinierten Indikatoren arbeitet, die im Internet verfügbar sind, einschließlich mql5-Website-Markt- und Codebase-Indikatoren. Advanced Indicator Scanner Funktionen: Scannt Ihren Indikator in 28 anpassbaren Instrumenten und 9 Timeframes. Überwacht bis zu 2 Zeilen (Puffer) eines Indikators. Anzeige des Indikatorwertes auf Schaltflächen. Sie können zwischen 3 Alarmmodi wählen: Einzelnes Symbol
      Reward Multiplier is a semi-automatic trade manager based on pyramid trading that opens additional orders with the running profit of your trades to maximize return exponentially without increasing the risk. Unlike other similar EAs, this tool shows potential profit/loss and reward to risk ratio before even entering the first trade! Download full version here  ( In the mini version. Starting lot is fixed at 0.01 (or minimum allowed lot size ) Guide + tips here MT5 version   here You only open the
      FREE
      40% Rabatt. Ursprünglicher Preis: $50 Advanced Bollinger Bands Scanner ist ein Multi-Symbol Multi Timeframe Bollinger Bands Dashboard, das den Bollinger Bands Indikator von einem Chart aus überwacht und analysiert. Dieses Panel scannt den Bollinger Bands Indikator in bis zu 28 konfigurierbaren Instrumenten und 9 Zeitrahmen auf überkaufte/überverkaufte Preise, Preiskonsolidierung (Bollinger Bands Squeeze) und Konsolidierungsausbruch (Squeeze Break) mit einer Tiefenscan-Funktion, um alle Marktbe
      40% off. Original price: $50 Ichimoku Trend Finder is a multi symbol multi timeframe trend dashboard that helps traders to monitor and identify potential market trends from one chart. This panel scans the Ichimoku Kinko Hyo indicator in 28 configurable instruments and 9 timeframes for classic Ichimoku trend signals  with a deep scan feature to scan all market watch symbols (up to 1000 instruments!).    Download Demo here  (Scans only M1 and M5) Settings description   here MT5 version   here
      40% Rabatt. Ursprünglicher Preis: $50 Support and Resistance Dashboard für MT5 ist ein Multi-Timeframe- und Multi-Symbol-Scanner und Alarmsystem, das S/R-Zonen und Pivot-Punkte für alle Timeframes und Symbole findet und Alarm schlägt, wenn der Preis mit ihnen interagiert. Wenn Sie Unterstützungs- und Widerstandszonen (oder Angebot und Nachfrage) in Ihrer Handelsstrategie verwenden, ist dieses Dashboard und sein Warn- und Filtersystem eine große Zeitersparnis für Sie. Demo-Version herunterladen
      Auswahl:
      Kevin_alves
      100
      Kevin_alves 2024.05.26 16:16 
       

      Quality indicator, Very responsive and helpful seller!

      itakhola
      406
      itakhola 2023.12.05 15:00 
       

      Good indicator

      Oh-chan
      92
      Oh-chan 2023.07.29 11:02 
       

      I have to say, this indicator is absolutely fantastic! It does an incredible job of alerting me to trends that are gaining momentum, which is exactly what I need as a trend follower. Before using this indicator, I had no idea that the distances between the moving averages based on ATR could be so crucial in identifying strong trends with momentum. Thanks to this tool, my trading approach has been revolutionized. Thank you so much, Amir, for your exceptional work!

      Rich2017
      267
      Rich2017 2023.06.04 11:31 
       

      Very good indicator with excellent filters

      Behzad Mohebali
      81
      Behzad Mohebali 2022.11.27 06:33 
       

      An excellent and efficient tool Along with a professional and committed developer.

      Hoping to add more features to this tool.

      good luck

      Antwort auf eine Rezension
      Version 6.0 2025.01.29
      - New filter added: MACD filter.
      - Now you can type the name of symbols you want to scan in the indicator settings.
      - An option to change the color of the symbols was added.
      - Minor bugs fixed.
      Version 5.0 2023.09.21
      - Alert system upgraded: 2 new alert modes added:
      1. Multi-timeframe alert for a symbol
      2. Multi-symbol alert in a timeframe

      - Minor bugs fixed.
      Version 4.0 2023.06.13
      - New option in the settings to choose different MA periods for different timeframes.
      Version 3.1 2023.04.06
      - Minor bug fixed.
      Version 3.0 2023.02.01
      - Now the scanner also loads the MAs on the chart with arrows, so you can check the signals on the history of a chart.
      - New option: "Filter mid-trend signals" added to the settings. With this enabled the indicator tries to not alert on mid/late trend signals.
      - Some graphical tweaks and fixes.
      - Performance improvement.
      Version 2.30 2022.12.28
      - New feature: Now you can set the number of dashboard rows of symbols in the settings.
      - Minor bug fixed.
      Version 2.0 2022.10.18
      - Deep scan mode added for scanning all market watch symbols

      - Solved the problem of saving and loading a chart template with the dashboard on it.

      - Now, saving the indicator chart as a template will also save the chosen symbols in the dashboard.

      - "Unique ID" option added to the settings. If you want to save a different set of symbols change this number. (More info on the guide blog)

      - "Dashboard Columns" option added to the settings. You can choose between 1 or 2 columns of symbols on the dashboard. (14 or 28 symbols) and you can leave a symbol blank in the dashboard.