Resistance and Support Zones
- Indikatoren
- Version: 1.4
- Aktualisiert: 26 April 2022
- Aktivierungen: 10

Der Indikator verwendet einen mechanischen Ansatz, um Widerstands- und Unterstützungszonen zu identifizieren und ihre Stärke zu bewerten, wobei er zeigt, welche Preiszonen wichtiger sind als andere.
Widerstand und Unterstützung sind die wichtigsten Leitindikatoren, die von den meisten Händlern auf der ganzen Welt verwendet werden. Um ein erfolgreicher Händler zu sein, muss jeder Händler die richtige Erkennung von Preiszonen beherrschen.
Dieser Indikator wurde entwickelt, um subjektive Regeln beim Zeichnen von Unterstützungs-/Widerstandszonen zu vermeiden.
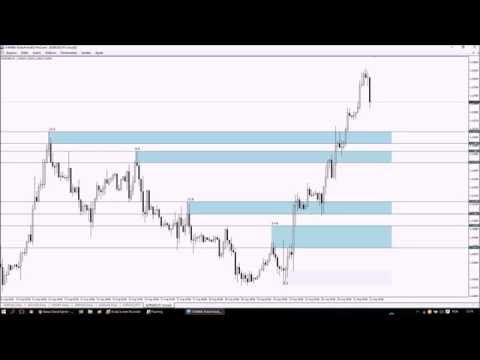
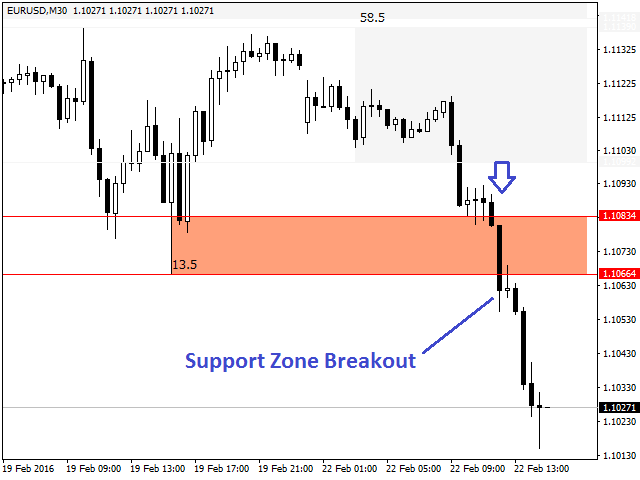
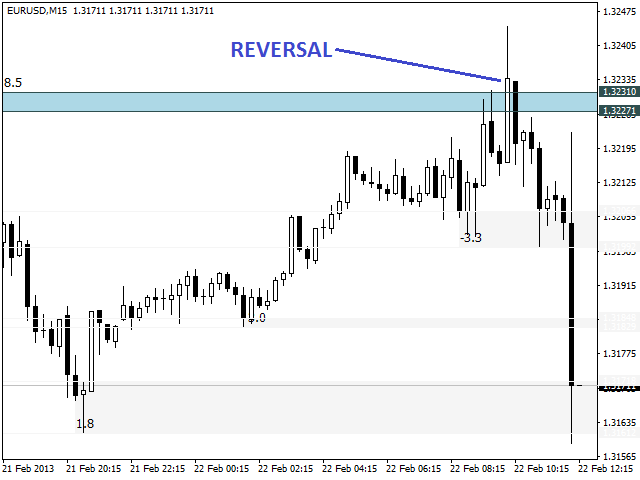
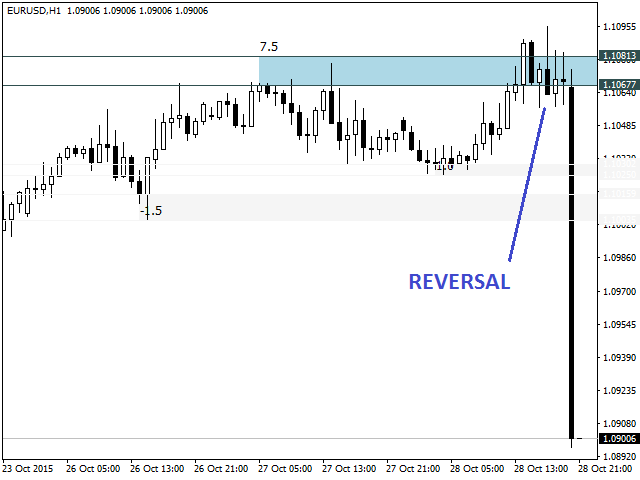
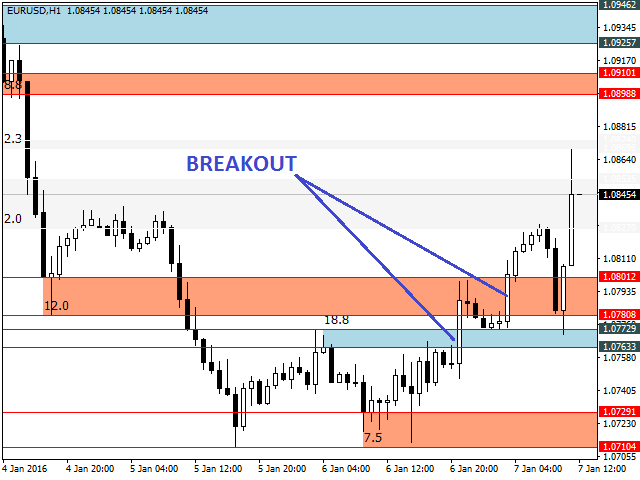
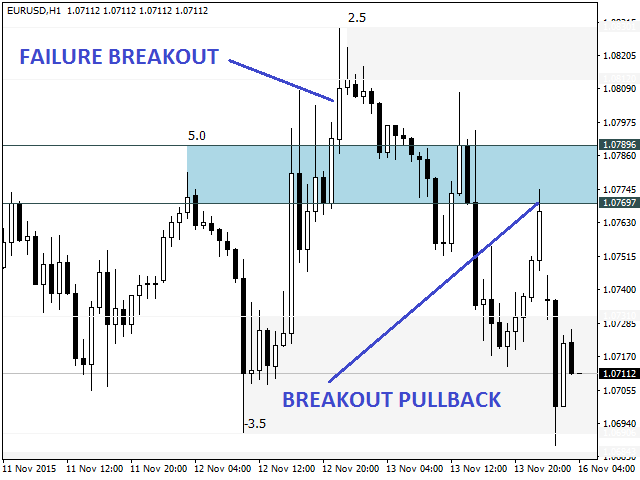
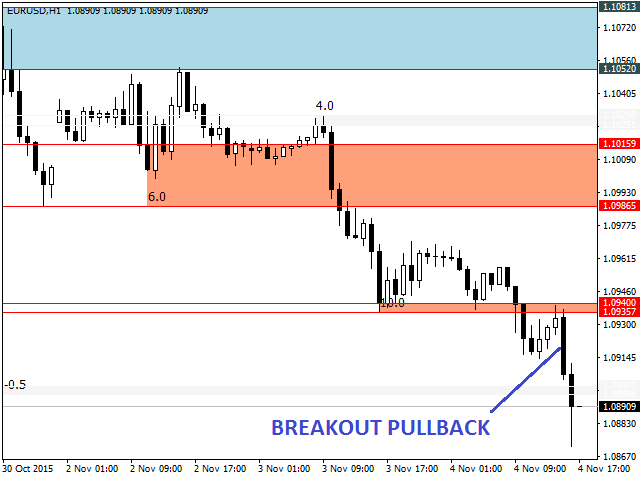
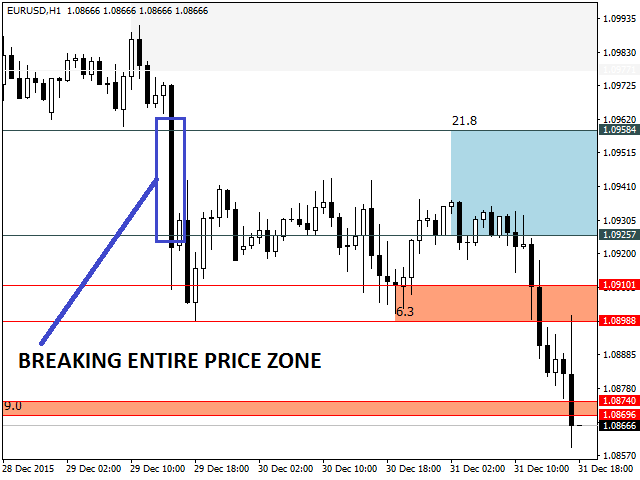
In den meisten Fällen handelt es sich bei Widerstand und Unterstützung nicht um eine einfache Linie, die das Kursdiagramm teilt, sondern um eine Kurszone, auf die der Markt reagiert, wenn er sie berührt.
Beim Erreichen wichtiger Preiszonen kann die Kursbewegung eine Umkehr oder einen Ausbruch vollziehen, wodurch sich Handelsmöglichkeiten ergeben.
Funktionsweise
Der Indikator sucht nach den jüngsten Höchst- und Tiefstständen, um die Widerstands- und Unterstützungszonen zu bilden.
Nachdem die Preiszonen gebildet wurden, nimmt der Indikator eine Clusterung nur für die sich überschneidenden Preiszonen vor (Tipp: Vermeiden Sie es, die Anzahl der Top/Bottom-Parameter zu erhöhen. Dies führt im Allgemeinen zu größeren Preiszonen).
Abschließend bewertet der Indikator das Stärke-Niveau für jede Preiszone.
Automatischer Stärkefilter
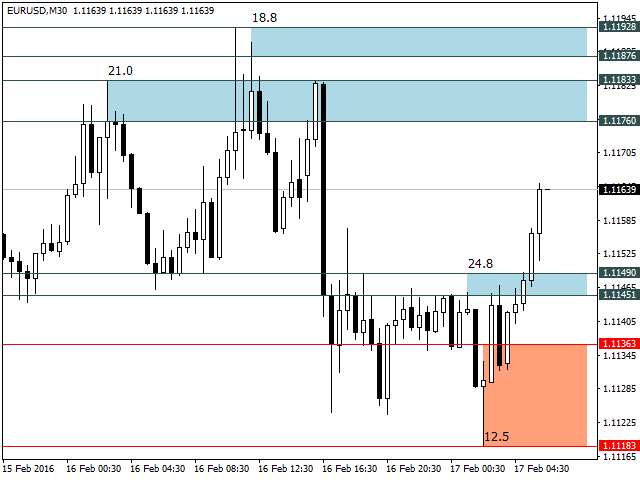
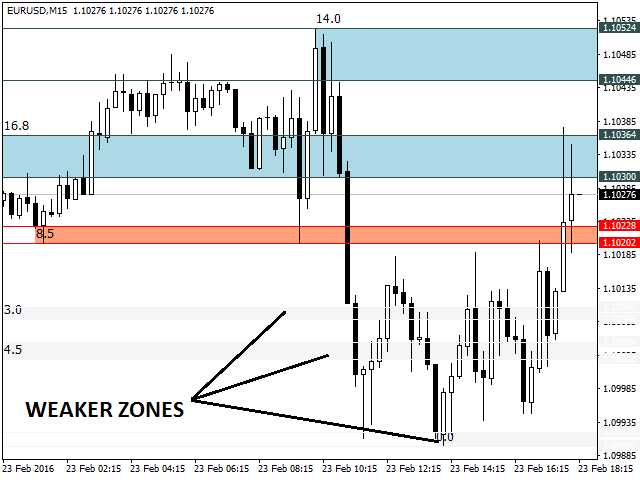
Das Stärke-Niveau einer Zone wird gemessen, indem die Preisaktion analysiert wird, wenn der Markt diese Preiszonen erreicht.
Eine Preiszone mit einem höheren Stärkegrad bedeutet, dass die Preisaktion tendenziell stark mit diesem Preisbereich übereinstimmt.
Der Indikator wurde entwickelt, um die Stärken und Schwächen einer Preiszone zu analysieren, indem für jede auf einem Diagramm eingezeichnete Zone ein Stärkegrad angezeigt wird.
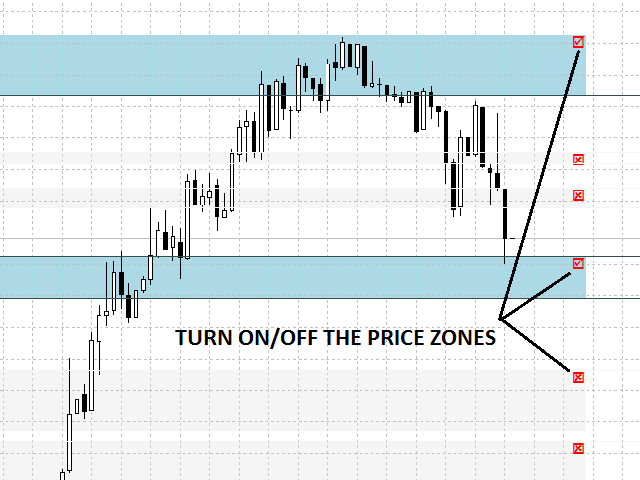
Der Händler kann einen Stärkegrad-Filter anwenden und der Indikator glättet die schwächeren Preiszonen.
Die folgenden Kriterien werden verwendet, um die Stärke einer Preiszone zu bestimmen:
- Wie oft hat die Preiszone in der jüngsten Vergangenheit als Barriere für den Kursanstieg gewirkt.
- Wie oft hat der Kurs diese Zone in der jüngeren Vergangenheit als Unterstützung oder Widerstand genutzt.
- Wie oft hat der Kurs in der jüngeren Vergangenheit beim Erreichen dieser Preiszone stark reagiert.
Durch die Analyse der oben genannten Kriterien ist der Indikator in der Lage, positive oder negative Punkte für jede Preiszone zu ermitteln.
Manueller Filter
Neben dem automatischen Stärkefilter kann der Benutzer auch manuell eine bestimmte Preiszone ein- oder ausschalten, indem er das entsprechende Kontrollkästchen anklickt.
Hauptmerkmale
- Anzeige von Widerstands- und Unterstützungszonen entsprechend ihrer Stärke, Glättung schwacher Preiszonen bei Anwendung des Filters.
- Kann in Verbindung mit höheren Zeitfenstern verwendet werden.
- Automatische Aktualisierung der Preiszonen bei der Bildung neuer Höchst- und Tiefststände, um zu vermeiden, dass sich das Diagramm in ein Durcheinander von Linien verwandelt.
- Aufgrund der Stärke der einzelnen Preiszonen können Preiszonen verglichen werden und Händler können sich auf die stärkeren konzentrieren.
- Funktioniert für jedes Symbol und jeden Zeitrahmen.
- Wird nur ausgeführt, wenn ein neuer Balken gebildet wird.
- Geringe Eingabeparameter, die angepasst werden müssen.
- Zugängliche Puffer für EA-Entwickler.
Einstellungen
- Zeitrahmen - Zeitrahmen, der zur Bildung von Preiszonen verwendet wird.
- Stärkefilter - Aktivieren/Deaktivieren des Stärkefilters. Wenn er aktiviert ist, werden stärkere Preiszonen hervorgehoben und schwächere Preiszonen geglättet.
- Stärkefilter-Ebene - Ebene, die verwendet wird, um stärkere Preiszonen von den schwächeren zu filtern (Standard=8).
- Anzahl der Tops/Bottoms - Anzahl der jüngsten Tops und Bottoms, nach denen der Indikator sucht, um die Preiszonen zu bilden (Standard=5).
- Farbe der Unterstützungslinien - Farbe der horizontalen Linien der Unterstützungszonen.
- Farbe der Widerstandslinien - Farbe der horizontalen Linien der Widerstandszonen.
- Farbe der Unterstützungszonen - Farbe der Unterstützungszonen.
- Farbe der Widerstandszonen - Farbe der Widerstandszonen.
- Schwache Farbe Zone - Farbe der schwachen Zonen.
- Checkbox Color - Farbe der Checkboxen der Preiszonen.
- Hidden Zone Color - Farbe der versteckten Preiszonen (manueller Filter).
Für EA-Entwickler
Verfügbare Puffer:
- Puffer 0 und 3 - untere Preiszone für Widerstand bzw. Unterstützung.
- Puffer 1 und 4 - obere Preiszone für Widerstand bzw. Unterstützung.
- Puffer 2 und 5 - Stärkelevel für Widerstands- bzw. Unterstützungszonen.
Die Informationen zu den Preiszonen werden immer am Anfang der Puffer gespeichert. Der Rest der Puffer wird mit Nullen aufgefüllt.
Wie kann man handeln?
Alleine können die Preiszonen nicht als Einstiegspunkte dienen, aber in Verbindung mit anderen Indikatoren wie Kerzenmustern, Korrelationen und Oszillatoren werden sie zu einem mächtigen Werkzeug. Das folgende Video enthält eine Handelsstrategie, die den Stochastik-Oszillator verwendet.


Very bad and regretted losing $ 50 for nothing
such indicators are better than hundreds of times available and free .
but unfortunately this indicator is added to the fact that it is stolen from the free indicators that it is also stupid and ignores show of support and resistance in the required area