• Übersicht
  • Bewertungen (1)
  • Diskussion (8)
  • Neue Funktionen

Three line candle scanner with RSI filter

5

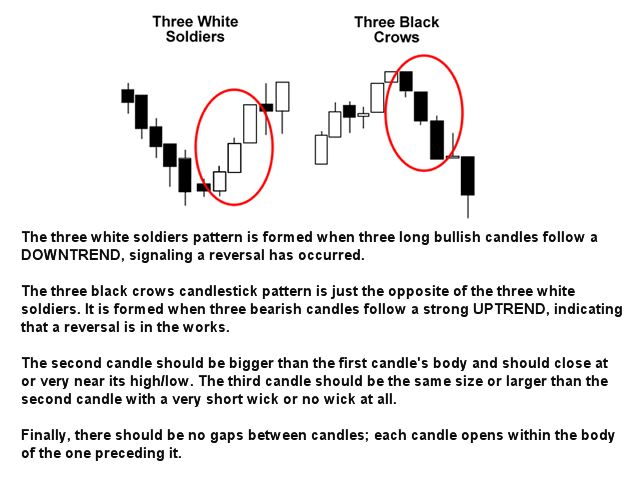
Dieser Multi-Symbol- und Multi-Time-Frame-Indikator sucht nach den folgenden Candlestick-Mustern (siehe Screenshot zur Erklärung der Muster):

  • Drei weiße Soldaten (Umkehrung>Fortsetzungsmuster)
  • Drei schwarze Krähen (Umkehrung> Fortsetzungsmuster)
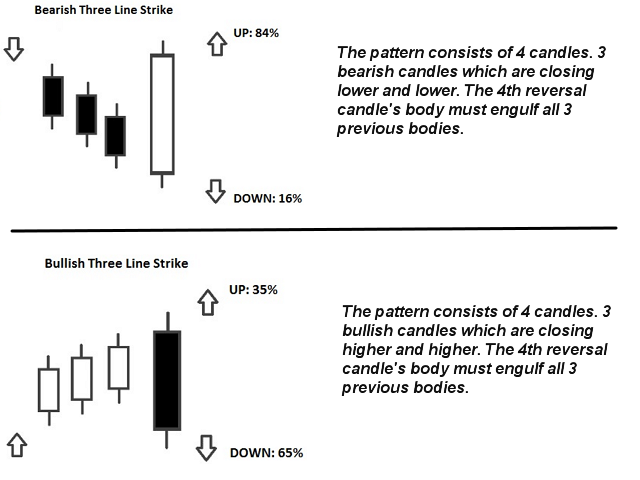
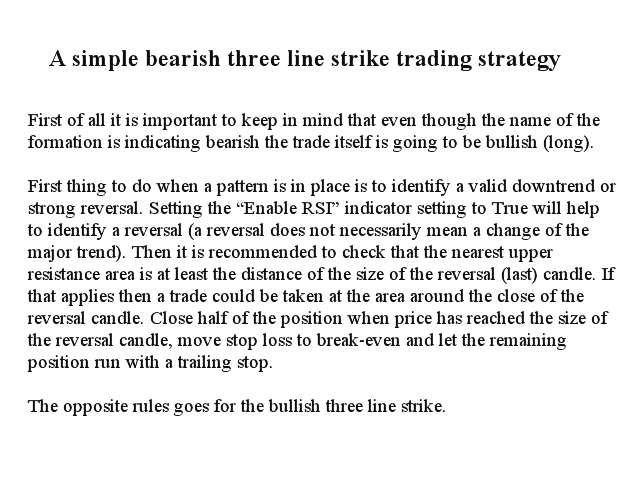
  • Bullish und bearish Drei-Linien-Strike (Umkehrmuster)

Die Muster erscheinen nicht sehr oft auf höheren Zeitrahmen, wenn die strikte Option in den Indikatoreinstellungen aktiviert ist. Aber wenn sie es tun, ist es ein Setup mit sehr hoher Wahrscheinlichkeit. Laut Thomas Bulkowski (international bekannter Autor und führender Experte für Candlestick-Muster) hat der Drei-Linien-Strike den höchsten Gesamtleistungsrang aller Candlestick-Muster. In Kombination mit Ihren eigenen Regeln und Techniken ermöglicht Ihnen dieser Indikator, Ihr eigenes leistungsstarkes System zu erstellen (oder zu verbessern).

Merkmale

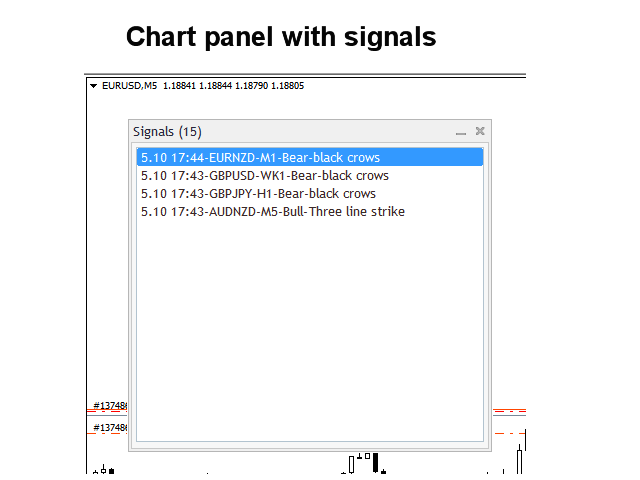
  • Kann alle in Ihrem Market Watch-Fenster sichtbaren Symbole gleichzeitig überwachen. Wenden Sie den Indikator auf nur einen Chart an und überwachen Sie sofort den gesamten Markt.
  • Kann jeden Zeitrahmen von M1 bis MN überwachen und sendet Ihnen eine Echtzeitwarnung, wenn ein Muster identifiziert wird. Alle nativen Metatrader-Warnungstypen werden unterstützt.
  • Kann RSI als Trendfilter verwenden, um potenzielle Umkehrungen richtig zu erkennen.
  • Der Indikator enthält ein interaktives Panel. Wenn Sie auf ein Element klicken, wird ein neuer Chart mit dem entsprechenden Symbol und Zeitrahmen geöffnet.

Eingabeparameter

Die Beschreibung und Erläuterung der Eingabeparameter finden Sie hier .

Bitte beachten Sie, dass dieser Indikator aufgrund der Multi-Time-Frame-Funktionalität keine Linien und Pfeile oder Verkaufs- und Kaufempfehlungen auf einem Chart zeichnet.

Ich empfehle Ihnen, den Indikator auf einem sauberen (leeren) Chart ohne andere Indikatoren oder Expert Advisors darauf zu platzieren, die den Scanner stören könnten.


Bewertungen 1
FXsolutions
86831
Mike Semlitsch 2018.03.23 14:51 
 

Jan did a great job with this scanner. There are many configuration options. You can configure it according to your needs and get exactly those signals which you want to receive. 5 stars!

Empfohlene Produkte
I  recommend you to read the   product's blog  (manual) from start to end so that it is clear from the beginning what the indicator offers. This multi time frame and multi symbol indicator scans for engulfing and tweezer formations. The indicator can also be used in single chart mode. Combined with your own rules and techniques, this indicator will allow you to create (or enhance) your own powerful system. Features Can monitor all symbols visible in your Market Watch window at the same time. Ap
I  recommend you to read the   product's blog  (manual) from start to end so that it is clear from the beginning what the indicator offers. This multi time frame and multi symbol indicator identifies double top/bottom, head & shoulders, pennant/triangle and flag patterns. It is also possible to setup alerts only when a neckline/triangle/flagpole breakout has occured (neckline breakout = confirmed signal for top/bottoms and head & shoulders).  The indicator can also be used in single chart mode.
Wir stellen Ihnen den Donchian Channels Indikator für MQL4 vor, ein leistungsstarkes technisches Analysewerkzeug, das darauf abzielt, Ihren Handelserfolg zu steigern. Dieser Indikator besteht aus vier Linien, die die oberen und unteren Grenzen der Preisbewegung über einen bestimmten Zeitraum darstellen. Mit dem Donchian Channels Indikator können Sie potenzielle Ausbrüche und Umkehrungen auf dem Markt leicht identifizieren. Die obere Linie zeigt das höchste Hoch des festgelegten Zeitraums an, wäh
Dieser einzigartige Indikator für das automatische Zeichnen von Trendlinien funktioniert in allen Zeitrahmen und kann Ihnen dabei helfen, kurzfristige Trendumkehrungen sowie kurzfristige Trendausbrüche, die auf das stärkere Kapital auf dem Markt hinweisen, problemlos zu handeln. Es ermöglicht Ihnen auf einzigartige Weise, für schwere Schaukeln FRÜH einzusteigen. Eingaben umfassen: - Max Candles blicken zurück auf Trendlinien - Linientyp und Farbe - Maximaler Abstand zum Außenband und Bandpe
KFX Symbol Changer
Peter Kariuki Thande
4.67 (3)
KFX SMA: Symbol Changer + Moving Average (3x) + ATR + RSI + Candle Timer. This indicator allows you to create a Symbol list and change between symbols of the current chart or Timeframe by selecting the appropriate button. On Chart there are three(3) multi timeframe Moving Averages shown (selected by you), ATR Value MTF ( selected by you -  helps with setting SL and TP), RSI Value MTF (selected by you) and a Candle Timer.   Features: - Symbol Changer : Change Symbol and Timeframe of Chart.   (
FREE
I recommend you to read the   product's blog  (manual) from start to end so that it is clear from the beginning what the indicactor offers. This multi time frame and multi symbol indicator can identify the following 5 crosses: when a fast moving average crosses a slow moving average line. when price has reached a single moving average (closed above/below or just bounced). when a triple moving average formation has appeared (all 3 MA:s in consecutive alignment). when the MACD main line crosses t
Dieser Multi-Time-Frame- und Multi-Symbol-Trendindikator sendet eine Warnung, wenn ein starker Trend oder eine Trendumkehr identifiziert wurde. Es kann dies tun, indem es den Aufbau des Dashboards mit dem gleitenden Durchschnitt (einfach oder doppelt (MA-Crossover)), RSI, Bollinger-Bändern, ADX, zusammengesetztem Index, Parabolic SAR, Awesome (AO), MACD (Signallinie),       Stochastik-Crossover oder Hull Moving Average   . Es kann mit allen Zeitrahmen von M5 bis MN verwendet werden. Die Farben i
KT Tether Line MT4
KEENBASE SOFTWARE SOLUTIONS
The KT Tether Line is a trend-following tool consisting of three indicators that work together to generate trading signals. It can correctly identify market trends while signaling trade entries. It was first introduced by Bryan Strain in the Stock & Commodities magazine in 2000 in "How to get with the trend and out at the end." The Concept When a market trend is confirmed, the most challenging part is determining the timing of the entries. This indicator alerts you to potential trend reversal
Description Better version of RSI indicator which offer a complete visual trading strategy and realize an auto-optimization Support:   We create great tools for the entire trading community. Most of them are free. If you believe in what we do  Support Us Here.   KEY LINKS:   How to Install  –  Frequent Questions  -  All Products  How is this indicator useful? NEVER repaints. Detect best parameters of RSI indicator, based on profit factor during the specified period. This indicator can be used as
KT Fisher Transform MT4
KEENBASE SOFTWARE SOLUTIONS
KT Fisher Transform is an advanced version of the original Fisher Transform oscillator equipped with divergence detection, crossover alerts, and many more features. Originally it was developed by John F. Ehlers. It converts the asset's price into a Gaussian normal distribution to find the local extremes in a price wave.  Features A light-weighted oscillator that efficiently identifies the upward and downward crossovers and marks them using vertical lines. It also finds regular and hidden div
It could help to calculate Risk-Reward easily before placing a BUY-SELL position. TradeSizeCalculator is a Multi-Tasking Calculator. It will calculate the others when we define the value in one of the columns. Stoploss, risk percentage, risk-money, lot size, take-profit , reward-money, and reward-ratio. Depending on which value is changed. All values in the columns are editable. Also, we can get those calculation results by drag-drop the stop-loss/take-profit line. Parameter: The inputs below ar
My Point MT4
Claudia Ramona Angerer
4 (1)
Diagnosis of major and minor pivot Trend detection with many signals Can be used in all symbols Can be used in all time frames Settings: Back Show: The number of candles it displays If you need any adjustments, or have any questions or suggestions, message me How to trade: Blue: sell signal Red: buy signal Blue and red at the same time: no signal Exit signal: Opposite signal
ForexGumpUltra
Andrey Kozak
3.25 (4)
ForexGumpUltra is a new and more advanced indicator of the ForexGump series. This indicator easily determines the price direction on any currency pair and any timeframe. The indicator draws its signals on the zero bar and does not redraw them (see the video). In the 34th second of the video it can be seen that this indicator uses new filters to determine the changes in price movement direction without delay, despite the market noise present at the moment (see the video on the 34th second). Once
United Rsi
Kenneth Parling
3.5 (2)
Einführung United Rsi ist ein Experte, den jeder in seinem Arsenal haben sollte, einfach und leicht zu handhaben. Aus dem Namen werden Sie sicherlich verstehen, dass der Experte mit dem Indikator Relative Strength Index arbeitet, der ein Signal für den Handel in überkauften und überverkauften Preiszonen darstellt. Orders werden mit dem üblichen Take-Profit und Stop-Loss platziert. Die charakteristischen Merkmale des Experten Voreinstellungen, die auf eurusd M5 verwendet werden können Es werde
FREE
EPriceJPY
Ngo Yung Lau
EPriceJPY is a auto-trading EA focused on USDJPY. Trading Concept The operation concept of EPriceJPY is based on an algorithm that tries to determine the Trend. To be more specific, EPriceJPY works with its own calculation logic based on simulation. It is trying to find out the Top or Bottom in a Trend, and open the Short or Long Position accordingly. Don't expect EPriceJPY to open the trade on the highest or lowest level, because EPriceJPY will trade only when the Top/Bottom can be confirmed.
I recommend you to read the   product's blog  (manual) from start to end so that it is clear from the beginning what the indicactor offers. This multi time frame and multi symbol indicator sends an alert when one or more trend reversal candle patterns have been identified on several time frames. It can be used with all time frames from M5 to MN. It is possible to enable moving average or RSI trend filter to filter out only the strongest setups. Combined with your own rules and techniques, this
This is a simple arrow system based on Engulfing Candlestick Pattern. It gives you alerts on your smartphone when there is an engulfing candlestick pattern happens. Which type of alerts available? 1. It paints on chart Up/Down Arrows. 2. Popup message and sound alert in trading terminal window. 3. Push notification or Alert on your Android and IOS mobile phones (requires MT4 or MT5 app installed!) *Note: Use it on higher timeframes like H4 (4 hours), D1 (1 Day) then find trade opportunities on s
TDI Signals generates buy and sell arrows based on a TDI(Traders Dynamic Index) algorithm. It looks for price breakouts, continuations and reversals. By default it runs in the trend mode but user is provided with the option to change that to reversal mode. Trader can use the mode which compliments his/her trading style.  Usage:-   TDI Signals can be used as a stand alone indicator with context or even be added to strategies to make confirmations more strong. Volatility based stop loss, take pr
The Transition Trend indicator shows the points of potential market reversal. The indicator's smart algorithm detects the trend, filters out market noise and generates entry signals and exit levels. Simple, visual and efficient trend detection. Uses just one parameter for settings. The indicator does not redraw and does not lag. You can set up message alerts as sound or email. Works on all currency pairs and all timeframes. Ready-made trading system.
This scanner is monitoring the entire market for trade opportunities for all symbols and for all   time frames. You don't have to look to all the charts, for all symbols and for all time frames. This scanner will alert you on your computer, or on your mobile, when a trade opportunity has been found.  You never have to miss a trade opportunity!   This indicator is designed to scan all pairs and symbols, for all time frames, to find a cross of the MACD main and signal line.   MACD Definition The
KT Market Speed MT4
KEENBASE SOFTWARE SOLUTIONS
The KT Market Speed is a unique and straightforward oscillator-based technical analysis tool that helps traders visualize the speed at which the price of an instrument changes based on the preset length. The Market Speed representation helps correctly map the price momentum: is it moving fast, slowing down, or trapped in a range? These are the questions the indicator answers, giving traders more bandwidth to execute better-informed trade positions. Formula It's a simple technical analysis t
I recommend you to read the   product's blog  (manual) from start to end so that it is clear from the beginning what the indicactor offers. This multi time frame and multi symbol indicator scans for pin bars. Combined with your own rules and techniques, this indicator will allow you to create (or enhance) your own powerful system. Features Can monitor all symbols visible in your Market Watch window at the same time. Apply the indicator to just one chart and instantly monitor the entire market.
Awesome Market Structure
Komang Putra Riswanjaya
The market structure indicator helps traders easily read market trends, this indicator shows trend continuity and trend reversals, this tool will be very useful for beginners who are just getting to know market structure, the indicator will provide visualization of the patterns that occur Key Features: 1. BOS pattern: The indicator will provide an overview of the Break Of Structure pattern, where the pattern will indicate the continuation of the trend 2. CHOCH Pattern: The indicator will prov
KT Absolute Strength MT4
KEENBASE SOFTWARE SOLUTIONS
KT Absolute Strength measures and plots the absolute strength of the instrument's price action in a histogram form. It combines the moving average and histogram for a meaningful illustration. It supports two modes for the histogram calculation, i.e., it can be calculated using RSI and Stochastic both. However, for more dynamic analysis, RSI mode is always preferred. Buy Entry When the Absolute Strength histogram turns green and also it's higher than the previous red column. Sell Entry W
I recommend you to read the   product's blog  (manual) from start to end so that it is clear from the beginning what the indicactor offers. This multi time frame and multi symbol indicator identifies double or triple top/bottom formations or a following neckline breakout (confirmed top/bottom). It offers filters for RSI overbought/oversold, candle patterns (pin bar, engulfing, tweezer, morning/evening star, three line strike) and divergences (MACD, OsMA, Awesome (AO), RSI, CCI, Stochastic) whic
Smart Math EA
Erik Shahazizyan
The advisor is a flexible solution with a grid strategy. Easy to operate and at the same time effective. It can be used both for accelerating a deposit and for conservative trading, depending on the settings. Uses auto lot and averaging to optimize trading. It is an excellent tool in skillful hands, providing stable results. Those who write a comment and rate honestly will get a Pro Set. Recommendations: Currency Pair: EURUSD Timeframe: M15 Minimum Deposit: $500 Brokers: Exness, Alpari, RoboFore
FREE
This indicator is designed for monitoring RSI levels on the current and higher timeframes. The control panel is user friendly and consists of buttons, with which you can control the display of lines as per the names of the buttons. The button color matches the line color. Parameters "___| Settings of the main indicator " RSI Period - averaging period for index calculation (default is 14); RSI Price type - price used for calculations (default is the Close price); "___| Color palette " Text colo
Please contact me at telegram  https://t.me/smartforex7 After purchasing SmartForex Indicator then Use This Indicator...................... SMART EXIT PROFIT LINE Indicator is very Helpful with SmartForex Indicator ........................................ SMART EXIT PROFIT LINE Indicator Attach with SmartForex Indicator after then Red Line Show Exit buy Profit , Green Line show Exit Sell Profit................
FREE
Effect
Maryna Shulzhenko
The Effect indicator shows the points of potential market reversal. Simple, visual and efficient trend detection. Ready-made trading system. The intelligent algorithm of the indicator determines the trend with good probability. Uses just one parameter for settings. The indicator does not redraw and does not lag. Works on all currency pairs and all timeframes. You should remember that using a combination of forecasting tools, it is advisable to choose 2-3 indicators for trading. Otherwise, the
Forex Indicator "Trend Entry Histogram" for MT4 Trend Entry Histogram indicator can be used for search of   entry signals into the trend  direction once Entry bar appears This indicator has unique feature - it takes both: price and volume for calculations  Trend Entry Histogram   can be in 2 colors:   red for bearish  trend  and blue for bullish one . Once you see steady trend (minimum 10 consecutive histogram bars   of the same color) - wait for entry bar  Entry  signal is   1 column with oppos
Käufer dieses Produkts erwarben auch
Gann Made Easy
Oleg Rodin
4.92 (53)
Gann Made Easy ist ein professionelles und einfach zu bedienendes Forex-Handelssystem, das auf den besten Handelsprinzipien unter Verwendung der Theorie von Mr. basiert. W.D. Gann. Der Indikator liefert genaue KAUF- und VERKAUFSsignale, einschließlich Stop-Loss- und Take-Profit-Levels. Mit PUSH-Benachrichtigungen können Sie auch unterwegs handeln. Bitte kontaktieren Sie mich nach dem Kauf! Ich werde meine Handelstipps und tolle Bonusindikatoren kostenlos mit Ihnen teilen! Wahrscheinlich haben Si
Atomic Analyst
Issam Kassas
5 (3)
Zunächst einmal ist es erwähnenswert, dass dieser Handelsindikator nicht neu malt, nicht neu zeichnet und keine Verzögerung aufweist, was ihn sowohl für manuellen als auch für Roboterhandel ideal macht. Der Atom-Analyst ist ein PA-Preisaktionsindikator, der die Stärke und das Momentum des Preises nutzt, um einen besseren Vorteil auf dem Markt zu finden. Ausgestattet mit fortschrittlichen Filtern, die helfen, Rauschen und falsche Signale zu entfernen, und das Handelspotenzial zu erhöhen. Durch
DERZEIT 26% RABATT Die beste Lösung für jeden Newbie oder Expert Trader! Dieser Indikator ist ein einzigartiges, qualitativ hochwertiges und erschwingliches Trading-Tool, da wir eine Reihe von proprietären Funktionen und eine neue Formel integriert haben. Mit nur EINEM Chart können Sie die Währungsstärke für 28 Forex-Paare ablesen! Stellen Sie sich vor, wie sich Ihr Handel verbessern wird, weil Sie in der Lage sind, den genauen Auslösungspunkt eines neuen Trends oder einer Scalping-Gelegenh
Wir stellen vor       Quantum Trend Sniper Indicator   , der bahnbrechende MQL5-Indikator, der die Art und Weise, wie Sie Trendumkehrungen erkennen und handeln, verändert! Entwickelt von einem Team erfahrener Händler mit über 13 Jahren Handelserfahrung,       Quantum Trend Sniper-Indikator       wurde entwickelt, um Ihre Trading-Reise mit seiner innovativen Methode zur Identifizierung von Trendumkehrungen mit extrem hoher Genauigkeit auf ein neues Niveau zu heben. ***Kaufe Quantum Trend Snipe
Entdecken Sie das Geheimnis des erfolgreichen Forex -Handels mit unserem benutzerdefinierten MT4 -Indikator! Haben Sie sich jemals gefragt, wie Sie Erfolg auf dem Forex -Markt erzielen können und gleichzeitig Gewinne erzielen und gleichzeitig das Risiko minimieren können? Hier ist die Antwort, nach der Sie gesucht haben! Erlauben Sie uns, unseren proprietären MT4 -Indikator vorzustellen, der Ihren Handelsansatz revolutionieren wird. Einzigartige Vielseitigkeit Unser Indikator ist speziell
Trend Screener
STE S.S.COMPANY
4.83 (86)
Trendindikator, bahnbrechende, einzigartige Lösung für Trendhandel und -filterung mit allen wichtigen Trendfunktionen in einem Tool! Es handelt sich um einen 100 % nicht neu zu malenden Multi-Timeframe- und Multi-Währungs-Indikator, der für alle Symbole/Instrumente verwendet werden kann: Forex, Rohstoffe, Kryptowährungen, Indizes und Aktien. Trend Screener ist ein effizienter Trendfolgeindikator, der Pfeiltrendsignale mit Punkten im Diagramm liefert. Die Funktionen, die im Trendanalysator-Indika
Zunächst einmal ist es wichtig zu betonen, dass dieses Handelstool ein Nicht-Repaint-, Nicht-Redraw- und Nicht-Verzögerungsindikator ist, was es ideal für professionelles Trading macht. Der Smart Price Action Concepts Indikator ist ein sehr leistungsstarkes Werkzeug sowohl für neue als auch erfahrene Händler. Er vereint mehr als 20 nützliche Indikatoren in einem und kombiniert fortgeschrittene Handelsideen wie die Analyse des Inner Circle Traders und Strategien des Smart Money Concepts. Diese
TPSpro RFI Levels
Roman Podpora
5 (13)
A key element in trading is zones or levels from which decisions to buy or sell a trading instrument are made. Despite attempts by major players to conceal their presence in the market, they inevitably leave traces. Our task was to learn how to identify these traces and interpret them correctly. Reversal First Impulse levels (RFI)   -  Version MT5                INSTRUCTIONS                 RUS                 ENG                                       R ecommended to use with an indicator   -  
TPSproTREND PrO
Roman Podpora
5 (15)
TPSpro TRENDPRO  - is a trend indicator that automatically analyzes the market and provides information about the trend and each of its changes, as well as giving signals for entering trades without redrawing! The indicator uses each candle, analyzing them separately. referring to different impulses - up or down impulse. Exact entry points into transactions for currencies, crypto, metals, stocks, indices!  -  Version MT5               DETAILED DESCRIPTION        /       TRADING SETUPS           
Advanced Supply Demand
Bernhard Schweigert
4.92 (310)
Derzeit 33% Rabatt! Die beste Lösung für jeden Anfänger oder erfahrenen Händler! Dieser Indikator ist ein einzigartiges, qualitativ hochwertiges und erschwingliches Trading-Tool, da wir eine Reihe von proprietären Funktionen und eine neue Formel integriert haben. Mit diesem Update werden Sie in der Lage sein, doppelte Zeitrahmenzonen anzuzeigen. Sie können nicht nur einen höheren TF (Zeitrahmen) anzeigen, sondern sowohl den Chart-TF als auch den höheren TF: SHOWING NESTED ZONES. Alle Supply Dema
Derzeit 20% Rabatt! Die beste Lösung für jeden Neueinsteiger oder Expert Händler! Dieses Dashboard arbeitet mit 28 Währungspaaren. Es basiert auf 2 unserer Hauptindikatoren (Advanced Currency Strength 28 und Advanced Currency Impulse). Es bietet einen hervorragenden Überblick über den gesamten Forex-Markt. Es zeigt die Werte der Advanced Currency Strength, die Veränderungsrate der Währungen und die Signale für 28 Devisenpaare in allen (9) Zeitrahmen. Stellen Sie sich vor, wie sich Ihr Hande
Break and Retest
Mohamed Hassan
5 (7)
‍You can visually backtest Break & Retest to see how it behaved in the past!     Manual guide:   Click here $65  for only 1  copy left! Next price is $120 .  This Indicator only places quality trades when the market is really in your favor with a clear break and retest. Patience is key with this price action strategy! After many months of hard work and dedication, we are extremely proud to present you our  Break and Retest price action indicator created from scratch. One of
Scalper Inside PRO
Alexey Minkov
4.75 (57)
SALE NOW! Limited Time Offer! An exclusive indicator that utilizes an innovative algorithm to swiftly and accurately determine the market trend. The indicator automatically calculates opening, closing, and profit levels, providing detailed trading statistics. With these features, you can choose the most appropriate trading instrument for the current market conditions. Additionally, you can easily integrate your own arrow indicators into Scalper Inside Pro to quickly evaluate their statistics and
GOLD Impulse with Alert
Bernhard Schweigert
4.56 (9)
Dieser Indikator ist eine hervorragende Kombination aus unseren 2 Produkten Advanced Currency IMPULSE with ALERT  +   Currency Strength Exotics . Es funktioniert für alle Zeitrahmen und zeigt grafisch Impulse der Stärke oder Schwäche für die 8 wichtigsten Währungen plus ein Symbol! Dieser Indikator ist darauf spezialisiert, die Beschleunigung der Währungsstärke für beliebige Symbole wie Gold, Exotische Paare, Rohstoffe, Indizes oder Futures anzuzeigen. Als erster seiner Art kann jedes Sym
RelicusRoad Pro
Relicus LLC
4.78 (139)
Jetzt 147 US -Dollar (nach ein paar Aktualisierungen auf 499 US -Dollar) - Unbegrenzte Konten (PCs oder MACs) RelicusRoad Benutzerhandbuch + Schulungsvideos + Zugang zur privaten Discord-Gruppe + VIP-Status EINE NEUE ART, DEN MARKT ZU BETRACHTEN RelicusRoad ist der weltweit leistungsstärkste Handelsindikator für Forex, Futures, Kryptowährungen, Aktien und Indizes und gibt Händlern alle Informationen und Tools, die sie benötigen, um profitabel zu bleiben. Wir bieten technische Analysen un
DERZEIT 31% RABATT! Die beste Lösung für jeden Newbie oder Expert Trader! Dieser Indikator ist ein einzigartiges, qualitativ hochwertiges und erschwingliches Handelsinstrument, da wir eine Reihe von proprietären Funktionen und eine geheime Formel eingebaut haben. Mit nur EINEM Chart liefert er Alerts für alle 28 Währungspaare. Stellen Sie sich vor, wie sich Ihr Handel verbessern wird, weil Sie in der Lage sind, den genauen Auslösepunkt eines neuen Trends oder einer Scalping-Gelegenheit zu e
Quantum Breakout Indicator PRO
Bogdan Ion Puscasu
4.96 (26)
Wir stellen vor       Quantum Breakout PRO   , der bahnbrechende MQL5-Indikator, der die Art und Weise, wie Sie mit Breakout-Zonen handeln, verändert!   Quantum Breakout PRO   wurde von einem Team erfahrener Händler mit über 13 Jahren Handelserfahrung entwickelt und soll Ihre Handelsreise mit seiner innovativen und dynamischen Breakout-Zonen-Strategie auf ein neues Niveau bringen. Der Quantum Breakout Indicator zeigt Ihnen Signalpfeile auf Breakout-Zonen mit 5 Gewinnzielzonen und Stop-Loss
Scalper Vault
Oleg Rodin
5 (28)
Scalper Vault ist ein professionelles Scalping-System, das Ihnen alles bietet, was Sie für erfolgreiches Scalping benötigen. Dieser Indikator ist ein komplettes Handelssystem, das von Forex- und Binäroptionshändlern verwendet werden kann. Der empfohlene Zeitrahmen ist M5. Das System liefert Ihnen genaue Pfeilsignale in Richtung des Trends. Es liefert Ihnen auch Top- und Bottom-Signale und Gann-Marktniveaus. Die Indikatoren bieten alle Arten von Warnungen, einschließlich PUSH-Benachrichtigungen.
Präsentation des Miraculous Forex Indikators: Entfesseln Sie die Kraft präzisen Tradings Sind Sie es leid, nach dem besten Forex-Indikator zu suchen, der wirklich herausragende Ergebnisse in allen Zeitebenen liefert? Suchen Sie nicht weiter! Der Miraculous Forex Indikator ist da, um Ihre Trading-Erfahrung zu revolutionieren und Ihre Gewinne auf neue Höhen zu bringen. Basierend auf modernster Technologie und jahrelanger sorgfältiger Entwicklung steht der Miraculous Forex Indikator als Höhepunkt v
Werden Sie Breaker Trader und profitieren Sie von Änderungen der Marktstruktur, wenn sich der Preis umkehrt. Der Order Block Breaker Indikator zeigt an, wann sich eine Trend- oder Preisbewegung der Erschöpfung nähert und bereit ist, sich umzukehren. Es weist Sie auf Änderungen in der Marktstruktur hin, die normalerweise auftreten, wenn eine Umkehrung oder ein größerer Rückzug bevorsteht. Der Indikator verwendet eine proprietäre Berechnung, die Ausbrüche und Preisdynamik identifiziert. Jedes
How to use Pair Trading Station Pair Trading Station is recommended for H1 time frame and you can use it for any currency pairs. To generate buy and sell signal, follow few steps below to apply Pair Trading Station to your MetaTrader terminal. When you load Pair Trading Station on your chart, Pair Trading station will assess available historical data in your MetaTrader platforms for each currency pair. On your chart, the amount of historical data available will be displayed for each currency pai
PZ Harmonacci Patterns
PZ TRADING SLU
3.43 (7)
Dies ist wahrscheinlich der vollständigste Indikator für die automatische Erkennung der harmonischen Preisbildung, den Sie für die MetaTrader-Plattform finden können. Es erkennt 19 verschiedene Muster, nimmt Fibonacci-Projektionen genauso ernst wie Sie, zeigt die potenzielle Umkehrzone (PRZ) an und findet geeignete Stop-Loss- und Take-Profit-Werte. [ Installationsanleitung | Update-Anleitung | Fehlerbehebung | FAQ | Alle Produkte ] Es erkennt 19 verschiedene harmonische Preisbildungen Dar
Das technische Handelssystem von BB Reverse Arrows wurde entwickelt, um umgekehrte Punkte für Einzelhandelsentscheidungen vorherzusagen. Die aktuelle Marktsituation wird durch den Indikator analysiert und für mehrere Kriterien strukturiert: die Erwartung von Umkehrmomenten, potenziellen Wendepunkten, Kauf- und Verkaufssignalen. Der Indikator enthält keine überschüssigen Informationen, verfügt über eine visuelle verständliche Schnittstelle, mit der Händler angemessene Entscheidungen treffen k
FX Power MT4 NG
Daniel Stein
5 (9)
Erhalten Sie Ihr tägliches Marktupdate mit Details und Screenshots über unser Morning Briefing hier auf mql5 und auf Telegram ! FX Power MT4 NG ist die nächste Generation unseres langjährig sehr beliebten Währungsstärkemessers FX Power. Und was bietet dieser Stärkezähler der nächsten Generation? Alles, was Sie am ursprünglichen FX Power geliebt haben PLUS GOLD/XAU-Stärkeanalyse Noch präzisere Berechnungsergebnisse Individuell konfigurierbare Analysezeiträume Anpassbares Berechnungslimit für noc
TrendDecoder Premium
Christophe, Pa Trouillas
5 (3)
Identifizieren Sie Bereiche und die nächsten wahrscheinlichen Bewegungen   |  Erhalten Sie früheste Signale und die Stärke von Trends   |  Klare Ausstiegssignale vor Umkehrung   |  Erkennen Sie die Fibo-Levels, die der Kurs testen wird Indikator, der nicht zurückverfolgt, nicht verzögert - ideal für den manuellen und automatisierten Trading - geeignet für alle Vermögenswerte und Zeiteinheiten Zeitlich begrenztes Angebot   >> 50% OFF Nach dem Kauf,   bitte kontaktieren Sie mich auf diesem Kanal  
Currency Strength Wizard ist ein sehr leistungsstarker Indikator, der Ihnen eine Komplettlösung für erfolgreichen Handel bietet. Der Indikator berechnet die Stärke dieses oder jenes Forex-Paares anhand der Daten aller Währungen in mehreren Zeitrahmen. Diese Daten werden in Form von benutzerfreundlichen Währungsindizes und Währungsstärkelinien dargestellt, anhand derer Sie die Stärke dieser oder jener Währung erkennen können. Sie müssen lediglich den Indikator an das Diagramm anhängen, mit dem Si
TrendMaestro
Stefano Frisetti
5 (2)
note: this indicator is for METATRADER4, if you want the version for METATRADER5 this is the link:  https://www.mql5.com/it/market/product/108106 TRENDMAESTRO ver 2.4 TRENDMAESTRO recognizes a new TREND in the bud, he never makes mistakes. The certainty of identifying a new TREND is priceless. DESCRIPTION TRENDMAESTRO identifies a new TREND in the bud, this indicator examines the volatility, volumes and momentum to identify the moment in which there is an explosion of one or more of these data a
Master Pullback
TDINVEST LLP
5 (3)
- 50% OFF - Telegram group : https://t.me/+5RIceImV_OJmNDA0 MT5 version : https://www.mql5.com/en/market/product/85917?source=Site+Market+Product+Page Master Pullback is a complete system that gives unique trading opportunities and a clear indication of the market: trend, signals as well as stop loss and take profit levels. This system has been designed to be as simple as possible and detects extreme overbought and oversold zones, support and resistance levels, as well as the major trend. You
AW Trend Predictor
AW Trading Software Limited
4.74 (39)
Die Kombination von Trend- und Aufschlüsselungsebenen in einem System. Ein fortschrittlicher Indikatoralgorithmus filtert Marktrauschen, bestimmt den Trend, Einstiegspunkte sowie mögliche Ausstiegsniveaus. Indikatorsignale werden in einem Statistikmodul aufgezeichnet, das es Ihnen ermöglicht, die am besten geeigneten Tools auszuwählen, die die Wirksamkeit der Signalhistorie zeigen. Der Indikator berechnet Take-Profit- und Stop-Loss-Marken. Handbuch und Anleitung ->   Hier   / MT5-Version ->   H
Dieses Dashboard ist ein Warntool zur Verwendung mit dem Indikator für die Umkehrung der Marktstruktur. Sein Hauptzweck besteht darin, Sie auf Umkehrmöglichkeiten in bestimmten Zeitrahmen und auch auf die erneuten Tests der Warnungen (Bestätigung) aufmerksam zu machen, wie es der Indikator tut. Das Dashboard ist so konzipiert, dass es auf einem eigenen Chart sitzt und im Hintergrund arbeitet, um Ihnen Benachrichtigungen zu Ihren ausgewählten Paaren und Zeitrahmen zu senden. Es wurde entwickelt,
Weitere Produkte dieses Autors
Dieser Indikator mit mehreren Zeitrahmen und mehreren Symbolen identifiziert doppelte Top/Boden-, Kopf- und Schulter-, Wimpel-/Dreiecks- und Flaggenmuster. Es ist auch möglich, Alarme nur dann einzurichten, wenn ein Nackenlinien-/Dreiecks-/Fahnenmast-Ausbruch aufgetreten ist (Nackenlinien-Ausbruch = bestätigtes Signal für Top/Bottoms und Head & Shoulders).       Der Indikator kann auch im Single-Chart-Modus verwendet werden. Bitte lesen Sie mehr über diese Option in den Produktinformationen    
Dieser Multi-Timeframe- und Multi-Symbol-Indikator scannt nach Pin-Bars, Morgen-/Abendsternen, Engulfings, Tweezers, Three Line Strikes, Inside Bars und Wimpel und Dreiecken.   Der Indikator kann auch im Single-Chart-Modus verwendet werden. Bitte lesen Sie mehr über diese Option in den Produktinformationen       bloggen   .       In Kombination mit Ihren eigenen Regeln und Techniken ermöglicht Ihnen dieser Indikator, Ihr eigenes leistungsstarkes System zu erstellen (oder zu verbessern). Merkmale
I recommend you to read the   product's blog  (manual) from start to end so that it is clear from the beginning what the indicactor offers. This multi time frame and multi symbol divergence dashboard indicator sends an alert when one or two different divergences have been identified. It can be used with all time frames from M1 to MN. It is possible to enable moving average or RSI trend filter to filter out only the strongest setups. Combined with your own rules and techniques, this indicator wi
I recommend you to read the   product's blog  (manual) from start to end so that it is clear from the beginning what the indicactor offers. This multi time frame and multi symbol supply and demand zone dashboard indicator sends alerts when the price has reached a supply/demand zone. It is also possible to use it to be alerted about regular double tops/bottoms instead of zones. It can be used with all time frames from M1 to MN. It is possible to use RSI, divergence (MACD, OsMA, RSI or Awesome) a
The indicator identifies when a divergence occurs between price and an indicator or oscillator. It identifies both regular and hidden divergences. Combined with your own rules and techniques, this indicator will allow you to create (or enhance) your own powerful system. Features Can detect divergences for the following oscillators/indicators:   MACD, OsMA, Stochastics, RSI, CCI, RVI, Awesome, ADX, ATR, OBV, Composite index, MFI and Momentum. Only one oscillator/indicator can be selected. Draws
FREE
This multi indicator/oscillator (hereafter indicator), multi time frame and multi symbol indicator identifies when a divergence occurs between price and one, two or three indicators. It identifies both regular/classical (trend reversal) and hidden (trend continuation) divergences. It has RSI and MA trend filter options which makes it possible to filter out only the strongest setups. Combined with your own rules and techniques, this indicator will allow you to create (or enhance) your own powerfu
This multi time frame and multi symbol indicator alerts about Heiken Ashi Smoothed color changes. As a bonus it can also scan for Hull Moving Average trend (color) changes. Combined with your own rules and techniques, this indicator will allow you to create (or enhance) your own powerful trading system. Features Can monitor all symbols visible in your Market Watch window at the same time. Apply the indicator to just one chart and instantly monitor the entire market. Can monitor every time frame
Ich empfehle Ihnen, die zu lesen       Produkt-Blog   (Handbuch) von Anfang bis Ende damit       Es ist von Anfang an klar, was der EA bietet. Die Hauptstrategie dieses Expert Advisors (EA) besteht darin, Trades zu platzieren, wenn 3 gleitende Durchschnitte (MA) in aufeinanderfolgender Ausrichtung und in einem bestimmten Abstand voneinander sind (dies kann zum Beispiel für eine nicht sehr bekannte Strategie verwendet werden, die von einigen institutionellen Händlern verwendet wird , die die MAs
I recommend you to read the   product's blog  (manual) from start to end so that it is clear from the beginning what the indicactor offers. This multi time frame and multi symbol indicator identifies double or triple top/bottom formations or a following neckline breakout (confirmed top/bottom). It offers filters for RSI overbought/oversold, candle patterns (pin bar, engulfing, tweezer, morning/evening star, three line strike) and divergences (MACD, OsMA, Awesome (AO), RSI, CCI, Stochastic) whic
Dieser Multi-Time-Frame- und Multi-Symbol-Indikator kann die folgenden 5 Kreuze identifizieren: wenn ein sich schnell bewegender Durchschnitt eine Linie des langsamen gleitenden Durchschnitts kreuzt. wenn der Preis einen einzelnen gleitenden Durchschnitt erreicht hat (oben/unten geschlossen oder gerade abgesprungen). wenn eine Triple Moving Average Formation aufgetreten ist (alle 3 MA:s in aufeinanderfolgender Ausrichtung) wenn die MACD-Hauptlinie die Signallinie kreuzt. wenn die Signallinie die
Please if possible consider the  paid version  which I will continue to develop (there will be no future updates for this free version). This Expert Advisor identifies when a divergence occurs between price and an oscillator/indicator. It identifies both regular/classical (trend reversal) and hidden (trend continuation) divergences. It has RSI, bollinger, stochastics, moving average and ADX filter options which makes it possible to filter out only the strongest setups. The default settings ar
FREE
I recommend you to read the   product's blog  (manual) from start to end so that it is clear from the beginning what the indicactor offers. This multi time frame and multi symbol divergence dashboard indicator sends an alert when one or two different divergences have been identified. It can be used with all time frames from M1 to MN. Maximum 9 time frames can be shown in the dashboard at the same time. It is possible to enable moving average, RSI or Bollinger bands trend filter to filter out on
This indicator can send alerts when a Heiken Ashi Smoothed color change occurs. Combined with your own rules and techniques, this indicator will allow you to create (or enhance) your own powerful system. Features Can send all types of alerts. Option to delay the alert one or more bars in order to confirm the color (trend) change. Input parameters Candle shift for alert: Default is 1. Setting it to 0 will alert you on color change on the current candle. This should be regarded as a pending (uncon
FREE
The indicator identifies when a divergence occurs between price and an indicator or oscillator. It identifies bullish and bearish hidden or regular (classical) divergences. Combined with your own rules and techniques, this indicator will allow you to create (or enhance) your own powerful system. Features Can detect divergences for the following indicators/oscillators: MACD, OsMA (Moving average of Oscillator), Stochastics, RSI, CCI, RVI, Awesome (AO), ADX, ATR, OBV, MFI, Momentum and   Composi
FREE
Averaging down EA
Jan Flodin
5 (1)
This cost averaging Expert advisor (EA) places additional trades in the same direction as the original (manually opened) order when the price goes against you. It can be used as a grid system or as pure martingale system (exponential increasing of lot size) or smoothed martingale (for instance linear increasing of the lot size). Due to the risk involved, this EA is more suitable for intermediate to advanced traders who are well aware of how to handle risk management and trading an already profit
This indicator can send alerts when a Heiken Ashi Smoothed color change occurs. Combined with your own rules and techniques, this indicator will allow you to create (or enhance) your own powerful system. Features Can send all types of alerts. Option to delay the alert one bar in order to confirm the color (trend) change. Input parameters Wait for candle close: 'true' or 'false'. Setting it to 'true' will delay the alert to the opening of the bar following the bar where the color change occurred.
FREE
Ich empfehle Ihnen, den   Blog (Handbuch) des Produkts   von Anfang bis Ende zu lesen, damit von Anfang an klar ist, was der EA bietet. Dieser Expert Advisor erkennt, wann eine Divergenz zwischen dem Preis und einem Oszillator/Indikator auftritt. Es identifiziert sowohl reguläre/klassische (Trendumkehr) als auch versteckte (Trendfortsetzung) Divergenzen. Es verfügt über Angebots-/Nachfragezone, RSI, Bollinger, Stochastik, gleitenden Durchschnitt (regulärer MA und Hull MA), ADX und Volumenfilter
I recommend you to read the   product's blog  (manual) from start to end so that it is clear from the beginning what the indicactor offers. This multi time frame and multi symbol indicator identifies double or triple top/bottom formations or a following neckline breakout (confirmed top/bottom). It offers RSI, pin bar, engulfing, tweezer, morning/evening star filters as well divergence filter options which makes it possible to filter out only the strongest setups. The indicator can also be used
This multi time frame and multi symbol indicator scans for pin bars. Combined with your own rules and techniques, this indicator will allow you to create (or enhance) your own powerful system. Features Can monitor all symbols visible in your Market Watch window at the same time. Apply the indicator to just one chart and instantly monitor the entire market. Can monitors every time frame, from M1 to MN, and sends you a real-time alert when a pin bar is identified. All Metatrader native alert types
This indicator recognizes a special type of Inside Bar formation which is formed by a big Master candle followed by 4 smaller candles (please see the strategy explanation below). Features Plots buy/sell stop lines on the chart as well as well as take profit and stop loss levels. The TP/SL levels are based on the Average True Range (ATR) indicator. Object colors are changeable. Sends you a real-time alert when a Master candle formation is identified - sound / popup / email / push notification. On
Dieser Angebots- und Nachfragezonenindikator zeichnet die Zonen auf dem Chart und sendet Warnungen, wenn der Preis eine Zone erreicht oder durchbrochen hat. Es ist auch möglich, es zu verwenden, um über reguläre doppelte Tops/Bottoms anstelle von Zonen benachrichtigt zu werden. Es ist möglich, RSI-, Volumen- und Divergenzfilter zu verwenden, um nur die stärksten Setups herauszufiltern. In Kombination mit Ihren eigenen Regeln und Techniken ermöglicht Ihnen dieser Indikator, Ihr eigenes leistungss
I recommend you to read the   product's blog  (manual) from start to end so that it is clear from the beginning what the indicactor offers. This multi time frame and multi symbol trend indicator sends an alert when a strong trend or trend reversal has been identified. It can do so by selecting to build up the dashboard using Moving average (single or double (both MA:s aligned and price above/below both)), RSI, Bollinger bands, ADX, Composite index (Constance M. Brown), Awesome (Bill Williams), 
Dieser Multisymbol- und Multi-Timeframe-Indikator kann nicht nur bullische und bärische Dreilinien-Strike-Formationen finden, sondern auch nach den folgenden Candlestick-Mustern suchen (siehe Screenshots zur Erklärung der Muster): Drei weiße Soldaten (Umkehrung>Fortsetzungsmuster) Drei schwarze Krähen (Umkehrung> Fortsetzungsmuster) Die Formationen erscheinen nicht sehr oft auf höheren Zeitrahmen, wenn die strikte Option in den Indikatoreinstellungen aktiviert ist. Aber wenn sie es tun, ist es e
I  recommend you to read the   product's blog  (manual) from start to end so that it is clear from the beginning what the indicator offers. This multi time frame and multi symbol indicator identifies double top/bottom, head & shoulders, pennant/triangle and flag patterns. It is also possible to setup alerts only when a neckline/triangle/flagpole breakout has occured (neckline breakout = confirmed signal for top/bottoms and head & shoulders).  The indicator can also be used in single chart mode.
I recommend you to read the  product's blog  (manual) from start to end so that it is clear from the beginning what the indicator offers. This multi time frame and multi symbol supply and demand zone dashboard indicator sends alerts when the price has reached a supply/demand zone. It is also possible to use it to be alerted about regular double tops/bottoms instead of zones. It can be used with all time frames from M1 to MN. Maximum 9 time frames can be shown in the dashboard at the same time. 
Der Indikator identifiziert, wenn eine Divergenz zwischen dem Preis und einem Oszillator/Indikator auftritt. Es identifiziert sowohl reguläre als auch versteckte Abweichungen. Es verfügt über eine RSI-Filteroption, die es ermöglicht, nur die stärksten Setups herauszufiltern. Der Indikator bietet auch Optionen zum Warten auf eine Engulfing-Formation, den Ausbruch des Donchian-Kanals oder bis der Preis einen gleitenden Durchschnitt überschreitet   (siehe Screenshot Nr. 3).       um die Divergenz z
I recommend you to read the   product's blog  (manual) from start to end so that it is clear from the beginning what the indicactor offers. This multi time frame and multi symbol indicator can identify the following 5 crosses: when a fast moving average crosses a slow moving average line. when price has reached a single moving average (closed above/below or just bounced). when a triple moving average formation has appeared (all 3 MA:s in consecutive alignment). when the MACD main line crosses t
Bitte erwägen Sie nach Möglichkeit den Kauf       MT5-Version   , die ich weiter entwickeln werde (es wird keine zukünftigen Updates für diese MT4-Version geben). Ich empfehle Ihnen auch, die zu lesen       Produkt-Blog   (Handbuch) von Anfang bis Ende, damit von Anfang an klar ist, was EA bietet. Die Hauptstrategie dieses Expert Advisors (EA) besteht darin, Trades zu platzieren, wenn 3 gleitende Durchschnitte (MA) in aufeinanderfolgender Ausrichtung und in einem bestimmten Abstand voneinander
I recommend you to read the   product's blog  (manual) from start to end so that it is clear from the beginning what the indicactor offers. This indicator for Metatrader 4 identifies when a divergence occurs between price and an oscillator/indicator. It identifies both bullish and bearish divergences. It has a RSI filter option which makes it possible to filter out only the strongest setups. The indicator also offers options to wait for an Engulfing formation, Donchian channel breakout or for p
Dieser Multi-Time-Frame- und Multi-Symbol-Indikator scannt nach Pin-Bars, Morgen-/Abendsternen, Engulfings, Pinzetten, Drei-Linien-Strikes, Inside Bars und Wimpel und Dreiecken. Der Indikator kann auch im Single-Chart-Modus verwendet werden. Bitte lesen Sie mehr über diese Option im Produkt   Blogs   . In Kombination mit Ihren eigenen Regeln und Techniken ermöglicht Ihnen dieser Indikator, Ihr eigenes leistungsstarkes System zu erstellen (oder zu verbessern). Merkmale Kann alle in Ihrem Market
Auswahl:
FXsolutions
86831
Mike Semlitsch 2018.03.23 14:51 
 

Jan did a great job with this scanner. There are many configuration options. You can configure it according to your needs and get exactly those signals which you want to receive. 5 stars!

Antwort auf eine Rezension
Version 1.5 2024.02.11
*** IMPORTANT - please always make a backup of the existing indicator (the .ex4 file) before you make an update ***

Change log:
- added a text to the chart with the formation movment (in points)
- new additional input for symbols
Version 1.4 2023.02.24
*** Please always make a backup of the existing indicator (the .ex4 file) before you make an update ***

Change log:
- added an option to write the signals as global variables which can be used by an Expert Advisor
- added Bollinger trend filter as an alternative instead of RSI filter
- the formation will be drawn with a rectangle and an arrow showing trade direction on the chart which opens up when clicking on a signal in the panel
- added a possibility to use the indicator in single chart mode (checking only the current chart symbol and time frame). It will then draw a rectangle and an arrrow at each pattern on the chart where the indicator is running. This option is in some ways limited though. More information in the product's blog.
- added the possibility to set the colors in the panel
Version 1.3 2020.07.11
- added an option to scan symbols visible in the Market Watch window instead of using the internal parameter
- added the possibility to set a custom alert text for alerts (not in the panel). The custom text will be added to the end of the regular alert text
- added the possibility to set a custom panel title
Version 1.2 2019.04.17
- minor bug fixes
Version 1.1 2018.05.14
- added an interactive chart panel for signals
- added support for strategy tester