Currency Strength Meter MT4 Indicator by PipTick
- Indikatoren
-
Michal Jurnik
 "Talent is cheaper than table salt. What separates the talented individual from the successful one is a lot of hard work." - Stephen King. Those few words reflect myself very well. I am probably not the most talented developer in the world but I truly believe in hard work, professional attitude and
 - Version: 6.0
- Aktualisiert: 1 September 2022
- Aktivierungen: 5
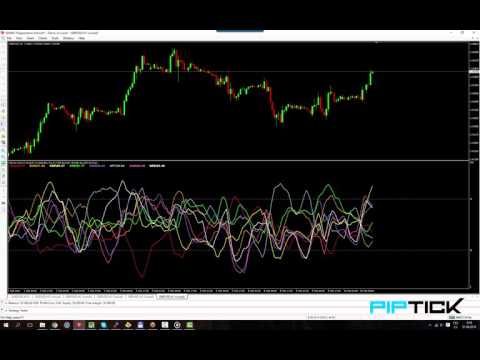
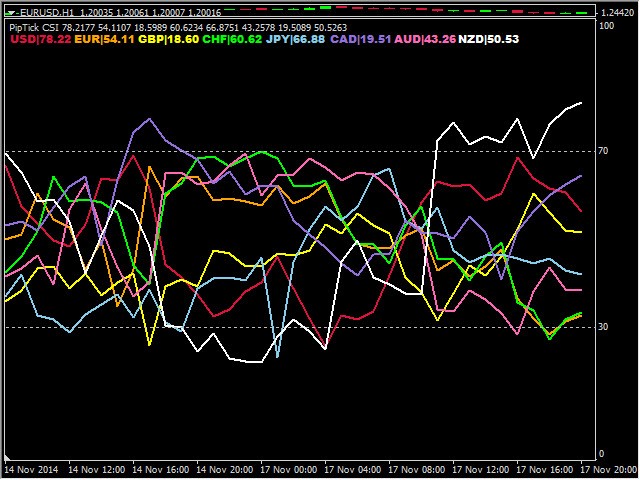
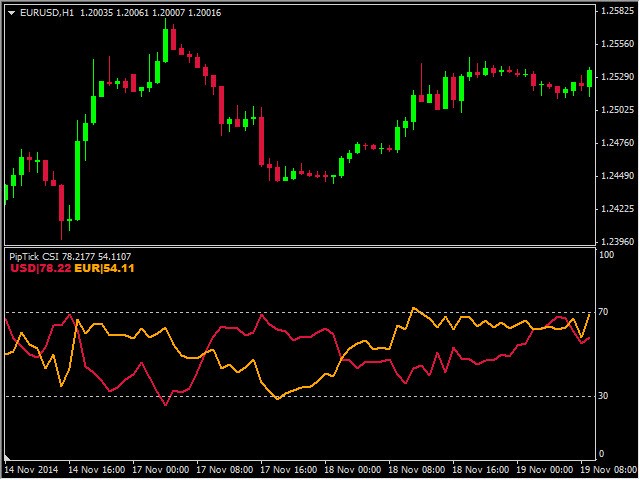
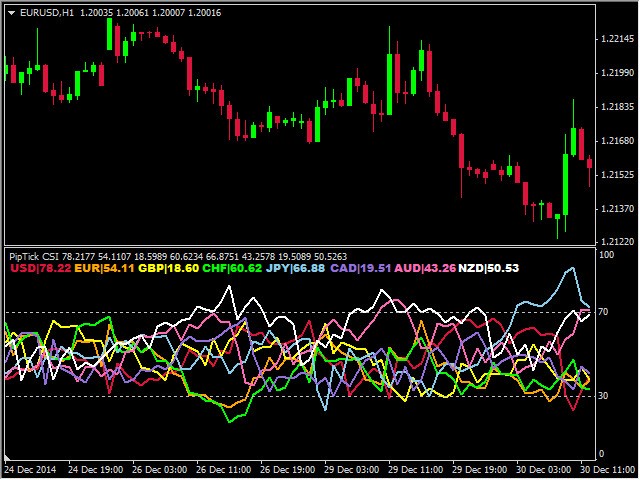
Die Kenntnis der Stärke und Schwäche der einzelnen Währungen ist für jeden Devisenhändler unerlässlich. UnserIndikator "Currency Strength Meter" misst die Stärke der acht wichtigsten Währungen (USD, EUR, GBP, CHF, JPY, CAD, AUD, NZD) mit Hilfe des Relative Strength Index (RSI). Der Indikator Currency Strength Meter zeigt Ihnen einfach und schnell an, wann eine Währung überverkauft, überkauft oder im "normalen Bereich" ist. Auf diese Weise können Sie erkennen, welche Währung am stärksten und welche am schwächsten ist.
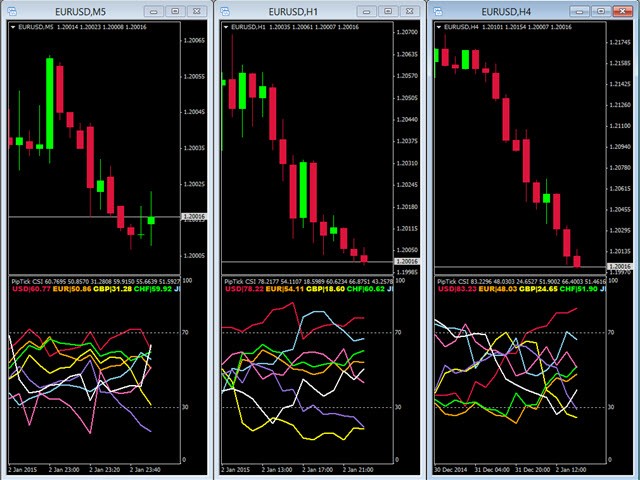
Unser Indikator wird aus 28 Währungspaaren berechnet und funktioniert auf jeder MT-Plattform. DerCurrency Strength Meter Indikator verwendet nur sieben Währungspaare, um die restlichen 21 Paare zu berechnen. Damit der Indikator korrekt funktioniert, benötigen Sie nur diese sieben Paare auf Ihrer MT-Plattform: EURUSD, GBPUSD, AUDUSD, NZDUSD, USDJPY, USDCHF, und USDCAD.
Hinweis: Wenn der Indikator im Strategy Tester verwendet wird, müssen die Daten aller Paare zuvor im History Center heruntergeladen werden (How-to). Wird der Indikator wie üblich zum Chart hinzugefügt, sind keine Downloads erforderlich.
Interpretation des Indikators
Da unser CSM-Indikator auf bekannten Indikatoren basiert, ist seine Interpretation sehr einfach.
RSI
- Überverkaufter Bereich (der Wert des CSM liegt unter 30)
- Normaler Bereich (der Wert des CSM liegt zwischen 30 und 70)
- Überkaufter Bereich (der Wert des CSM liegt über dem Wert von 70)
- Starke Währung (der Wert des CSM liegt über dem Niveau von 50)
- Schwache Währung (der Wert des CSM liegt unter dem Niveau von 50)
CCI
- Überverkaufter Bereich (der Wert des CSM liegt unter 100)
- Normaler Bereich (der Wert des CSM liegt zwischen -100 und 100)
- Überkaufter Bereich (der Wert des CSM liegt über 100)
- Starke Währung (der Wert des CSM liegt über dem Niveau von 0)
- Schwache Währung (der Wert des CSM liegt unter dem Niveau von 0)
MFI
- Überverkaufter Bereich (der Wert des CSM liegt unter dem Niveau von 30)
- Normaler Bereich (der Wert des CSM liegt zwischen 30 und 70)
- Überkaufter Bereich (der Wert des CSM liegt über dem Niveau von 70)
- Starke Währung (der Wert des CSM liegt über dem Niveau von 50)
- Schwache Währung (der Wert des CSM liegt unter dem Niveau von 50)
MACD
- Starke Währung (der Wert des CSM liegt über dem Niveau von 0)
- Schwache Währung (der Wert des CSM liegt unter dem Niveau von 0)
Wie kann man den IndikatorCurrency Strength Meterverwenden ?
Es gibt zwei grundlegende Ansätze für den Handel mit starken und schwachen Währungen:
- Kauf einer starken Währung und Verkauf einer schwachen Währung - Trendfolgestrategie. Wenn beispielsweise der EUR steigt und der AUD sinkt, kaufen Sie das Währungspaar EURAUD. Handeln Sie nicht, wenn eine der Währungen überkauft/überverkauft ist.
- Verkaufen Sie starke Währungen und kaufen Sie schwache Währungen - Counter Trend-Strategie. Wenn zum Beispiel der USD überkauft und der JPY überverkauft ist, verkaufen Sie USDJPY.
Sie können großartige Ergebnisse erzielen, wenn Sie das Konzept der überkauften/überverkauften Währung in Verbindung mit Price Action oder Candlestick-Mustern verwenden. Dazu müssen Sie nur auf den überkauften/überverkauften Zustand einer Währung warten und dann ein Candlestick-Muster wie einen Hammer oder einen Shooting Star zeichnen. Dies ist natürlich nur eine von Tausenden von Möglichkeiten, unseren Währungsstärke-Indikator zu verwenden.
Es ist auch möglich, den CSM-Indikator für manuelle Backtests zu verwenden. Dazu müssen Sie lediglich den Parameter "Bars_Ago = 0" in den Indikatoreinstellungen festlegen und historische Daten für sieben Währungspaare herunterladen, die unser Indikator berechnen muss.
Wichtigste Merkmale
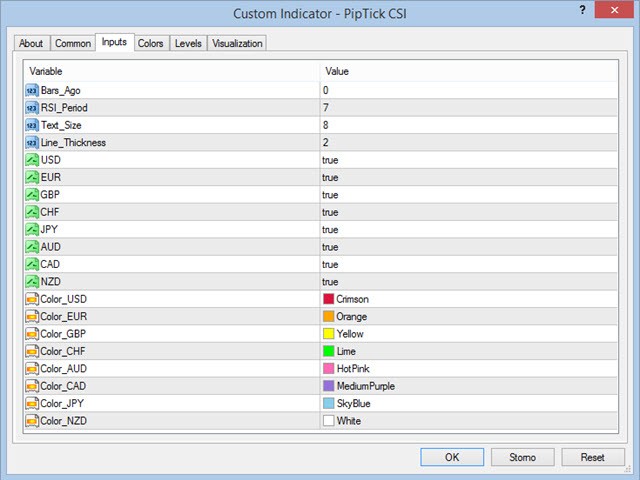
- Der Indikator zeigt die Stärke und Schwäche von acht Hauptwährungen an (USD, EUR, GBP, CHF, JPY, CAD, AUD, NZD)
- Ein einfacher Vergleich einer Währung mit einer anderen
- Überkaufte und überverkaufte Bereiche für den Einstieg oder Ausstieg in den Handel
- Funktioniert auf jedem Zeitrahmen
- Der Indikator wird nicht neu gemalt
- Bereit für Backtesting
- Anpassbare Parameter
- Ausgezeichnete Ergebnisse in Verbindung mit PA und Candlestick-Mustern
- Ideales Werkzeug für Scalping
- Sehr schnelle Berechnung
- Der Indikator funktioniert auch mit Präfix und Suffix von Symbolen
- Verfügbar für MT4 und MT5
Bitte besuchen Sie dieProduktseite des Indikators Currency Strength Meter für die Einstellungen der Ein- und Ausgänge.
Very useful to assess currency strengths, and to time entry and exits. I would say the reversal (overbought/oversold) strategy is the most efficient.