Moving Average Trend Scanner MT5
- Indikatoren
- Version: 6.3
- Aktualisiert: 22 September 2025
- Aktivierungen: 15

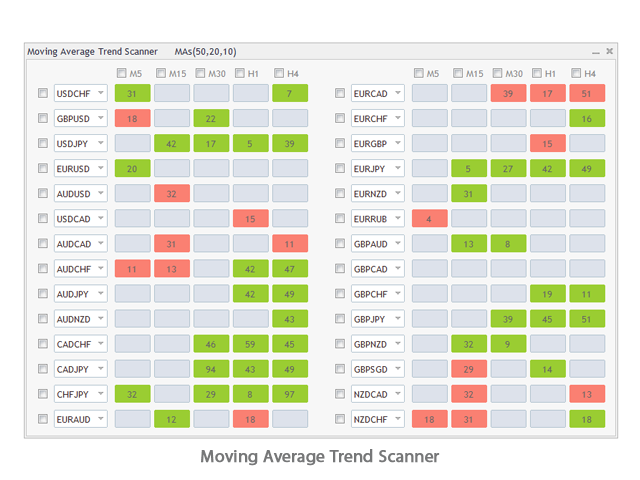
Moving Average Trend Scanner ist ein Multi-Symbol Multi Timeframe Triple MA Crossover Dashboard, das Händlern hilft, potenzielle Markttrends von einem Chart aus zu überwachen und zu identifizieren.
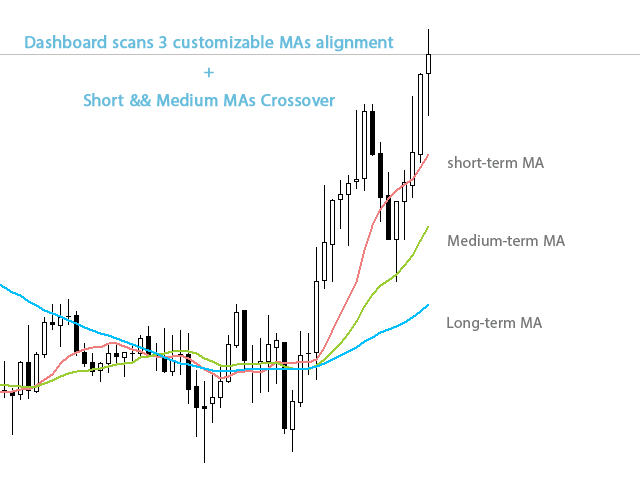
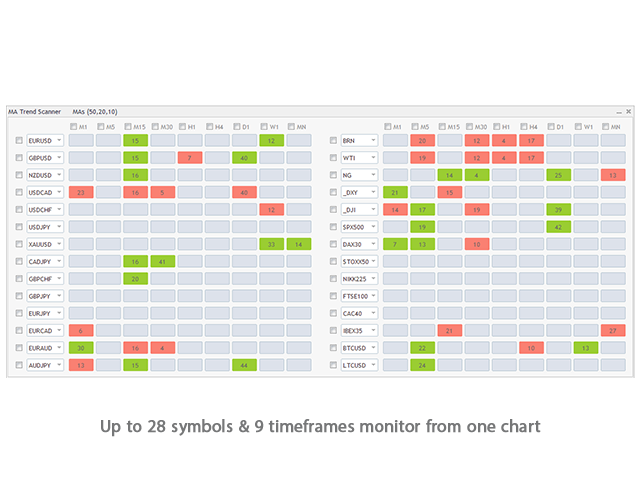
Dieses Panel scannt 3 gleitende Durchschnitte in bis zu 28 konfigurierbaren Instrumenten und 9 Zeitrahmen für die dreifache gleitende Durchschnittsausrichtung und den gleitenden Durchschnitts-Crossover mit einer tiefen Scan-Funktion, um alle Marktbeobachtungssymbole zu scannen (bis zu 1000 Instrumente!).
After the purchase, don't forget to message me to receive eine Kopie der MT4-Vollversion für 1 Handelskonto als Bonus.
Eigenschaften des Moving Average Trend Scanner:
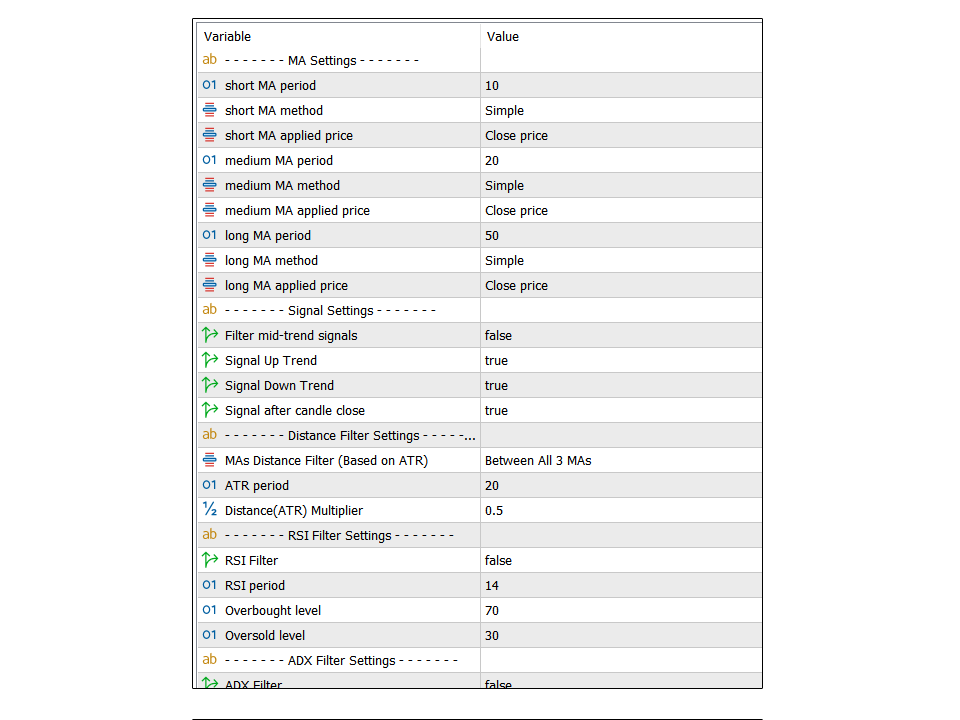
- Anpassbare kurzfristige, mittelfristige und langfristige MAs.
- Funktioniert bei allen Instrumenten wie Währungspaaren, CFD, Metallen, Kryptowährungen usw.
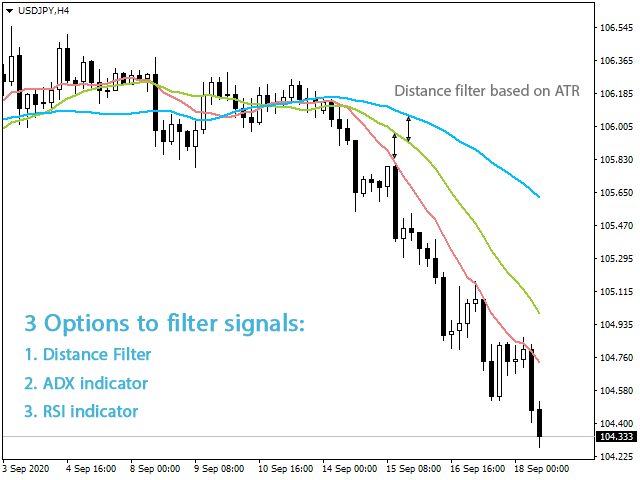
- Option zum Filtern von Signalen basierend auf einem Mindestabstand zwischen gleitenden Durchschnitten, um eine vorzeitige Ausrichtung der MAs zu vermeiden.
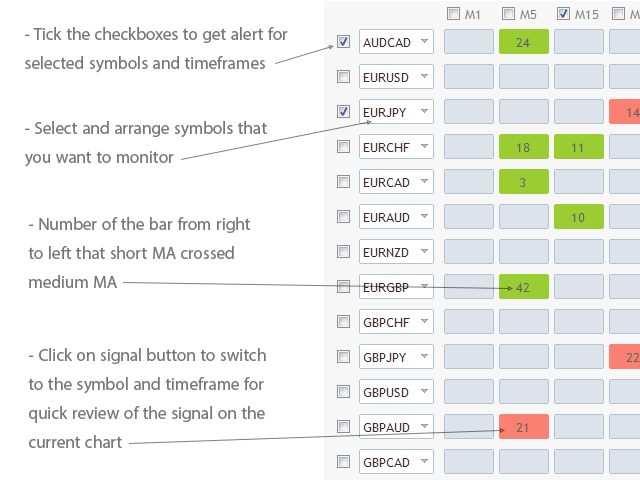
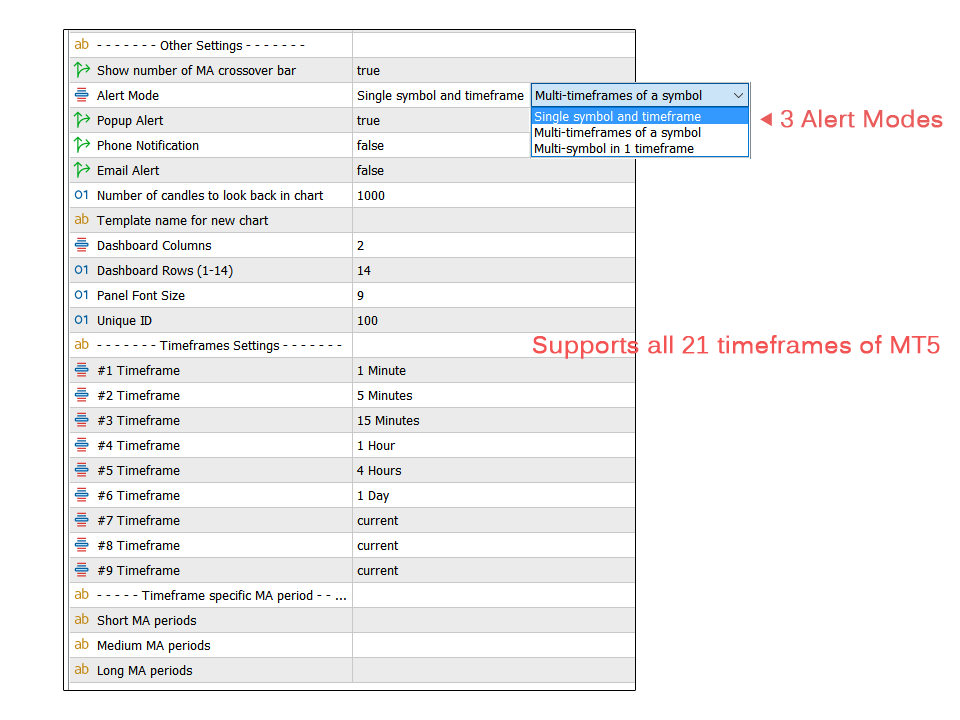
- Option zur Anzeige der Nummer des Balkens, in dem der kurze MA den mittleren MA gekreuzt hat, auf den Schaltflächen des Dashboards.
- Optionale Filterung von Signalen mit dem RSI-Indikator für überkaufte/überverkaufte Niveaus.
- Optionale Filterung von Signalen mit dem ADX-Indikator.
- Sie können verschiedene MA-Perioden für verschiedene Zeitrahmen einstellen.
- Deep-Scan-Modus zum Scannen aller Marktbeobachtungssymbole auf die Ausrichtung der MAs in einem ausgewählten Zeitrahmen.
- Sie können zwischen 3 Alarmmodi wählen:
- Einzelnes Symbol und Zeitrahmen
- Mehrere Zeitrahmen für ein Symbol
- Mehrere Symbole für einen Zeitrahmen
- Unterstützt alle 21 Zeitrahmen des MT5.
- Schnelle Überprüfung der Signale auf demselben Chart durch Anklicken der Signalschaltflächen.
- Einfache Einrichtung und Anordnung von Symbolen in beliebiger Reihenfolge mit jedem Instrument, das Ihr Broker zur Verfügung stellt.
- Popup-, E-Mail- und Telefon-Benachrichtigungen für ausgewählte Symbole und Zeitrahmen.
Einige Anmerkungen:
- Die Dashboard-Signale des gleitenden Durchschnitts basieren auf der Ausrichtung von 3 MAs. Die grüne Farbe steht für einen Aufwärtstrend, bei dem der kurze MA über dem mittleren MA und der mittlere MA über dem langen MA liegt, und die rote Farbe für eine Abwärtsausrichtung. Beachten Sie, dass das Dashboard bei Aktivierung des Abstands- oder ADX-Filters möglicherweise kein sofortiges MA-Cross-Signal ausgibt.
- Die Signale dieses gleitenden Durchschnittsscanners (grüne/rote Farben) sind keine Kauf-/Verkaufssignale. Sie weisen auf einen potenziellen Markttrend hin, der überprüft werden sollte. Der klassische Trendfolgeansatz besteht darin, einen starken Trend zu finden und dann auf niedrigeren Zeitebenen nach einem Pullback- oder Breakout-Trade-Setup in Richtung des Haupttrends zu suchen. Wenn Sie ein bestimmtes MA-Handelssystem haben, können Sie den MA-Scanner entsprechend einrichten, um Kauf-/Verkaufssignale zu erhalten.
- Wenn Sie 2 MAs einrichten möchten, setzen Sie die lange MA-Periode auf Null.
- Standardmäßig scannt das MA Dashboard gleitende Durchschnitte und berücksichtigt nicht die aktuelle Preisposition im Verhältnis zu den MAs. Wenn Sie dies wünschen, setzen Sie die kurze MA-Periode auf "1", damit sie dem Preis ähnelt.
- Wenn Sie mehr als 28 Instrumente überwachen möchten, können Sie den Indikator auf ein anderes Diagramm mit einer anderen "Unique ID" in den Einstellungen laden und verschiedene Symbole für ihn festlegen.
- Die Symbole, die Sie dem Dashboard hinzufügen möchten, müssen im MetaTrader-Marktbeobachtungsfenster sichtbar sein. Wenn Sie den Indikator zum ersten Mal ausführen oder ein neues Symbol in das Dashboard laden, kann es ein paar Sekunden dauern, bis die Daten aktualisiert und Signale angezeigt werden.
Wenn Sie gut im Handel mit starken Trends sind, sollten Sie das Tool Reward Multiplier ausprobieren.