Advanced Bollinger Bands Scanner MT5
- Indikatoren
- Version: 3.0
- Aktualisiert: 8 Oktober 2023
- Aktivierungen: 15

Advanced Bollinger Bands Scanner ist ein Multi-Symbol Multi Timeframe Bollinger Bands Dashboard, das den Bollinger Bands Indikator von einem Chart aus überwacht und analysiert.
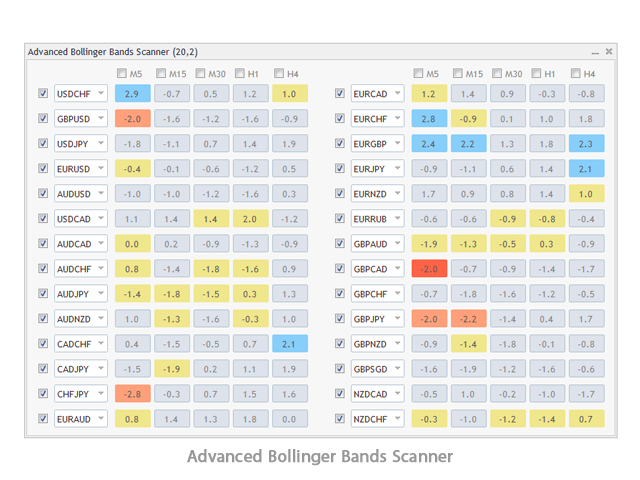
Dieses Panel scannt den Bollinger Bands Indikator in bis zu 28 konfigurierbaren Instrumenten und 9 Zeitrahmen auf überkaufte/überverkaufte Preise, Preiskonsolidierung (Bollinger Bands Squeeze) und Konsolidierungsausbruch (Squeeze Break) mit einer Tiefenscan-Funktion, um alle Marktbeobachtungssymbole zu scannen (bis zu 1000 Instrumente!).
After the purchase, don't forget to message me to receive eine Kopie der MT4-Vollversion für 1 Handelskonto als Bonus.
Erweiterte Bollinger Bands Scanner Funktionen:
- Echtzeit-Überwachung von 28 anpassbaren Instrumenten und 9 Zeitrahmen zur gleichen Zeit.
- Suche nach Kursen, die die unteren und oberen Bänder berühren, BB-Squeeze und Ausbruch des Preises aus dem Squeeze.
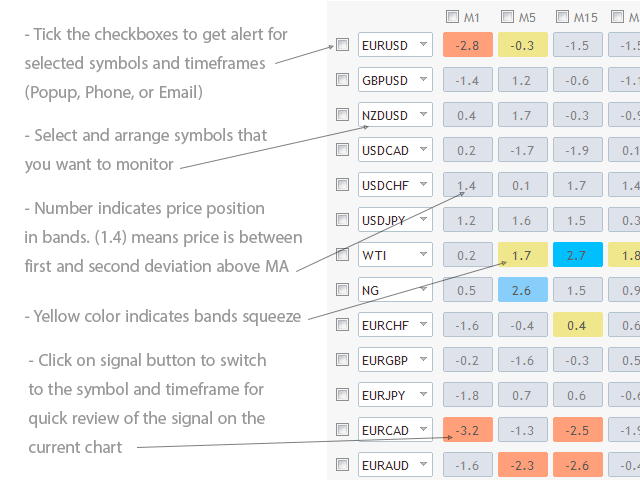
- Anzeige der Preisposition relativ zu den Bändern auf den Schaltflächen des Dashboards.
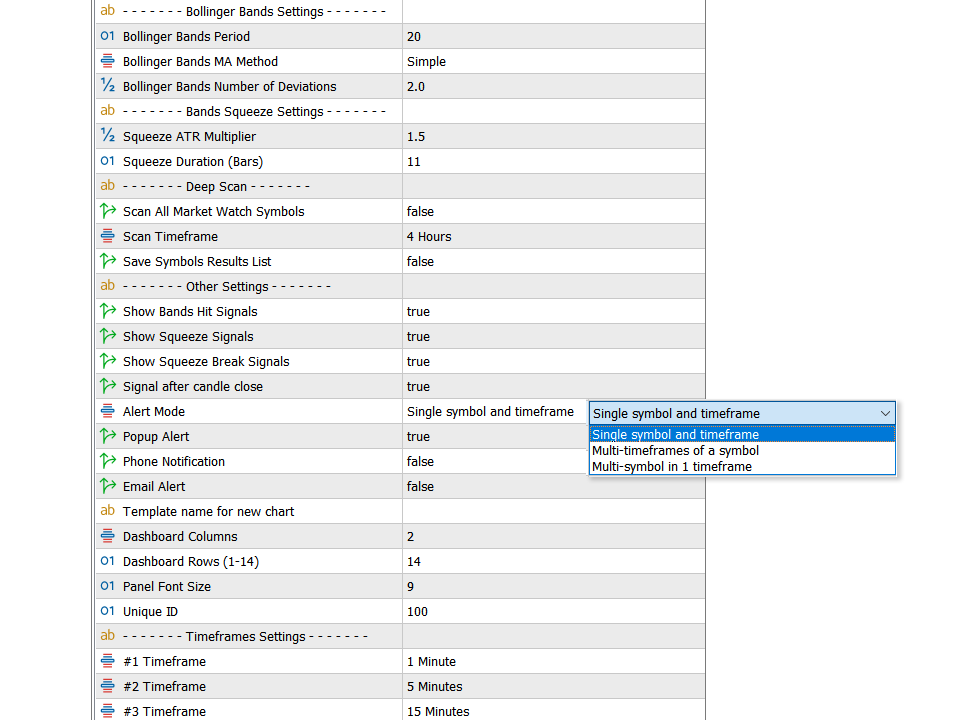
- Deep Scan-Modus zum Scannen aller Marktbeobachtungssymbole in einem ausgewählten Zeitrahmen.
- Unterstützt alle 21 Timeframes der Metatrader 5 Plattform.
- Sie können zwischen 3 Alarmmodi wählen:
- Einzelnes Symbol und Zeitrahmen
- Mehrere Timeframes eines Symbols
- Mehrere Symbole für einen Zeitrahmen
- Schnelle Überprüfung von Signalen auf demselben Chart durch Anklicken der Signalschaltflächen.
- Einfache Einrichtung und Anordnung von Symbolen in beliebiger Reihenfolge mit jedem Instrument, das Ihr Broker zur Verfügung stellt.
- Popup-, E-Mail- und Telefonbenachrichtigungen für ausgewählte Symbole und Zeitrahmen.
Einige Anmerkungen:
- Das Bolinger Bands Dashboard zeigt fünf Signale mit fünf Farben an. Hellblau und hellrot bedeuten, dass der Preis die oberen und unteren Bänder der Bollinger-Bänder berührt hat, gelb bedeutet, dass die Bänder gequetscht wurden, tiefblau und tiefrot bedeutet, dass die Bollinger-Bänder unmittelbar nach dem Quetschen der Bänder durchbrochen wurden.
- Wenn Sie mehr als 28 Instrumente überwachen möchten, können Sie den Indikator auf einen anderen Chart mit einer anderen "Unique ID" in den Einstellungen laden und verschiedene Symbole für ihn festlegen.
- Die Symbole, die Sie dem Dashboard hinzufügen möchten, müssen im MetaTrader-Marktbeobachtungsfenster sichtbar sein. Wenn Sie den Indikator zum ersten Mal ausführen oder ein neues Symbol in das BB-Dashboard laden, kann es ein paar Sekunden dauern, bis die Daten aktualisiert sind und Signale angezeigt werden.
Wenn Sie gut mit Bollinger Bands Squeeze oder jeder Art von Konsolidierungsausbrüchen handeln können, sollten Sie dasReward Multiplier Tool ausprobieren.