Multi Time Frame RSI Indicator
- Indikatoren
- Version: 1.0
- Aktivierungen: 5

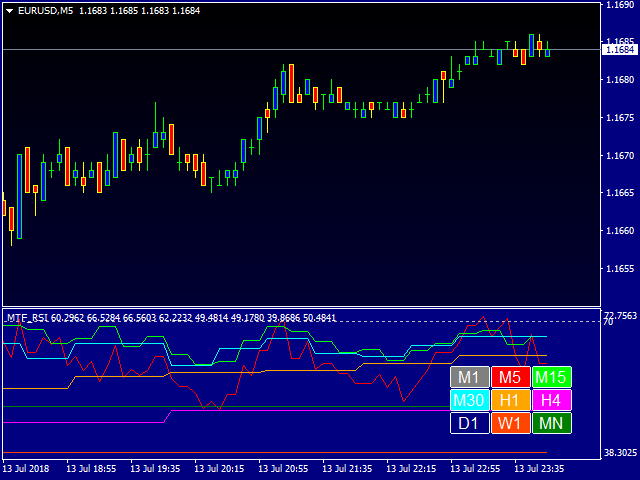
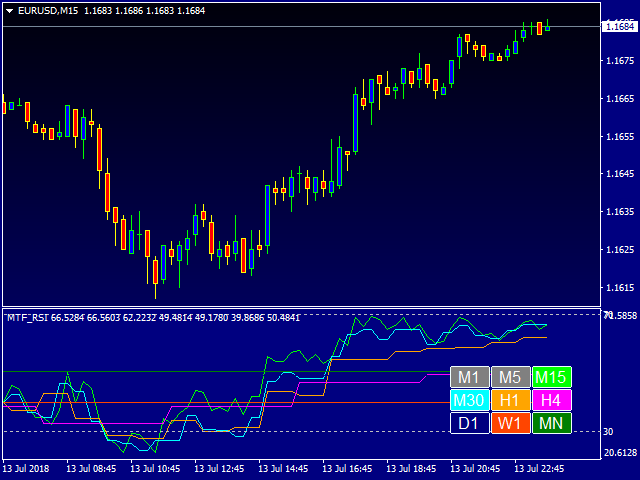
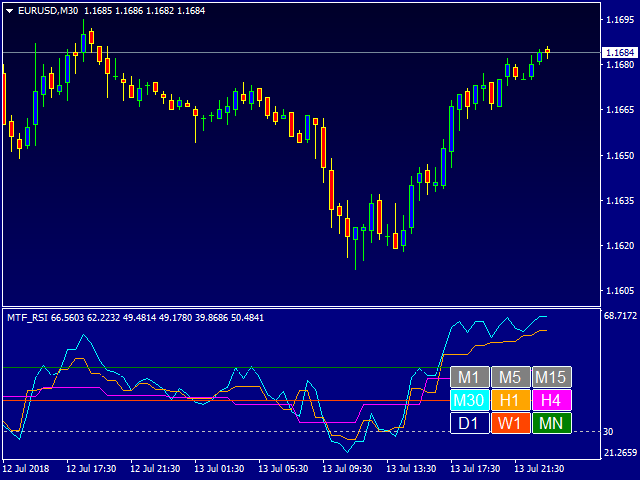
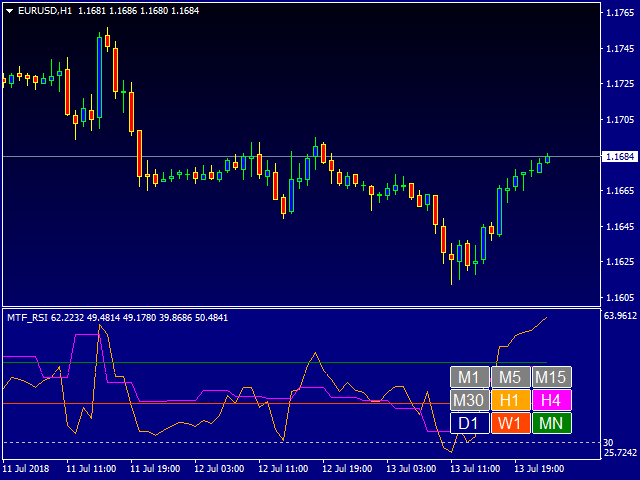
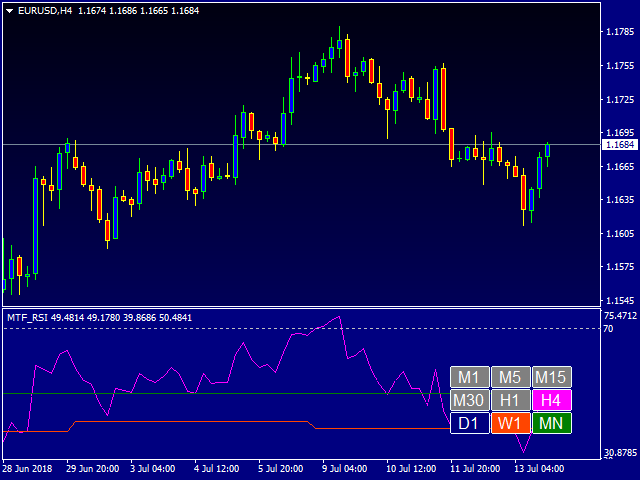
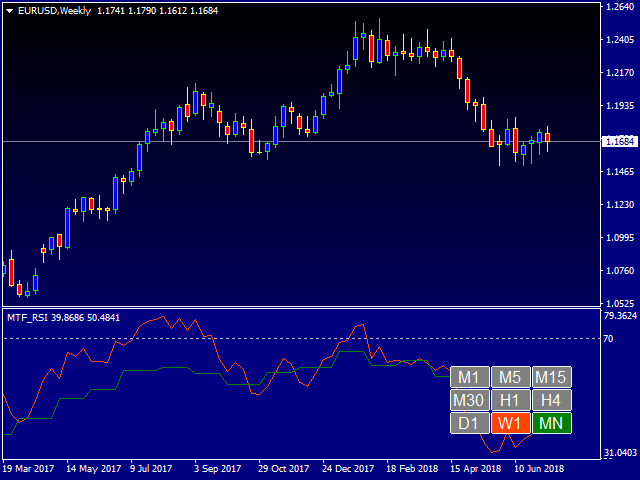
Dieser Indikator ist für die Überwachung des RSI-Niveaus auf dem aktuellen und höheren Zeitrahmen konzipiert. Das Bedienfeld ist benutzerfreundlich und besteht aus Schaltflächen, mit denen Sie die Anzeige der Linien entsprechend den Namen der Schaltflächen steuern können. Die Farbe der Schaltflächen entspricht der Farbe der Linien.
Parameter
"Einstellungen des Hauptindikators"
- RSI Periode - Mittelungsperiode für die Indexberechnung (Standard ist 14);
- RSI Preistyp - Preis, der für die Berechnungen verwendet wird (Standardwert ist der Schlusskurs);
"___| Farbpalette "
- Textfarbe - Standardwert ist Weiß;
- ColorM1 - Linienfarbe für den M1-Zeitrahmen (Standardwert ist DodgerBlue);
- ColorM5 - Linienfarbe für den M5-Zeitrahmen (Standardwert ist Rot); "ColorM15 " - Linienfarbe für den M5-Zeitrahmen (Standardwert ist Rot);
- ColorM15 - Linienfarbe für den M15-Zeitrahmen (Standard ist Limette);
- FarbeM30 - Linienfarbe für den M30-Zeitrahmen (Standardwert ist Aqua);
- ColorH1 - Linienfarbe für den H1-Zeitrahmen (Standard ist Orange);
- ColorH4 - Linienfarbe für den H4-Zeitrahmen (Standardwert ist Magenta);
- ColorD1 - Linienfarbe für den D1-Zeitrahmen (Standardwert ist Navy);
- FarbeW1 - Linienfarbe für den W1-Zeitrahmen (Standard ist Orange-Rot);
- FarbeMN - Linienfarbe für den MN-Zeitrahmen (Standardwert ist Grün);
Geben Sie die Mittelungsperiode für die Indexberechnung an, und der Indikator zeigt Ihnen den RSI für alle höheren Perioden an. Alternativ können Sie die Anzeige der Indexwerte für die gewünschten Zeitrahmen festlegen.

Der Benutzer hat keinen Kommentar hinterlassen