Control Trading Market Zones MT5
- Indikatoren
- Version: 1.1
- Aktivierungen: 10

Marktzonen MT5
- Dieser Indikator ermöglicht ein einfaches Ablesen des Marktes auf der Grundlage statistischer Gaußscher Niveaus, genau wie die Market Profile®-Methode.
- Mithilfe einer einzigartigen Formel schätzt der Indikator dynamisch die Zonen, die am besten repräsentieren, wo die Marktbewegungen die meiste Zeit (ca. 70% der Zeit) verbleiben werden.
- Dadurch können wir den Markt auf einfachere Weise betrachten und vermeiden, in nicht relevante Bewegungen zu geraten.
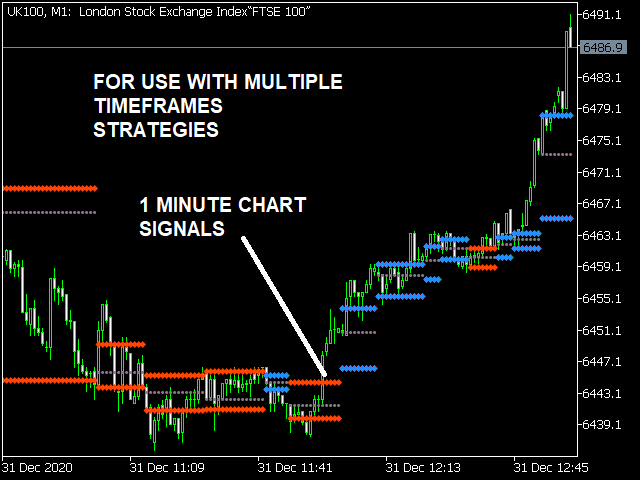
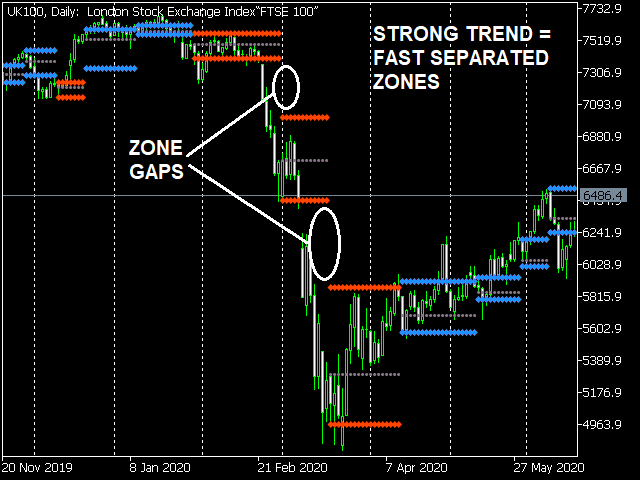
- Innerhalb der markierten Zonen bewegt sich der Kurs langsam, was auf eine geringe Volatilität und Seitwärtsbewegungen hindeutet, und außerhalb bewegt er sich schnell, was auf klare Trends mit hoher Volatilität hindeutet; dieser Punkt ist ideal, um festzustellen, wo wir Trend- und/oder Seitwärtsstrategien ausführen sollten.
Beschreibung der Linien im Diagramm
Alle 3 Linien zusammen stellen eine Spanne dar, in der sich der Kurs statistisch gesehen eher innerhalb als außerhalb der Zone bewegen wird.
- Die obere Linie stellt das obere Ende der Spanne / teure Preise dar.
- Die mittlere Linie steht für den "am meisten akzeptierten Preis" innerhalb der Spanne.
- Die untere Linie stellt den unteren Teil der Spanne / günstige Preise dar.
Form und Farbe der Zonen
Jede Zone ist einzigartig und hängt von den Marktbewegungen ab, die sie entstehen lassen:
- Schmale Zonen stehen für Märkte mit "geringer Volatilität".
- Hohe Zonen stehen für Märkte mit "hoher Volatilität".
- Lange Zonen weisen auf seitwärts tendierende Märkte hin.
- Rote Zonen, wenn der Markt sinkt.
- Blaue Zonen, wenn der Markt steigt.
Parameter
- Volumen verwenden. Markieren Sie true, um das Broker-Volumen bei der Zonenberechnung zu verwenden.
- Balken zurück. Anzahl der Candlesticks zurück, um die Zonen anzuzeigen.
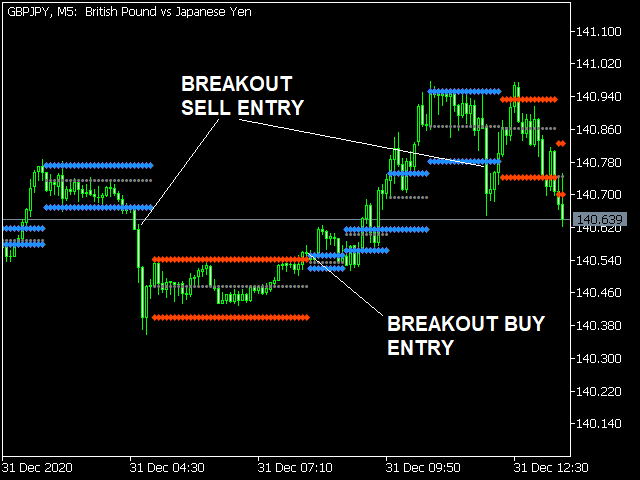
Beispiele für die Verwendung
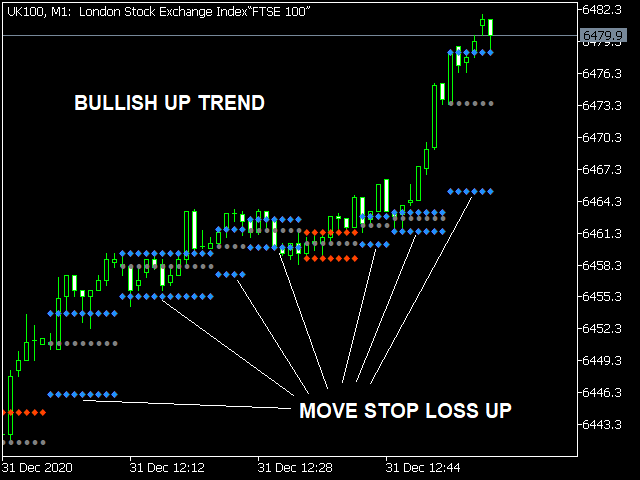
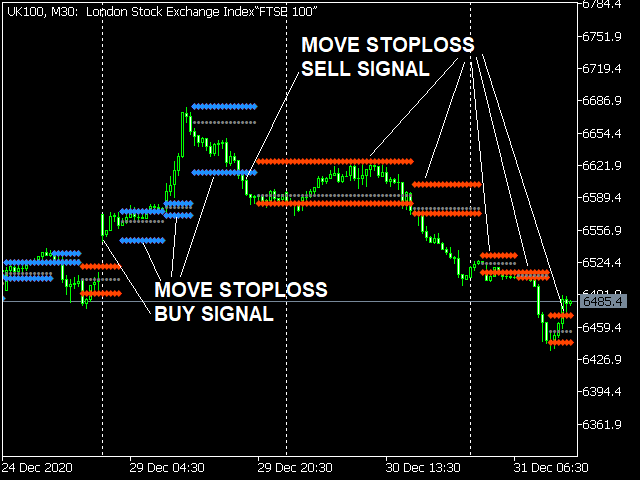
- Wenn der Kurs die obere Linie durchbricht, besteht eine hohe Wahrscheinlichkeit für einen bullischen Ausbruch.
- Wenn der Kurs die untere Linie durchbricht, besteht eine hohe Wahrscheinlichkeit für einen bärischen Ausbruch.
- Wenn wir bärisch handeln, ist der beste Ort, um Stop-Losses zu platzieren, oberhalb der oberen Linie.
- Wenn wir bullisch handeln, ist der beste Platz für Stopp-Losses unterhalb der unteren Linie.