Volume Profile Master Pro

Volume Profile Master Pro — Visible Range Volume Profile for MT4

Volume Profile Master Pro brings institutional-grade volume analysis to your MT4 charts. Unlike standard volume indicators that show when volume occurred, this tool shows where — at each price level — giving you a precise map of market activity to identify high-probability trade setups.

OVERVIEW

The indicator calculates and displays a Visible Range Volume Profile (VRVP) that automatically updates as you scroll the chart. Every time you change the visible range, the profile recalculates in real time, ensuring the analysis is always relevant to your current view.

KEY FEATURES

Visible Range Volume Profile (VRVP) The profile redraws dynamically as you scroll, always reflecting the exact bars visible on screen. No manual input required.

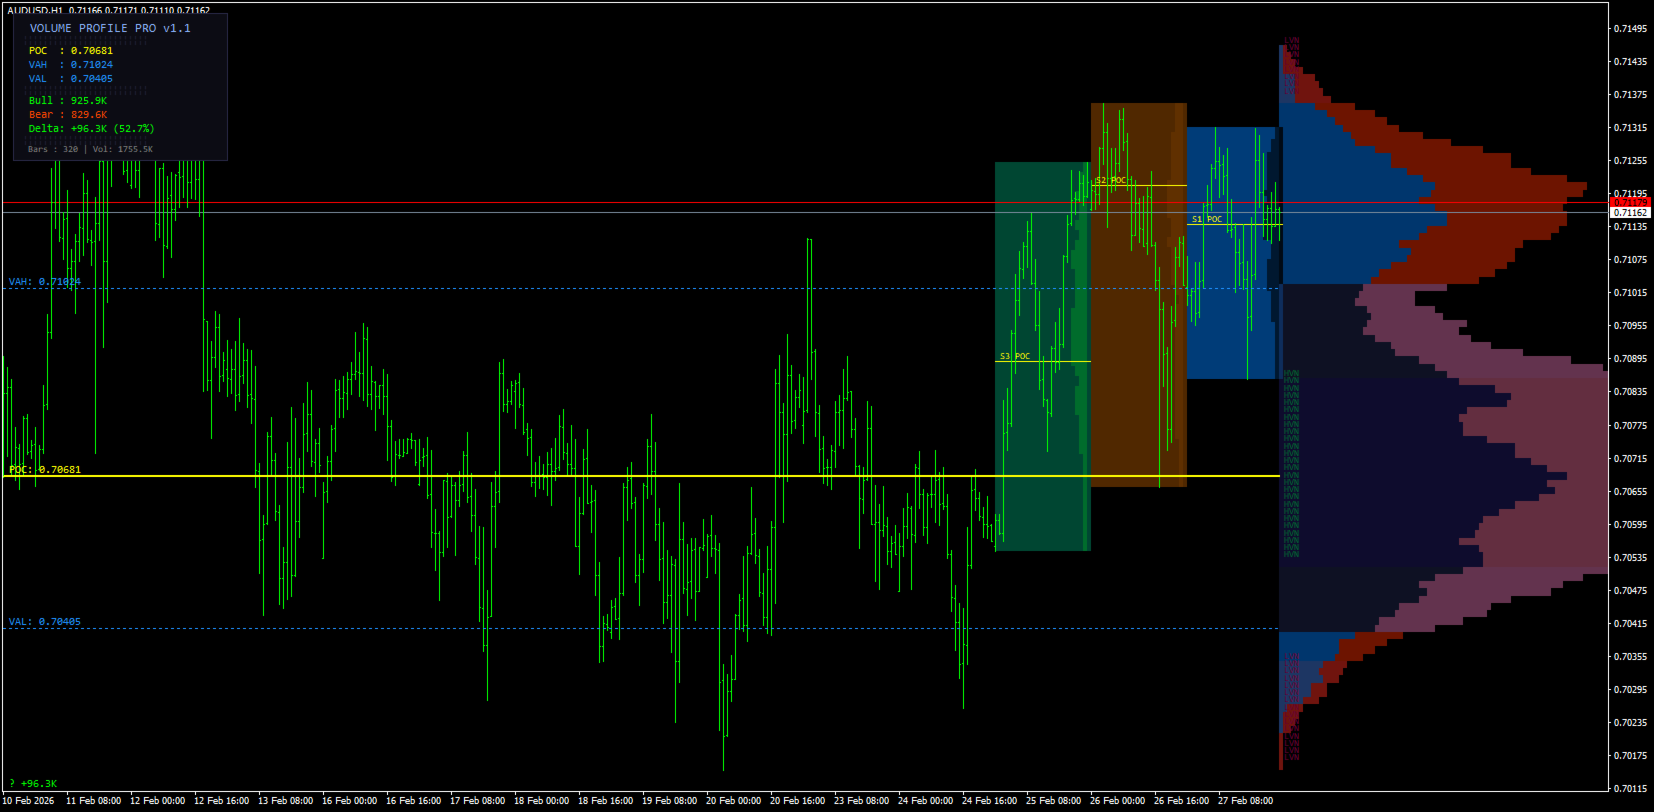
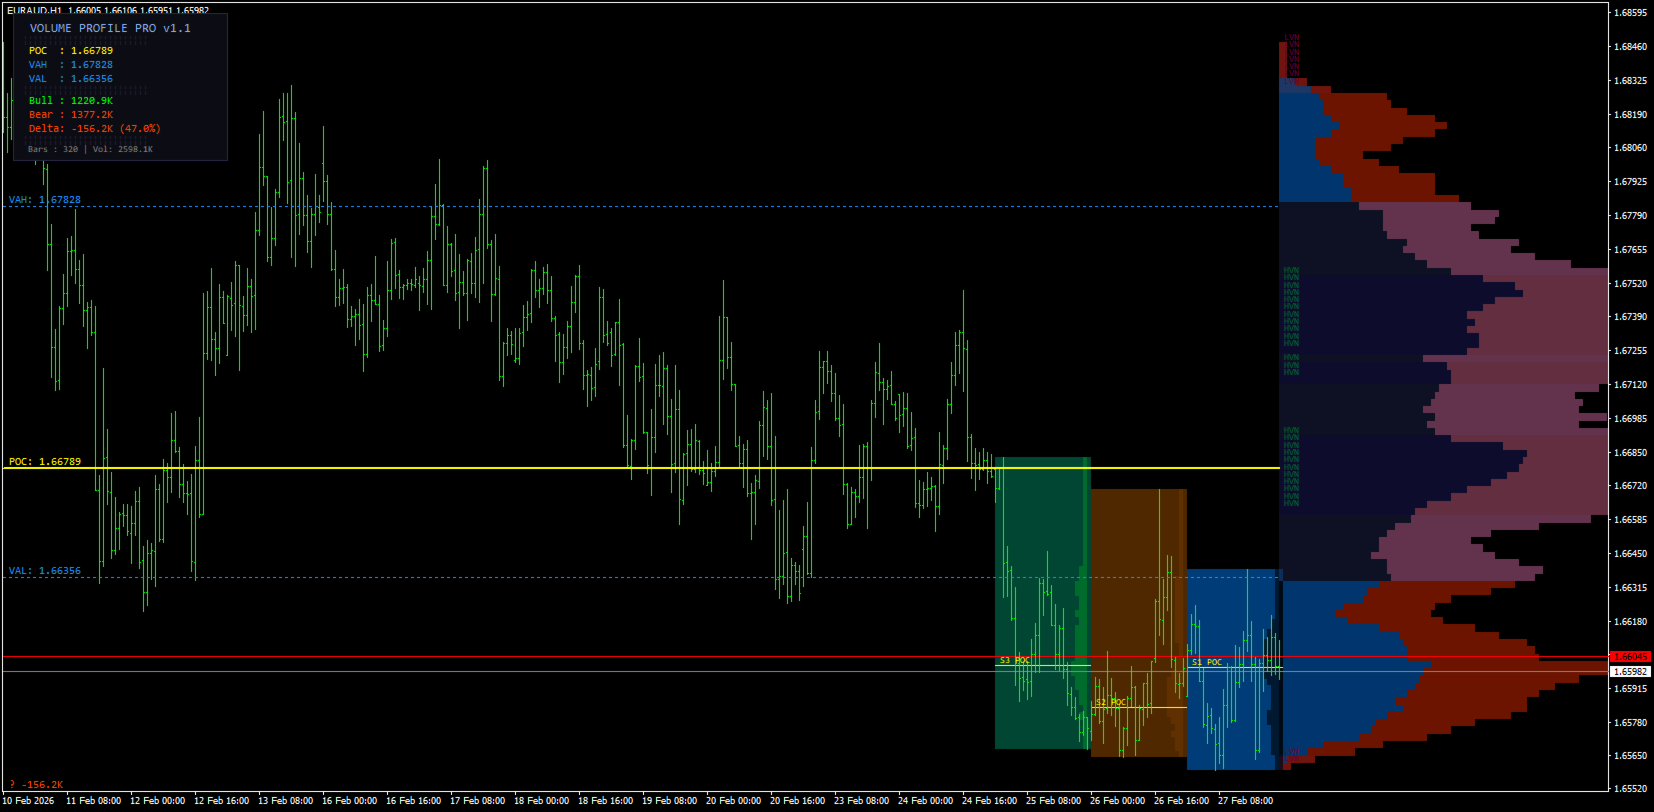
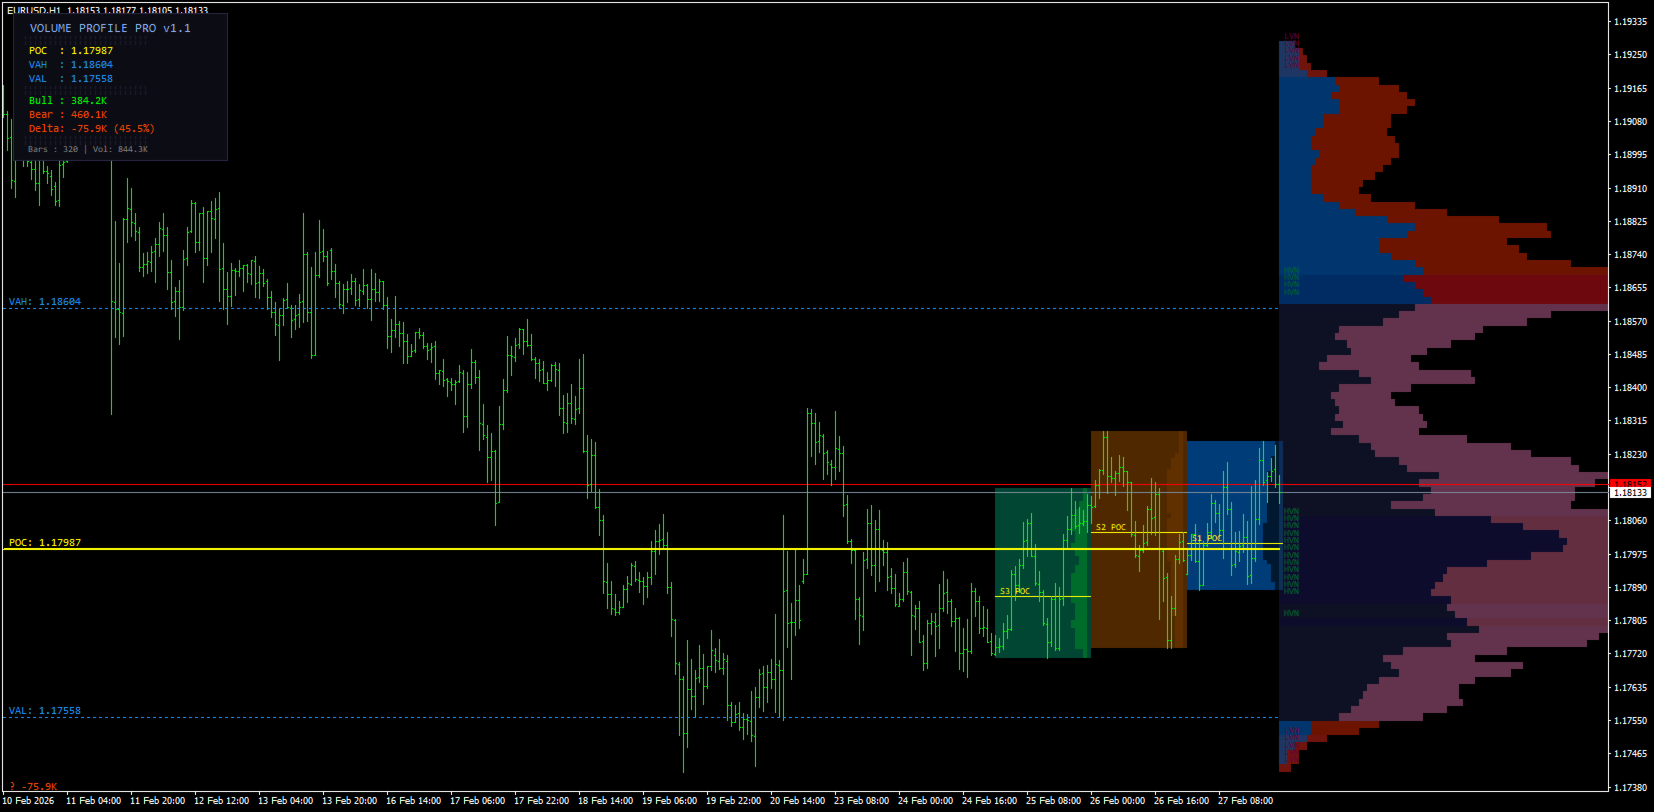
Point of Control (POC) The price level with the highest traded volume. A horizontal line extends across the chart so you can compare the POC to current price at all times. Price frequently gravitates back to the POC after moving away.

Value Area (VAH and VAL) The Value Area is the price range containing 70% of all traded volume (configurable). The upper boundary is the Value Area High (VAH); the lower boundary is the Value Area Low (VAL). Breaks beyond these boundaries suggest trend continuation. Rejections back inside suggest mean reversion.

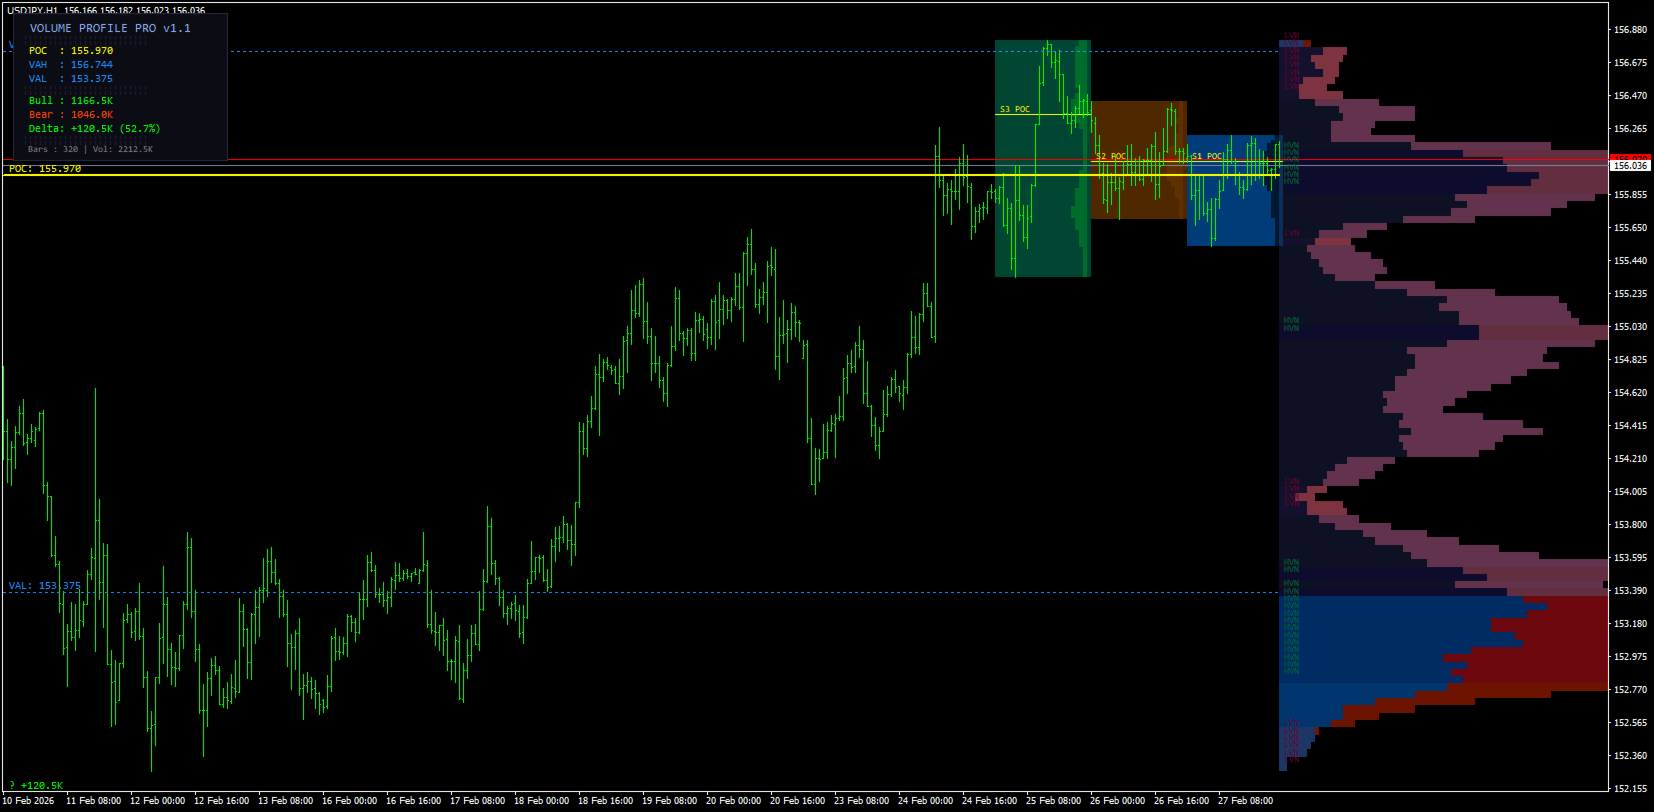
Bull / Bear Volume Delta Each bar in the profile is split into buying volume (blue) and selling volume (red). The total Delta figure is displayed so you can immediately see whether buyers or sellers dominated the visible range.

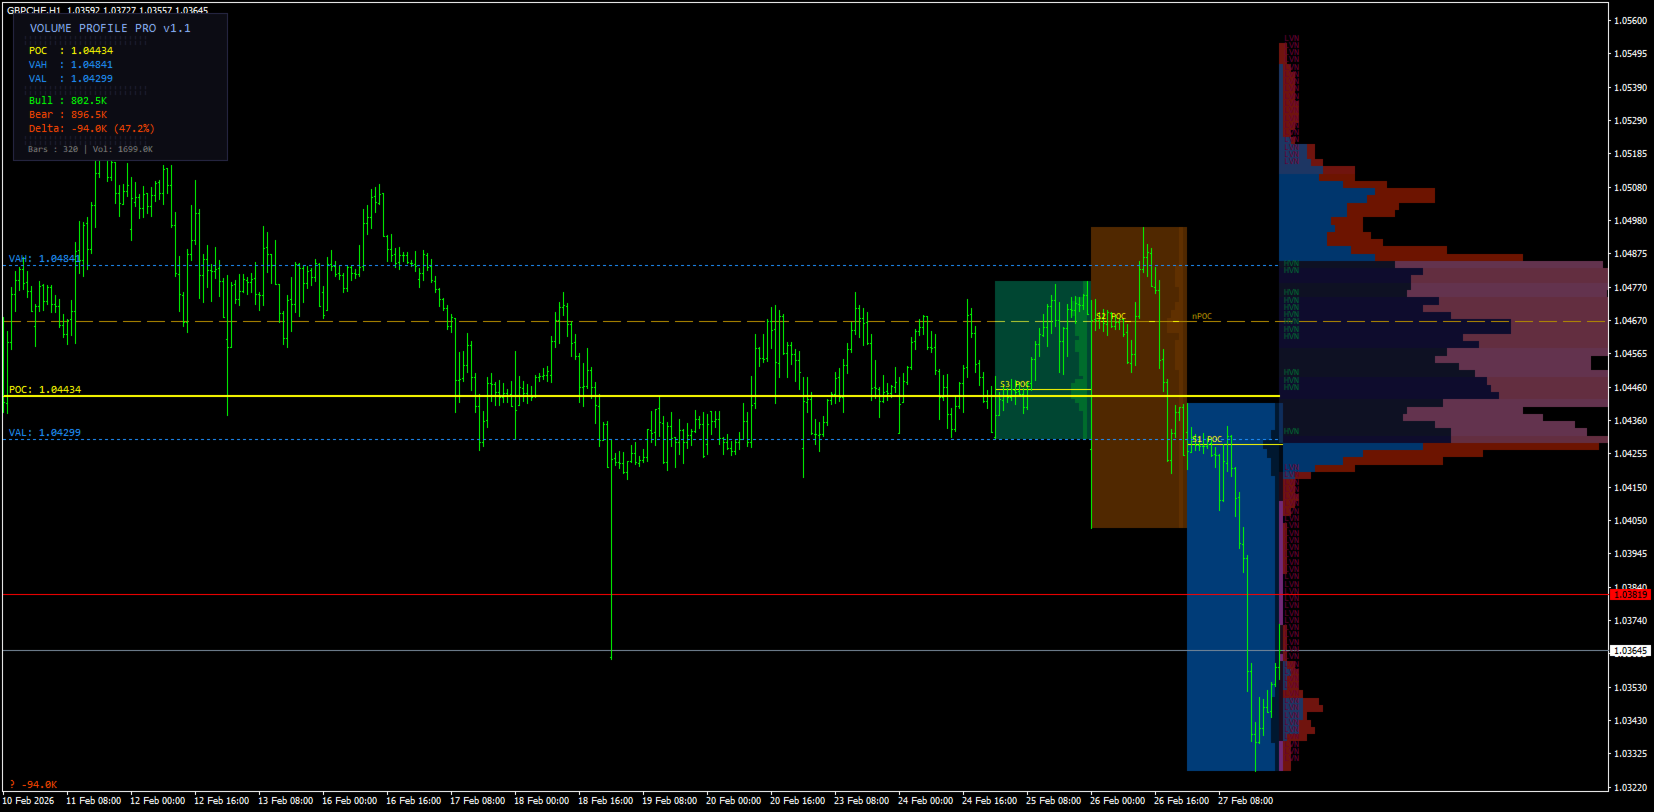
High Volume Nodes (HVN) and Low Volume Nodes (LVN) HVNs are price levels with abnormally high activity. Price tends to slow and consolidate here. LVNs are price levels with very little activity. Price tends to accelerate through them. Both are highlighted automatically.

Session Profiles Up to 3 past sessions are drawn as individual mini-profiles, each with its own POC line. Use these to track how market structure evolves across sessions and to identify which session POCs are acting as current support or resistance.

Naked POC (nPOC) A Naked POC is a prior session's POC that price has not revisited since that session closed. These levels exert a strong pull on price. They are marked with a dashed line and remain on the chart until price tests them.

Smart Alert System The indicator monitors key levels in real time and fires a single alert per bar when:

  • Price crosses the current POC
  • Price breaks above VAH or below VAL
  • Price reaches a Naked POC
  • Price enters a High Volume Node zone

Alerts are delivered as screen popups, emails, or push notifications to your mobile device.

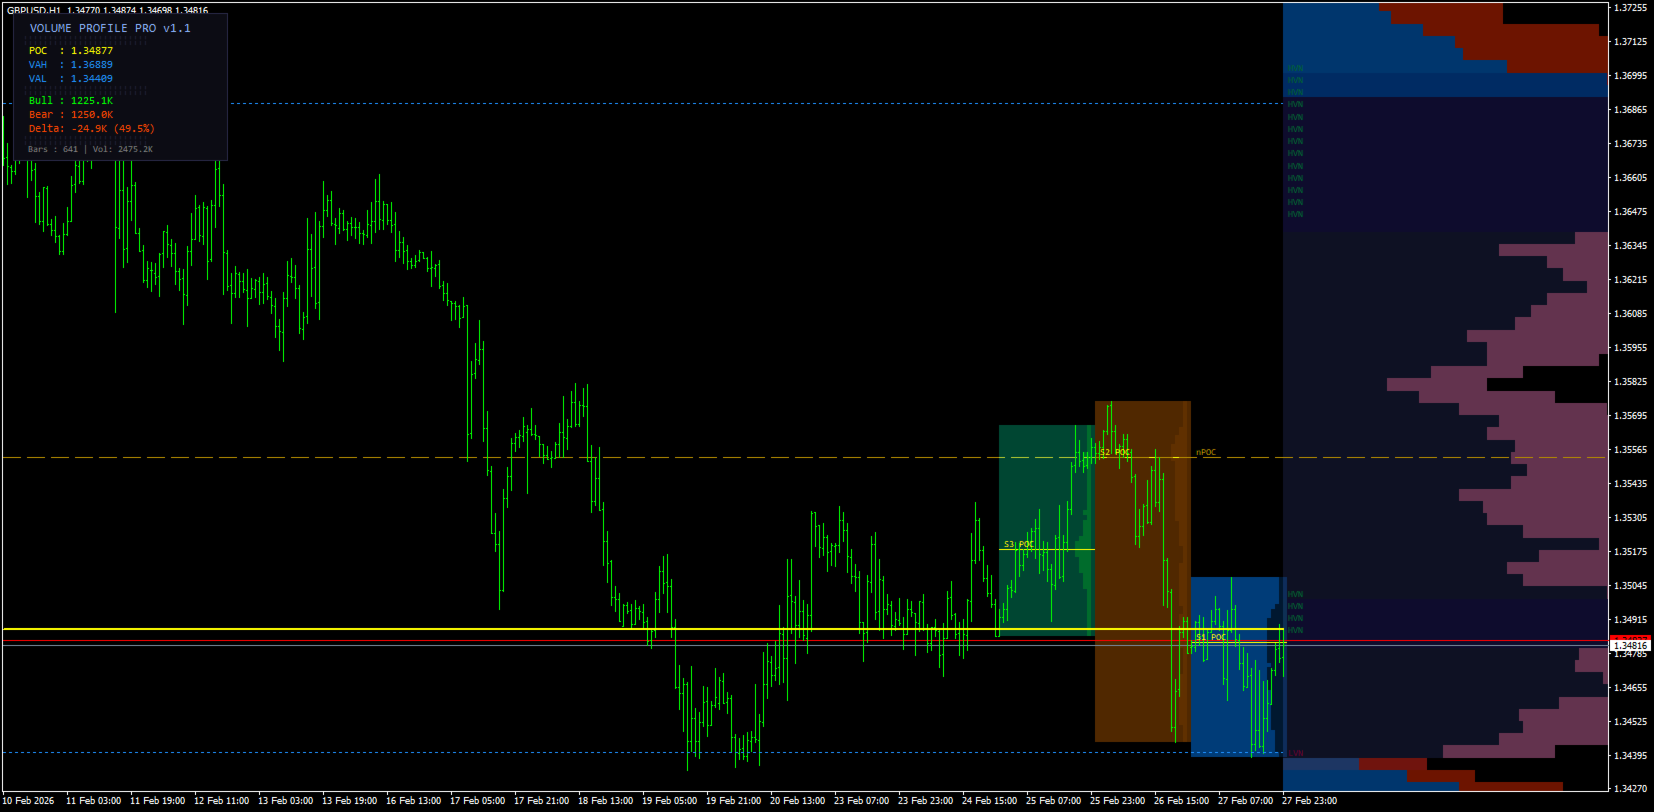
HOW TO READ THE PROFILE

The profile is drawn to the right of the visible range. The width of each horizontal bar represents the relative volume at that price level — the wider the bar, the more activity occurred there.

  • Yellow solid line — POC (highest volume price)
  • Blue dotted lines — VAH and VAL (value area boundaries)
  • Blue shading — Value Area
  • Green shading — High Volume Node
  • Red shading — Low Volume Node
  • Yellow dashed line — Naked POC (unmitigated prior session POC)

TRADING APPLICATIONS

Trend Continuation When price closes above VAH or below VAL on strong delta, look for a pullback entry at VAH or VAL on the next retest.

Mean Reversion When price spikes away from the POC and delta begins to weaken, anticipate a return to the POC. Sell resistance at VAH or buy support at VAL.

Fast-Lane LVN Entries Price moves quickly through LVNs. Place limit orders at HVNs for long entries below the market or short entries above it.

Naked POC Targets When price is approaching a Naked POC, it is likely to be tested. Use the nPOC as a price target or watch for a reaction when price touches it.

INPUT PARAMETERS

Parameter Default Description
Rows 100 Number of price levels in the profile
Value Area % 70 Percentage of volume defining the Value Area
Bar Width 80 Profile display width as % of visible range
Session Count 3 Number of past sessions displayed
Session Hours 24 Session length in hours
HVN Threshold 70% Minimum volume % to qualify as HVN
LVN Threshold 15% Maximum volume % to qualify as LVN
Alert: POC Cross On Alert when price crosses the POC
Alert: VA Break On Alert when price breaks VAH or VAL
Alert: Naked POC On Alert when price touches a Naked POC
Alert: HVN Touch On Alert when price enters an HVN zone
Önerilen ürünler
BoxChart MT4
Evgeny Shevtsov
4.4 (5)
The market is unfair if only because 10% of participants manage 90% of funds. An ordinary trader has slim changes to stand against these "vultures". This problem can be solved. You just need to be among these 10%, learn to predict their intentions and move with them. Volume is the only preemptive factor that faultlessly works on any timeframe and symbol. First, the volume appears and is accumulated, and only then the price moves. The price moves from one volume to another. Areas of volume accumu
Delta Single Volume
Chantal Sala
3.67 (3)
Volume Delta is a very powerful indicator that reads the supply on the Market. It calculates the Delta from movement of the price and the difference of BUY and SELL Tick volumes. Its special structure allows you to get all timeframe values available on the MT4 platform. A good observation of this instrument can suggest great entry points and possible reversal. We are confident that this tool will help you to improve your trading timing. See also for MT5:  https://www.mql5.com/en/market/product/5
İşlem hacimlerine ilişkin okumaları hesaplayan teknik bir gösterge. Histogram biçiminde, ticaret enstrümanının hareket gücünün birikimini gösterir. Yükseliş ve düşüş yönleri için bağımsız hesaplama sistemlerine sahiptir. Herhangi bir ticaret enstrümanı ve zaman dilimi üzerinde çalışır. Herhangi bir ticaret sistemini tamamlayabilir. Gösterge değerlerini yeniden çizmez, sinyaller mevcut mum üzerinde görünür. Kullanımı kolaydır ve grafiği yüklemez, ek parametre hesaplamaları gerektirmez. Değiştiril
Blahtech Market Profile
Blahtech Limited
4.53 (15)
Was: $249  Now: $99   Market Profile defines a number of day types that can help the trader to determine market behaviour. A key feature is the Value Area, representing the range of price action where 70% of trading took place. Understanding the Value Area can give traders valuable insight into market direction and establish the higher odds trade. It is an excellent addition to any system you may be using. Blahtech Limited presents their Market Profile indicator for the MetaTrader community. Ins
Simply The Best Pro
Szymon Palczynski
5 (1)
This indicator displays the histogram and arrows on chart. When Simple The Best Pro are placed on a chart, they identify the trend.  The color of may be blue or red. The blue color stands for upside moves and the red color stands for downside trends. The indicator offers to set Stop Loss (SL) and  Take Profit (TP)  setting. The default value is ATR. Indicator has automatic optimization. The STB is a unique indicator that shows the tendency (button Bars) of a particular signals. The STB tells us
Gösterge, tarihsel olanlarla karşılaştırılabilecek güncel teklifler oluşturur ve bu temelde bir fiyat hareketi tahmini yapar. Gösterge, istenen tarihe hızlı navigasyon için bir metin alanına sahiptir. Seçenekler: Sembol - göstergenin göstereceği sembolün seçimi; SymbolPeriod - göstergenin veri alacağı dönemin seçimi; GöstergeRenk - gösterge rengi; Ters - doğru tırnakları tersine çevirir, yanlış - orijinal görünüm; Sonraki, tarihi girebileceğiniz ve 'enter' tuşuna basarak hemen atlayab
Volume Candles
Alexander Nikolaev
Volumes are one of the most important factors of trading, as it is the high volumes that move the market in either direction. But there are very few standard indicators for volumes in MetaTrader 4. The Volume Candles analyses the volumes of the trades and displays candles depending on these volumes. The candle appears once the required number of volumes has passed during trading (the VolumeCandle parameter). If the candles close frequently and are thin, then the volumes on the market are current
SQ Swing Fibo Marker
Bartlomiej Gorski
5 (1)
Swing Fibo Marker is adaptive advanced indicator that automatically detects price swings. After swing detection, it draws five profit targets, entry level and stop loss level. Levels are calculated base on price swing size, according to Fibonacci levels specified as entry points. When price touch the level indicator create alerts. List of supported alert types: Popup alerts Email alerts Push notification On screen output Suggested timeframe to trade: H1 or higher. The higher timeframe is used to
MT4 Sürümü: https://www.mql5.com/en/market/product/166784 MT5 Sürümü: https://www.mql5.com/en/market/product/166785 LİKİDİTE PROFİLİ LİKİDİTE PROFİLİ, dinamik bir ısı haritası tarzı profil kullanarak grafikte potansiyel likidite bölgelerini haritalayan görsel bir piyasa yapısı aracıdır. Bu gösterge, geçmiş fiyat hareketlerini ve işlem hacmini analiz eder ve ardından likiditenin muhtemelen yoğunlaştığı fiyat alanlarını vurgular. Şunları çizer: Likidite çizgileri (potansiyel tepki/süpürme sevi
Volume Compair
Thiago Pereira Pinho
Professional Cumulative Delta & Volume Median Indicator Track   real buying/selling pressure   with this powerful volume analysis tool. The   Volume Compare Indicator   combines   Cumulative Delta   and   Volume Medians   to help you identify institutional activity, imbalances, and potential reversals. Key Features: Cumulative Delta Histogram   – Visualizes net buying vs. selling volume in real-time. Buy/Sell Volume Medians   – Horizontal lines showing average buy & sell volume levels. Smart Vo
VolumeProfile
Robert Hess
3.8 (5)
Descption: The Volume Profile displays detailed informations of historical trading activities at certain price levels (Market Profile). So you can locate the areas with the best prices in the market and get an advantage about other market participants. Features: Customizable Volume Profile / Market Profile Shows the "fair" Value Area with 70% of all Volume Shows critical low volume zones Shows VPOC, VAL and VAH Points Works on all timeframes Also available for MT5 ( https://www.mql5.com/en/mark
If you are using volume spread analysis, whether your are a beginner or an expert, this system will give you a lot of features and help in your analysis. Please watch the video to see all the features. Features With one click you will find all the VSA patterns on your chart . Bars without opening price. Easy to read volume indicator. Bar reader (Bar type - Close type - Volume type - Spread type). Daily and weekly levels (Pivot - Camarilla - Fibo). Very light on the trading platform and moving b
VR Grid
Vladimir Pastushak
5 (3)
VR Izgara göstergesi, kullanıcı tanımlı ayarlarla grafiksel bir ızgara oluşturmak için tasarlanmıştır . Standart ızgaradan farklı olarak, VR Izgarası dairesel seviyeler oluşturmak için kullanılır. Kullanıcının seçimine bağlı olarak tur seviyeleri arasındaki adım isteğe bağlı olabilir. Ek olarak, diğer göstergeler ve yardımcı programlardan farklı olarak VR Grid, zaman dilimi değiştiğinde veya terminal yeniden başlatıldığında bile ızgaranın konumunu korur . Ayarlar, set dosyaları, demo versiyonlar
FREE
Blahtech Supply Demand
Blahtech Limited
4.58 (36)
Was: $299  Now: $99   Supply Demand uses previous price action to identify potential imbalances between buyers and sellers. The key is to identify the better odds zones, not just the untouched ones. Blahtech Supply Demand indicator delivers functionality previously unavailable on any trading platform. This 4-in-1 indicator not only highlights the higher probability zones using a multi-criteria strength engine, but also combines it with multi-timeframe trend analysis, previously confirmed swings
AW Candle Patterns MT4
AW Trading Software Limited
AW Mum Kalıpları göstergesi, güçlü bir mum kalıbı tarayıcı ile birleştirilmiş gelişmiş bir trend göstergesinin birleşimidir. En güvenilir otuz mum kalıbını tanımak ve vurgulamak için kullanışlı bir araçtır. Ek olarak, renkli çubuklara dayalı güncel bir trend analizörüdür.       yeniden boyutlandırılabilen ve konumlandırılabilen eklenti çoklu zaman çerçevesi trend paneli. Trend filtrelemeye bağlı olarak kalıpların görünümünü ayarlamak için benzersiz bir yetenek. Avantajlar: Mum desenlerini kolayc
MarketProfile EForex
Veridiana Adorno Kendrick
Market Profile Shows where the price has spent more time, highlighting important levels that can be used in trading. It is a powerful tool which is designed to take the fundamental components which comprise every market; price/volume/time, and visually display their relationship in real-time as the market develops for a pre-determined time period. Very powerful tool!
Description The Market Profile & Volume Profile Indicator is a powerful technical analysis tool designed to visualize market activity and price distribution over specific timeframes. Unlike standard technical indicators that focus solely on price over time, this indicator organizes price data to show where the market spent the most time (TPO) and where the most volume was traded (Volume Profile). It automatically calculates and displays key structural levels such as the Point of Control (POC) ,
AQ XFifteen Pro
HIT HYPERTECH INNOVATIONS LTD
Χ15 indicator is a MetaTrader 4 tool that allows you to  BUILD & BACKTEST ON REAL TIME  your own strategies quickly, easily and efficiently. It contains  15 of the most popular technical analysis indicators  that you can use, each one in a different way. Choose the indicators that you want to use, select how you will use them and you will see on the chart BUY (green) and SELL (red) arrows implementing your strategy. Choose Take Profit and Stop Loss and you will see the results of your strategy w
Forex Volume MT4
KEENBASE SOFTWARE SOLUTIONS
KT Forex Volume, bir döviz çiftinin alım ve satım hacmini renkli histogram şeklinde gösterir. Hacim, bir varlık üzerindeki alım ve satım işlemlerinden oluşur. Forex piyasasında: Eğer alım hacmi, satım hacminden büyükse döviz çiftinin fiyatı yükselir. Eğer satım hacmi, alım hacminden büyükse döviz çiftinin fiyatı düşer. Özellikler İşlemleri, tick hacim verilerini kullanarak doğrulayarak kötü işlemlerden kaçının. Piyasadaki büyük oyuncuların yönünde işlem yapmanıza yardımcı olur. Tüm Metatrader u
VN Trade Panel II
Vyacheslav Nekipelov
4 (1)
The new version of the trading panel, which now has the ability to separately close Buy and Sell orders, display targets for all orders on the chart, as well as the ability to use the panel to trade with brokers working on the FIFO rule. Also, the new version adds option buttons for separate management of open orders. It has a convenient visualized interface and intuitive control without a lot of additional tabs to which traders have to be distracted and switch their attention. Thanks to this,
UPD1 Profile Levels
Vitaliy Kuznetsov
5 (6)
Gösterge, belirtilen sayıda çubuk için çalışma histogramında maksimum ve minimum fiyat hacminin (piyasa profili) seviyelerini bulur.   Kompozit profil. Histogramın yüksekliği tamamen otomatiktir ve herhangi bir enstrümana ve zaman dilimine uyarlanabilir. Yazarın algoritması kullanılır ve bilinen analogları tekrarlamaz. İki histogramın yüksekliği yaklaşık olarak mumun ortalama yüksekliğine eşittir. Akıllı uyarı (akıllı uyarı), hacim seviyesine ilişkin fiyatı bildirmenize yardımcı olur. Konsept
Intraday Volume Profile Forex MT4   Intraday Volume Profile  - This is a visualization tool for understanding the high activity zone and low activity zone, as part of the  D1  senior timeframe. The volume profile provides an excellent visual image of supply / demand at each price for the selected timeframe. Introducing  POC  - Point of Control, which indicates the price at which the maximum volume was sold, as well as Value Area - the area where 68% of the instrument's assets are traded. POC  -
Market Profile with Dashboard Indicator - Complete User Guide indicator Overview The Market Profile with Dashboard is a comprehensive trading analysis tool for MetaTrader 4 that displays market profile data, volume analysis, and key market structure information directly on your chart. This indicator helps traders identify significant price levels, market balance areas, and potential trading opportunities based on market profile theory. Core Components and Features Market Profile Display - Sh
VPO Profile MT4
Kyra Nickaline Watson-gordon
5 (2)
Definition : VPO is a Volume Price Opportunity. Instead of using bars or candles with an Open, High, Low, and Close price, each "bar" in a Market Profile is represented by horizontal bars against the price It is called Market Profile terminology. In other words volume-price-opportunity (VPO) profiles are histograms of how many volumes were traded at each price within the span of the profile. By using a VPO chart, you are able to analyze the amount of trading activity, based on volume, for each
Order Book
Thomas Bradley Butler
Pazar hacmi profilinin tam bir resmi için Delta Ayak İzi Tablosu ile birleştirin:   https://www.mql5.com/en/market/product/9415 3 "Sipariş Defteri" göstergesi, fiyat tablosunda alış ve satış hacmi kümelerini temsil eden bir histogram görüntüler.   Gösterge, geçmiş fiyat verilerini analiz eder ve belirli bir çubuk sayısı dahilinde her bir fiyat seviyesi için alış ve satış hacmi kümelerini hesaplar. Teklif hacmi kümeleri mavi, talep hacmi kümeleri ise kırmızı ile gösterilir. Gösterge, alış ve
With this indicator, you can easily make price regions in all time zones. In addition, with the automatic supply demand finder, you can ensure that the new regions are found automatically. You can increase your transaction quality by reaching more accurate operations with this auxiliary Tool and indicator. I share your trial version of EURUSD for free with you. If you want to buy the working version in all parities, you can contact me. +New version Gap Bar Add ( Press G keyboard )  +Redsword P
Concept of  Market Profile  was created at Chicago Board of Trade (CBOT) by trader   Peter Steidlmayer  and first published during the 1980s as CBOT product. Market profile by itself is not a stand-alone strategy, but a different way how you can view the market and make better trading decisions. They have seen a market as an auction process which is affected by supply and demand the same way as every other auction, for example, development of prices of food, gas etc. The price goes up as long th
Market Dynamics
Thomas Bradley Butler
Piyasa Dinamikleri, trend ölçeklendirme içindir. Mavi al ve kırmızı sat. Çizgiler, fiyat konsolidasyonu alanlarıdır ve normal çubuk mumlara karar verilmez. Fiyat, destek ve direnç çizgileri arasında konsolide olacak ve ardından alanlardan fiyat hareketi kopacak. Üstte veya altta kafa derisi için resim alanları ve ana trendleri veya kafa derisi için günlük ticareti takip edin.
KT Volume Profile MT4
KEENBASE SOFTWARE SOLUTIONS
KT Volume Profile, hacim birikim verilerini Y ekseninde bir histogram olarak göstererek, belirli zaman dilimleri ve fiyat seviyelerinde işlem yoğunluğunu analiz etmeyi sağlar. Volume Profile'da Kontrol Noktası (POC) POC, tüm profil boyunca en yüksek işlem hacminin gerçekleştiği fiyat seviyesini temsil eder. Genellikle destek/direnç seviyesi veya piyasanın yön değiştirmeden önce yeniden test ettiği önemli bir fiyat noktası olarak kullanılır. Özellikler Kullanımı çok kolaydır. Grafik üzerinde di
The Market Profile Indicator for MT4 displays the price levels and zones where increased trading activity happens. These zones with substantial forex trading activity provide the forex traders with the best entry levels, support, and resistance levels. Moreover, price levels indicate the best reversal zones. As a result, forex traders can identify BULLISH and BEARISH market trends and BUY and SELL entry points as well as the best reversal points. The indicator works well in all intraday timefram
Bu ürünün alıcıları ayrıca şunları da satın alıyor
Gann Made Easy
Oleg Rodin
4.83 (155)
Gann Made Easy , bay teorisini kullanarak ticaretin en iyi ilkelerine dayanan, profesyonel ve kullanımı kolay bir Forex ticaret sistemidir. WD Gann. Gösterge, Zararı Durdur ve Kâr Al Seviyeleri dahil olmak üzere doğru SATIN AL ve SAT sinyalleri sağlar. PUSH bildirimlerini kullanarak hareket halindeyken bile işlem yapabilirsiniz. LÜTFEN ÜCRETSİZ OLARAK TİCARET İPUÇLARI, BONUSLAR VE GANN MADE EA ASİSTANI ALMAK İÇİN SATIN ALIMDAN SONRA BENİMLE İLETİŞİME GEÇİN! Muhtemelen Gann ticaret yöntemlerini b
El indicador "MR BEAST ALERTAS DE LIQUIDEZ" es una herramienta avanzada diseñada para proporcionar señales y alertas sobre la liquidez del mercado basándose en una serie de indicadores técnicos y análisis de tendencias. Ideal para traders que buscan oportunidades de trading en función de la dinámica de precios y los niveles de volatilidad, este indicador ofrece una visualización clara y detallada en la ventana del gráfico de MetaTrader. Características Principales: Canal ATR Adaptativo: Calcula
Scalper Inside PRO
Alexey Minkov
4.74 (69)
An exclusive indicator that utilizes an innovative algorithm to swiftly and accurately determine the market trend. The indicator automatically calculates opening, closing, and profit levels, providing detailed trading statistics. With these features, you can choose the most appropriate trading instrument for the current market conditions. Additionally, you can easily integrate your own arrow indicators into Scalper Inside Pro to quickly evaluate their statistics and profitability. Scalper Inside
Are you looking for a simple and reliable indicator that can help you spot market swing points easily? Do you want clear buy and sell signals that work on any timeframe and any trading instrument? Buy Sell Signal Pro is designed to do exactly that. It helps traders identify important market turning points and understand the current market structure in a clear and easy way. This indicator detects Higher Highs (HH), Higher Lows (HL), Lower Highs (LH), and Lower Lows (LL) so you can quickly see wh
Miraculous Göstergesi – Gann Dokuz Kareye Dayalı %100 Tekrarlamayan Forex ve İkili Araç Bu video, Forex ve İkili Opsiyon traderları için özel olarak geliştirilmiş son derece doğru ve güçlü bir ticaret aracı olan Miraculous Göstergesi 'ni tanıtıyor. Bu göstergeyi benzersiz kılan, efsanevi Gann Dokuz Karesi ve Gann Titreşim Yasası 'na dayanmasıdır; bu da onu modern ticarette mevcut en hassas tahmin araçlarından biri yapmaktadır. Miraculous Göstergesi tamamen tekrarlamaz ; yani mum kapandıktan son
RFI levels PRO
Roman Podpora
5 (1)
Bu gösterge, fiyat dönüş noktalarını ve fiyat geri dönüş bölgelerini doğru bir şekilde gösterir.       Başlıca oyuncular   . Yeni trendlerin nerede oluştuğunu görüyorsunuz ve her işlem üzerinde kontrolü elinizde tutarak, azami hassasiyetle kararlar alıyorsunuz. TREND LINES PRO   göstergesiyle birlikte kullanıldığında maksimum potansiyelini ortaya koyar.  VERSION MT5 Göstergenin gösterdiği şey: Yeni bir trendin başlangıcında aktivasyonla birlikte tersine dönüş yapıları ve tersine dönüş seviyeler
GOLD Impulse with Alert
Bernhard Schweigert
4.64 (11)
Bu gösterge, 2 ürünümüz Advanced Currency IMPULSE with ALERT  +   Currency Strength Exotics  'in süper bir kombinasyonudur. Tüm zaman dilimleri için çalışır ve 8 ana para birimi artı bir Sembol için grafiksel olarak güç veya zayıflık dürtüsünü gösterir! Bu Gösterge, Altın, Egzotik Çiftler, Emtialar, Endeksler veya Vadeli İşlemler gibi herhangi bir sembol için para birimi gücü ivmesini göstermek için uzmanlaşmıştır. Türünün ilk örneğidir, Altın, Gümüş, Petrol, DAX, US30, MXN, TRY, CNH vb. içi
Trend Lines PRO
Roman Podpora
5 (1)
TREND ÇİZGİLERİ PRO     Piyasanın gerçek yön değişimini anlamaya yardımcı olur. Gösterge, gerçek trend dönüşlerini ve büyük oyuncuların piyasaya yeniden girdiği noktaları gösterir. Anlıyorsun     BOS hatları  Daha yüksek zaman dilimlerindeki trend değişiklikleri ve önemli seviyeler, karmaşık ayarlar veya gereksiz gürültü olmadan gösterilir. Sinyaller yeniden çizilmez ve çubuk kapandıktan sonra grafikte kalır. VERSION MT 5     -    RFI LEVELS PRO  göstergesiyle birlikte kullanıldığında maksimum p
PRO Renko Sistemi, RENKO grafikleri ticareti için özel olarak tasarlanmış son derece hassas bir ticaret sistemidir. Bu, çeşitli ticaret araçlarına uygulanabilen evrensel bir sistemdir. Sistemi etkin piyasa sana doğru ters sinyallerine erişim hakkı denilen ses nötralize eder. Göstergenin kullanımı çok kolaydır ve sinyal üretiminden sorumlu tek bir parametreye sahiptir. Aracı, seçtiğiniz herhangi bir ticaret aracına ve renko çubuğunun boyutuna kolayca uyarlayabilirsiniz. Yazılımımla karlı bir
Precautions for subscribing to indicator This indicator only supports the computer version of MT4 Does not support MT5, mobile phones, tablets The indicator only shows the day's entry arrow The previous history arrow will not be displayed (Live broadcast is for demonstration) The indicator is a trading aid Is not a EA automatic trading No copy trading function The indicator only indicates the entry position No exit (target profit)  The entry stop loss point is set at 30-50 PIPS Or the front hi
ŞU ANDA %40INDIRIMLI Yeni Başlayanlar veya Uzman Tüccarlar için En İyi Çözüm! Bu Gösterge benzersiz, yüksek kaliteli ve uygun fiyatlı bir ticaret aracıdır çünkü bir dizi tescilli özellik ve yeni bir formül ekledik. Sadece BİR grafik ile 28 Forex çifti için Döviz Gücünü okuyabilirsiniz! Yeni bir trendin veya scalping fırsatının tam tetik noktasını belirleyebildiğiniz için ticaretinizin nasıl gelişeceğini hayal edin? Kullanım kılavuzu: buraya tıklayın Bu ilk olan, orijinal! Değersiz bir özent
Şu anda %40 İNDİRİMLİ! Herhangi bir Acemi veya Uzman Tüccar için En İyi Çözüm! Bu gösterge paneli yazılımı 28 döviz çifti üzerinde çalışıyor. Ana göstergelerimizden 2'sine (Gelişmiş Para Birimi Gücü 28 ve Gelişmiş Para Birimi Dürtüsü) dayanmaktadır. Tüm Forex piyasasına harika bir genel bakış sağlar. Gelişmiş Para Birimi Gücü değerlerini, para birimi hareket hızını ve tüm (9) zaman dilimlerinde 28 Forex çifti için sinyalleri gösterir. Trendleri ve / veya scalping fırsatlarını belirlemek için
Currency Strength Wizard , başarılı ticaret için size hepsi bir arada çözüm sağlayan çok güçlü bir göstergedir. Gösterge, birden çok zaman dilimindeki tüm para birimlerinin verilerini kullanarak şu veya bu forex çiftinin gücünü hesaplar. Bu veriler, şu veya bu para biriminin gücünü görmek için kullanabileceğiniz, kullanımı kolay para birimi endeksi ve para birimi güç hatları biçiminde temsil edilir. İhtiyacınız olan tek şey, işlem yapmak istediğiniz tabloya göstergeyi eklemektir ve gösterge size
ŞU ANDA %40 INDIRIMLI !!! Yeni Başlayanlar veya Uzman Tüccarlar için En İyi Çözüm! Bu gösterge benzersiz, yüksek kaliteli ve uygun fiyatlı bir ticaret aracıdır çünkü bir dizi tescilli özellik ve gizli bir formül ekledik. Yalnızca BİR grafikle 28 döviz çiftinin tümü için Uyarılar verir. Yeni bir trendin veya scalping fırsatının tam tetik noktasını belirleyebildiğiniz için ticaretinizin nasıl gelişeceğini hayal edin! Yeni temel algoritmalar üzerine inşa edilen bu sistem, potansiyel işlemlerin
Dynamic Forex28 Navigator
Bernhard Schweigert
4.43 (7)
Dynamic Forex28 Navigator - Yeni Nesil Forex Ticaret Aracı. ŞU ANDA %49 İNDİRİM. Dynamic Forex28 Navigator, uzun zamandır popüler olan göstergelerimizin evrimidir ve üçünün gücünü tek bir göstergede birleştirir: Gelişmiş Döviz Gücü28 Göstergesi (695 inceleme) + Gelişmiş Döviz İMPULS ve UYARI (520 inceleme) + CS28 Kombo Sinyalleri (Bonus). Gösterge hakkında ayrıntılar https://www.mql5.com/en/blogs/post/758844 Yeni Nesil Güç Göstergesi Ne Sunuyor?  Orijinallerde sevdiğiniz her şey, şimdi yeni
Trend indicator AI
Ramil Minniakhmetov
4.57 (82)
Trend Ai göstergesi, trend tanımlamasını işlem yapılabilir giriş noktaları ve geri dönüş uyarılarıyla birleştirerek bir yatırımcının piyasa analizini geliştirecek harika bir araçtır. Bu gösterge, kullanıcıların forex piyasasının karmaşıklıklarında güvenle ve hassasiyetle yol almalarını sağlar. Birincil sinyallerin ötesinde, Trend Ai göstergesi geri çekilmeler veya düzeltmeler sırasında ortaya çıkan ikincil giriş noktalarını belirleyerek, yatırımcıların belirlenen trend içindeki fiyat düzeltmele
FX Power MT4 NG
Daniel Stein
4.95 (21)
FX Power: Daha Akıllı Ticaret Kararları için Para Birimlerinin Gücünü Analiz Edin Genel Bakış FX Power , her piyasa koşulunda başlıca para birimlerinin ve altının gerçek gücünü anlamak için vazgeçilmez bir araçtır. Güçlü para birimlerini alıp zayıf olanları satarak, FX Power ticaret kararlarınızı basitleştirir ve yüksek olasılıklı fırsatları ortaya çıkarır. İster trendlere sadık kalın ister Delta'nın aşırı değerlerini kullanarak tersine dönüşleri öngörün, bu araç ticaret tarzınıza mükemmel bir
Advanced Supply Demand
Bernhard Schweigert
4.91 (298)
Özel Ticaret –%40 İndirim Yeni Başlayanlar veya Uzman Yatırımcılar İçin En İyi Çözüm! Bu gösterge, bir dizi özel özellik ve yeni bir formül içerdiği için benzersiz, yüksek kaliteli ve uygun fiyatlı bir işlem aracıdır. Bu güncelleme ile çift zaman dilimi bölgeleri gösterebileceksiniz. Sadece daha yüksek bir zaman dilimini değil, hem grafik zaman dilimini hem de daha yüksek zaman dilimini gösterebileceksiniz: İÇ İÇE GEÇMİŞ BÖLGELER GÖSTERİYOR. Tüm Arz Talep yatırımcıları buna bayılacak. :) Önem
Meravith
Ivan Stefanov
5 (3)
Market maker aracı. Meravith şunları yapar: Tüm zaman dilimlerini analiz eder ve geçerli trendi gösterir. Alış ve satış hacimlerinin eşit olduğu likidite bölgelerini (hacim dengesi) vurgular. Farklı zaman dilimlerinden tüm likidite seviyelerini doğrudan grafiğinizde gösterir. Referansınız için metin tabanlı piyasa analizi üretir ve sunar. Mevcut trende göre hedefler, destek seviyeleri ve stop-loss noktalarını hesaplar. İşlemleriniz için risk/ödül oranını hesaplar. Hesap bakiyenize göre pozisyon
FX Volume
Daniel Stein
4.63 (38)
FX Volume: Bir Broker’ın Perspektifinden Gerçek Piyasa Duyarlılığını Deneyimleyin Kısa Özet Trading yaklaşımınızı bir adım öteye taşımak ister misiniz? FX Volume , perakende traderlar ile brokerların nasıl konumlandığını gerçek zamanlı olarak sunar—COT gibi gecikmeli raporlardan çok daha önce. İster istikrarlı kazançları hedefliyor olun, ister piyasada daha güçlü bir avantaj arayın, FX Volume önemli dengesizlikleri belirlemenize, kırılmaları (breakout) doğrulamanıza ve risk yönetiminizi iyileş
Presenting one-of-a-kind Gann Indicator for XAUUSD IQ Gold Gann Levels is a non-repainting, precision tool designed exclusively for XAUUSD/Gold intraday trading. It uses W.D. Gann’s square root method to plot real-time support and resistance levels, helping traders spot high-probability entries with confidence and clarity. William Delbert Gann (W.D. Gann) was an exceptional market analyst whose trading technique was based on a complex blend of mathematics, geometry, astrology, and ancient calcul
KT Trend Trading Suite MT4
KEENBASE SOFTWARE SOLUTIONS
KT Trend Trading Suite, trend takibi stratejisini birden fazla kırılma noktasıyla birleştiren çok özellikli bir göstergedir. Bu kırılma noktaları giriş sinyali olarak kullanılır. Yeni bir trend oluştuğunda, bu gösterge o trendi yakalayabilmek için birçok giriş fırsatı sunar. Daha az önemli giriş noktalarını filtrelemek için bir geri çekilme eşiği kullanılır. MT5 sürümüne buradan ulaşabilirsiniz  https://www.mql5.com/en/market/product/46270 Özellikler Piyasa dinamiklerini tek bir denklem içi
Volatility Trend System - girişler için sinyaller veren bir ticaret sistemi. Oynaklık sistemi, trend yönünde doğrusal ve noktasal sinyaller ve ayrıca yeniden çizme ve gecikme olmaksızın trendden çıkmak için sinyaller verir. Trend göstergesi, orta vadeli trendin yönünü izler, yönünü ve değişimini gösterir. Sinyal göstergesi volatilitedeki değişikliklere dayalıdır ve piyasa girişlerini gösterir. Gösterge, çeşitli uyarı türleri ile donatılmıştır. Çeşitli alım satım araçlarına ve zaman dilimlerine
Currency Strength Exotics
Bernhard Schweigert
4.88 (33)
ŞU ANDA %20 INDIRIMLI! Herhangi bir Acemi veya Uzman Tüccar için En İyi Çözüm! Bu Gösterge, Egzotik Çiftler Emtialar, Endeksler veya Vadeli İşlemler gibi herhangi bir sembol için para birimi gücünü göstermek için uzmanlaşmıştır. Türünün ilk örneğidir, Altın, Gümüş, Petrol, DAX, US30, MXN, TRY, CNH vb. gerçek para birimi gücünü göstermek için 9. satıra herhangi bir sembol eklenebilir. Bu benzersiz, yüksek kaliteli ve uygun fiyatlı bir ticaret aracıdır çünkü bir dizi tescilli özelliği ve yeni b
GM Arrows Pro
Guillaume Pierre Philippe Mesplont
Product Name: GM Arrows Pro – Signals & Alerts Short Description: GM Arrows Pro is a clean, reliable MT4 indicator showing BUY/SELL arrows on the chart with unique alerts at the moment the signal appears. Full Description: GM Arrows Pro is a professional MT4 indicator designed for traders who want clear, actionable signals: BUY and SELL arrows visible on the entire chart history Unique alerts when a new signal appears (no repeated alerts) Option to disable repetitive signals ( disable_repeatin
Candle Power Pro
Thushara Dissanayake
4.5 (8)
The       Mum Gücü Pro       çözmek için tasarlanmış sofistike bir ticaret aracıdır       gerçek hacim baskısı, kene verisi dengesizlikleri ve kurumsal sipariş akışı dinamikleri       ölçerek       Boğa keneleri ile ayı keneleri arasındaki savaş       gerçek zamanlı olarak. Bu gösterge ham verileri dönüştürür       hacim verilerini eyleme dönüştürülebilir içgörülere dönüştürerek   , yatırımcıların       Akıllı Para hareketleri, likidite avları ve gizli piyasa psikolojisi       her fiyat mumunun
Grafikleri yapılandıran ve döngüsel fiyat hareketlerini belirleyen teknik bir gösterge. Herhangi bir grafik üzerinde çalışabilirim. Birkaç çeşit bildirim var. Grafiğin kendisinde ek oklar var. Tarihe yeniden bakmadan, mumun kapanışına dair çalışmalar. M5 ve üzeri TF önerilir. Kullanımı ve yapılandırması kolay parametreler. Farklı parametrelere sahip 2 indikatörü kullanırken, bunları diğer indikatörler olmadan da kullanabilirsiniz. 2 giriş parametresi vardır Döngüsellik ve Sinyal Süresi Bu 2 pa
Unlock hidden profits: accurate divergence trading for all markets Tricky to find and scarce in frequency, divergences are one of the most reliable trading scenarios. This indicator finds and scans for regular and hidden divergences automatically using your favourite oscillator. [ Installation Guide | Update Guide | Troubleshooting | FAQ | All Products ] Easy to trade Finds regular and hidden divergences Supports many well known oscillators Implements trading signals based on breakouts Display
Trend Screener
STE S.S.COMPANY
4.79 (95)
Trend Göstergesi, Trend Alım Satım ve Filtreleme için Çığır Açan Benzersiz Çözüm, Tüm Önemli Trend Özellikleriyle Tek Bir Araç İçinde Yerleştirildi! Forex, emtialar, kripto para birimleri, endeksler ve hisse senetleri gibi tüm sembollerde/araçlarda kullanılabilen %100 yeniden boyamayan çoklu zaman çerçevesi ve Çoklu para birimi göstergesidir. SINIRLI SÜRELİ TEKLİF: Destek ve Direnç Tarama Göstergesi sadece 50$ ve ömür boyu mevcuttur. (Orijinal fiyat 250$) (teklif uzatıldı) Trend Screener, grafik
MBS RL Core
Aliaksandr Alferchyk
Trend dönüşü sırasında oluşan küresel dönüş seviyelerini gösteren bir göstergedir. Yüksek gerçekleşme potansiyeline sahip bölgeleri görüntüler. Tüm enstrümanlarla uyumludur: dövizler, metaller, endeksler, hisseler ve kripto paralar. Hem yeni başlayanlar hem de profesyoneller için uygundur . Bu gösterge yeniden çizim yapmaz (repaint etmez) ve iki veya daha fazla zaman diliminde kullanılmak üzere tasarlanmıştır. Daha yüksek zaman dilimi analizi, en iyi giriş noktasını bulmak için mevcut grafikte g
Yazarın diğer ürünleri
ProSignal Suite  One Indicator. Every Signal You Need. Most traders run five indicators and still miss the entry. ProSignal Suite solves that. It combines trend detection, momentum confluence, volume analysis, Smart Money structure, and candlestick pattern recognition into a single, precision-engineered signal engine. Every arrow on your chart has passed through six independent filter layers. If any layer fails, no signal appears. The result: fewer signals, higher quality, and the confidence to
SmartTrend Pro — Multi-Confirmation Trend Indicator for MT5 SmartTrend Pro is a professional, non-repainting trend indicator for MetaTrader 5. It combines four independent technical filters — EMA Crossover, RSI, Stochastic Oscillator, and ATR Volatility — into a single signal engine that confirms entries only on closed bars, eliminating false signals caused by mid-candle fluctuations. THE REPAINTING PROBLEM — AND HOW IT IS SOLVED Most trend indicators calculate signals on the current, still-open
"The last MT4 trend indicator you will ever need." SmartTrend Pro   is a professional-grade,   non-repainting   trend indicator for MetaTrader 4, built for traders who demand precision. By combining four proven technical strategies —   EMA Crossover, RSI, Stochastic Oscillator, and ATR Volatility Filter   — it delivers high-probability BUY and SELL signals confirmed only on bar close, eliminating false signals caused by mid-candle fluctuations. Why SmartTrend Pro? Most indicators suffer from one
Institutional Flow Detector (IFD)  Stop reacting to price. Start reading the market the way institutions do. Institutional Flow Detector is a professional-grade Smart Money indicator that detects the structural footprints of institutional order flow and converts them into clear, scored Buy/Sell arrows on your chart. Five independent detection modules score their alignment in real time — and a four-layer filter system ensures that only high-probability, trend-aligned setups ever produce a signal.
Volume Profile & VWAP Master Pro The Institutional-Grade Volume Analysis Tool for Serious Traders What Is This Indicator? Volume Profile & VWAP Master Pro   brings the most powerful institutional trading tools directly to your chart. Professional traders at banks, hedge funds, and prop firms rely on Volume Profile and VWAP every single day to find high-probability entries, spot hidden support and resistance, and understand where the "smart money" is positioned. This indicator combines   seven pr
MTF Structure Map Institutional-Grade Multi-Timeframe Market Structure Analysis See What the Institutions See — Directly on Your Chart Most traders lose money not because they lack discipline, but because they are reading the wrong timeframe at the wrong time. MTF Structure Map solves this by projecting the higher timeframe's full market structure — swing pivots, structural breaks, and premium/discount zones — directly onto your current chart, in real time. No more switching between timeframes.
ProSignal Suite  One Indicator. Every Signal You Need. Most traders run five indicators and still miss the entry. ProSignal Suite solves that. It combines trend detection, momentum confluence, volume analysis, Smart Money structure, and candlestick pattern recognition into a single, precision-engineered signal engine. Every arrow on your chart has passed through six independent filter layers. If any layer fails, no signal appears. The result: fewer signals, higher quality, and the confidence to
Institutional Flow Detector (IFD)  Stop reacting to price. Start reading the market the way institutions do. Institutional Flow Detector is a professional-grade Smart Money indicator that detects the structural footprints of institutional order flow and converts them into clear, scored Buy/Sell arrows on your chart. Five independent detection modules score their alignment in real time — and a four-layer filter system ensures that only high-probability, trend-aligned setups ever produce a signal.
Filtrele:
İnceleme yok
İncelemeye yanıt