 MetaTrader 5
 Experts
 지표
지표
 라이브러리
라이브러리
 유틸리티
유틸리티
 위젯
위젯
 규칙
규칙
MetaTrader 4용 기술 지표
 아래 나열된 기술 지표의 시그널은 MetaTrader 4 플랫폼의 거래를 열고 종료하는 데 중요한 역할을 합니다.
지표의 본질은 가격 변화를 예측하기 위한 금융 시그널 값의 수학적 변형입니다.
아래 나열된 기술 지표의 시그널은 MetaTrader 4 플랫폼의 거래를 열고 종료하는 데 중요한 역할을 합니다.
지표의 본질은 가격 변화를 예측하기 위한 금융 시그널 값의 수학적 변형입니다. 
ZORYK — MetaTrader 4용 XAUUSD 전문 신호 및 트레이드 플래닝 시스템
이런 경험이 있을 것입니다.
골드를 분석하고 진입을 기다린 뒤 마침내 포지션을 열었지만 가격이 곧바로 반대 방향으로 움직입니다. 너무 일찍 청산하거나 Stop Loss를 옮기거나 몇 초 동안 망설입니다. 그 후 시장은 내가 없이도 처음 예상했던 목표까지 정확히 움직입니다.
문제는 항상 방향이 아니었습니다.
진짜 문제는 불확실성이었습니다.
정확한 진입 위치를 몰랐습니다. 어느 지점에서 원래의 트레이드 아이디어가 무효가 되는지 몰랐습니다. 가까운 수익을 확보해야 할지 더 큰 움직임을 기다려야 할지 판단하기 어려웠습니다. 현재 setup이 정말 강한지 아니면 단지 새로운 거래를 억지로 찾고 있는지도 확신하기 어려웠습니다.
골드는 매우 빠르게 움직입니다. 명확한 계획이 없다면 좋은 분석도 몇 초 만에 나쁜 결정으로 바뀔 수 있습니다.
ZORYK는 이 문제를 해결하기 위해 개발되었습니다.

Trend Sniper X 는 트레이더가 명확하고 정확하게 트렌드 방향과 잠재적 반전 지점을 포착할 수 있도록 돕는 MetaTrader 5 전용 멀티 타임프레임 추세 추종 지표입니다. MT5 버전 링크: https://www.mql5.com/en/market/product/181101 가격 안내: 현재 가격은 프로모션 할인가이며, 향후 업데이트 및 새 기능 출시 시 인상될 수 있습니다. Code2Profit 채널 멀티 타임프레임 분석으로 시장을 정복하세요! Trend Sniper X로 승률을 극대화하는 방법: 핵심 규칙 및 세션 팁 기술 사양 플랫폼 MetaTrader 5 지표 유형 멀티 타임프레임 추세 지표 작동 타임프레임 모든 차트 타임프레임 (상위 타임프레임 M1–MN1 독립 선택 가능) 주요 종목 외환(Forex), 골드(XAUUSD) 및 기타 CFD 추천 계좌 모든 계좌 유형 시각화 컬러 추세 캔들 (매수/매도/약세/변화) + 매수/매도 화살표 추가 모듈 세션 마켓 박스 (

Tokyo Indicator는 추세 방향, 잠재적 거래 신호 및 시장 상황을 명확하고 시각적으로 보여줍니다. 색상으로 구분된 계단식 추세선은 강세 구간(파란색)과 약세 구간(자홍색)을 명확히 구별해 줍니다. 추세가 전환될 때 나타나는 방향성 화살표는 잠재적인 매수 및 매도 기회를 강조하여 보여줍니다. 통합 대시보드는 현재 신호, 시장 성향(bias), 모멘텀, 변동성, 신호 품질 등의 정보를 한눈에 파악할 수 있도록 구성되어 있습니다. 이를 통해 트레이더는 별도의 패널을 오갈 필요 없이 가격 움직임(price action)과 지표의 데이터를 동시에 분석할 수 있습니다. 깔끔한 차트 화면과 간결한 시장 개요를 제공하는 Tokyo Indicator는 체계적인 추세 분석과 거래 결정을 지원합니다. 모든 시간대와 다양한 자산(특히 금)에서 활용할 수 있습니다. 추세 방향, 잠재적 거래 신호 및 시장 상황을 명확하고 시각적으로 보여줍니다. 색상으로 구분된 계단식 추세선은 강세 구간(파란색)

SR Liquidity 는 시장 유동성이 집중되고 가격이 가장 강력하게 반응하는 숨겨진 구간을 포착하도록 설계된 트레이딩 지표입니다. 이러한 특수 유동성 구간은 강력한 지지 및 저항선 역할을 하며, 시장 반전 가능성이 가장 높은 지점을 명확하게 보여주는 지도가 되어 줍니다. SR Liquidity는 일반적인 지지 및 저항선을 단순히 그리는 대신, 실제 가격 움직임을 분석하여 매수 및 매도 압력이 집중되는 구간을 포착합니다. 이러한 구간은 실질적인 시장의 흐름을 주도하는 유동성 풀(liquidity pools)에 해당합니다. 이 지표는 해당 구간을 차트에 직접 시각화하여, 가격 반응이 실제로 나타나기 전에 이를 미리 예측할 수 있도록 돕습니다. 즉, 가격 추세가 전환될 가능성을 사전에 파악하게 해주는 것입니다. 결과적으로 이 지표는 가공되지 않은 가격 움직임(price action)을 시장의 핵심 가격대, 다시 말해 추세 전환점이 될 수 있는 지점들을 보여주는 명확하고 실용적인 로드맵

GoldRush 트렌드 화살표 신호
GoldRush 트렌드 화살표 신호 지표는 XAU/USD 시장에서 고속 단기 스캘핑 트레이더를 위해 설계된 정밀한 실시간 트렌드 분석을 제공합니다.
1분 시간대에 특화되어 설계된 이 도구는 명확한 진입점을 표시하는 방향성 화살표를 제공하여 스캘퍼들이 변동성이 높은 시장 환경에서도 자신 있게 거래할 수 있도록 합니다.
이 지표는 PRIMARY 및 SECONDARY 경고 화살표로 구성됩니다. PRIMARY 신호는 추세 방향의 변화를 나타내는 흰색과 검은색 방향성 화살표이며, SECONDARY 신호는 PRIMARY 화살표가 지시하는 방향을 확인하고 잠재적인 거래 진입점을 표시하는 파란색과 빨간색 화살표입니다.
참고: 추세 방향이 변경된 후 PRIMARY 경고 화살표가 단 하나만 표시될 경우, 다수의 SECONDARY 파란색/빨간색 화살표가 표시될 수 있음을 유의해야 합니다. SECONDARY 신호는 신호 기준을 충족하는 어떤 캔들 이후에도 표시

Atomic Analyst — MetaTrader 4 제품 문의, 설정 안내 또는 기술 지원이 필요하면 MQL5에서 직접 메시지를 보내 주세요. 이 인디케이터는 복잡한 시장 계산을 단순한 시각적 신호, 색상 표시 캔들, 추세 판독, 손절 레벨 및 여러 익절 구간으로 변환하여 트레이더가 빠르게 이해하고 실제 시장 상황에서 사용할 수 있게 합니다. 주요 거래 용도: 스캘핑 및 인트라데이 거래:
빠른 의사결정, 명확한 화살표, 알림, 캔들 색상 및 구조화된 진입/청산 구간을 위해 설계되었습니다. 데이 트레이딩 및 스윙 트레이딩:
추세 방향, 강도, 모멘텀 및 다중 시간대 분석을 사용하여 더 큰 시장 움직임을 따라갈 수 있도록 돕습니다. 주요 기능: • Price Action, 강도 및 모멘텀 분석
• 다중 시간대 추세 스캐너
• 전체 추세 비율 계산
• 매수 및 매도 화살표
• 손절 및 여러 익절 레벨
• 최대 5개의 피보나치 기반 익절 레벨
• 트레일링 스톱 로직
• 추세 및 모멘텀

M1 SNIPER 는 사용하기 쉬운 거래 지표 시스템입니다. M1 시간대에 맞춰 설계된 화살표 지표입니다. 이 지표는 M1 시간대 스캘핑을 위한 단독 시스템으로 사용할 수 있으며, 기존 거래 시스템의 일부로도 사용할 수 있습니다. 이 거래 시스템은 M1 시간대 거래용으로 특별히 설계되었지만, 다른 시간대에도 사용할 수 있습니다. 원래는 XAUUSD와 BTCUSD 거래를 위해 이 방법을 설계했지만, 다른 시장 거래에도 유용하다는 것을 알게 되었습니다. 이 지표의 신호는 추세 방향과 반대로 거래될 수 있습니다. 저는 지표의 신호를 활용하여 양방향으로 거래할 수 있도록 돕는 특별한 거래 기법을 알려드립니다. 이 방법은 특별한 동적 지지선과 저항선 가격 영역을 활용하는 것을 기반으로 합니다. 구매하시면 M1 SNIPER 화살표 지표를 바로 다운로드하실 수 있습니다. 또한, 아래 스크린샷에 표시된 Apollo Dynamic SR 지표는 M1 SNIPER 도구를 사용하는 모든 사용자에게 무료로

Smart Trend Trading System은 추세 정보, 진입·청산 신호, 가격 수준을 하나의 차트에 표시하는 MetaTrader 4용 지표입니다. 이 시스템은 추세 감지, 반전 구간, Smart Cloud, 트레일링 스톱 로직, 지지와 저항, 캔들 색상 표시, 알림, 다중 시간대 분석 등 10개 이상의 트레이딩 도구 를 하나의 시스템으로 결합합니다. 이 시스템은 다양한 시장 상황에서 거래를 돕도록 설계되었습니다: 추세장:
주요 추세를 식별하고, 되돌림을 감지하며, 모멘텀을 따라가고, 손절 가이드와 트레일링 스톱 옵션을 사용해 더 깔끔한 진입 지점을 찾습니다. 횡보장:
박스권 시장 상황을 감지하고, 반응 구간을 식별하며, 가격이 중요한 레벨에서 반응할 때 더 명확한 신호를 받을 수 있습니다. 스캘핑 및 인트라데이 거래:
빠른 신호, 캔들 색상, 알림, 다중 시간대 확인을 사용하여 단기 거래 결정을 지원합니다. 주요 기능: • 10개 이상의 인디케이터를 하나의 트레이딩 시스

Miraculous Indicator Binary & Forex v3 StrategySafe Miraculous Indicator Binary & Forex v3 StrategySafe 는 명확한 신호, 강력한 확인 도구, 그리고 Binary 및 Forex 시장에서 사용할 수 있는 체계적인 거래 방식을 원하는 트레이더를 위한 전문 지표입니다. v3 버전에는 MIR Dashboard, Miraculous Confirmation Dashboard, GANN Law, Square of 9 레벨, GANN 각도, 그리고 더욱 강화된 Forex 모드가 포함되어 있습니다. 주요 기능 Binary 모드와 Forex 모드를 하나의 지표에서 지원. MIR Dashboard로 빠른 시장 흐름 확인. Miraculous Confirmation Dashboard로 진입 신호 확인. Forex 분석을 위한 GANN Law drawing lines. Square of 9 라인, 레벨, 방향 표시. 1x1 G

Liquidity Scalper System: 인디케이터 형식의 유동성 기반 트레이딩 시스템입니다. 대부분의 인디케이터는 화살표만 보여주고, 손절을 어디에 둘지, 목표가 어디인지, 신호를 믿어도 되는지는 트레이더가 스스로 판단해야 합니다. Liquidity Scalper System은 거래의 전체 주기를 다룹니다. 유동성 풀을 찾고, 돌파 시 신호를 주며, Entry, Stop Loss와 세 개의 목표를 즉시 계산하고, 패널에 통계와 새로운 데이터에 대한 검증 결과를 표시합니다. 설정은 시스템이 스스로 선택하고 매일 업데이트합니다. 작동 방식 1. 시스템이 유동성 풀을 찾습니다. 시장 참여자들의 스톱 주문이 쌓여 있는 레벨입니다. 2. 가격이 풀을 돌파하고 그 돌파가 움직임의 강도(필요 시 거래량)로 확인되면 차트에 BUY 또는 SELL 화살표가 나타납니다. 3. Entry, Stop Loss, TP1, TP2, TP3 레벨이 영역 채우기와 함께 즉시 그려집니다. 4. 오른쪽에 유

PRO Renko System 은 RENKO 차트 거래를 위해 특별히 고안된 매우 정확한 거래 시스템입니다.
이것은 다양한 거래 상품에 적용될 수있는 보편적 인 시스템입니다. 체계는 효과적으로 당신에게 정확한 반전 신호에 접근을 주는 소위 시장 소음을 중화합니다.
이 표시기는 사용하기가 매우 쉽고 신호 생성을 담당하는 매개 변수가 하나만 있습니다. 당신은 쉽게 당신의 선택의 어떤 무역 계기에 공구를 적응시킬 수 있고 renko 막대기의 크기.
나는 항상 당신이 내 소프트웨어로 수익성있게 거래 할 수 있도록 추가 지원을 제공 할 준비가되어 있습니다!
나는 당신에게 행복하고 수익성있는 거래를 기원합니다!
구매 후 저에게 연락하십시오! 내 렌코 차트 생성기를 보내드립니다. 또한 내 개인 권장 사항 및 시스템의 다른 모듈을 무료로 공유 할 것입니다!

탑 바텀 트래커는 시장 추세를 분석하고 추세의 고점과 저점을 감지할 수 있는 정교한 알고리즘을 기반으로 하는 지표입니다 / MT5 버전 .
가격은 500$에 도달할 때까지 점진적으로 상승합니다. 다음 가격 --> $99
특징 다시 칠하지 않음 이 표시기는 새 데이터가 도착해도 값을 변경하지 않습니다
거래 쌍 모든
외환 쌍
기간 모든
기간
파라미터 ==== 인디케이터 구성 ====
구성 매개 변수 // 40 (값이 높을수록 신호가 적지만 더 정확한 신호가 제공됩니다)
상위 레벨 값 // 80 (상단 수평선의 값)
하단 레벨 값 // 20 (하단 수평선 값)
인디케이터 계산 막대 수 // 3000 (인디케이터를 계산할 막대 수). 값 0은 모든 막대에 대해 인디케이터를 계산합니다)
==== 알람 구성 ====
팝업 알림 // 참(터미널에서 알람)
이메일 알림 // 참(이메일로 알람 전송)
알람 시간 간격 // 10 (분 단위의 알람 간격)
경고

Neuro Poseidon is a new indicator by Daria Rezueva. It combines precise trading signals with adaptive TP/SL levels - creating best possible trades as a result! Message me and get Neuro Poseidon Assistant as a gift to automize your trading process!
What makes it stand out?
1. Proven profitability on all assets and timeframes
2. Only confirmed BUY and SELL signals present on the chart
3. Adaptive TP & SL levels generated by the software for each trade
4. Easy to understand - suitable for all

Elliott Wave Trend was designed for the scientific wave counting. This tool focuses to get rid of the vagueness of the classic Elliott Wave Counting using the guideline from the template and pattern approach. In doing so, firstly Elliott Wave Trend offers the template for your wave counting. Secondly, it offers Wave Structural Score to assist to identify accurate wave formation. It offers both impulse wave Structural Score and corrective wave Structure Score. Structural Score is the rating to sh

Gann Made Easy 는 mr.의 이론을 사용하여 최고의 거래 원칙을 기반으로 하는 전문적이고 사용하기 쉬운 Forex 거래 시스템입니다. W.D. 간. 이 표시기는 Stop Loss 및 Take Profit Levels를 포함하여 정확한 BUY 및 SELL 신호를 제공합니다. PUSH 알림을 사용하여 이동 중에도 거래할 수 있습니다. 구매 후 거래 방법 안내 및 유용한 추가 지표를 무료로 받으시려면 저에게 연락주세요! 아마도 Gann 거래 방법에 대해 이미 여러 번 들었을 것입니다. 일반적으로 Gann의 이론은 초보자 거래자뿐만 아니라 이미 거래 경험이 있는 사람들에게도 매우 복잡한 것입니다. Gann의 거래 방식은 이론적으로 적용하기 쉽지 않기 때문입니다. 나는 그 지식을 연마하고 Forex 지표에 최고의 원칙을 적용하기 위해 몇 년을 보냈습니다. 표시기는 적용하기가 매우 쉽습니다. 차트에 첨부하고 간단한 거래 권장 사항을 따르기만 하면 됩니다. 지표는 지속적으로 시장 분석

Unlock hidden profits: accurate divergence trading for all markets Tricky to find and scarce in frequency, divergences are one of the most reliable trading scenarios. This indicator finds and scans for regular and hidden divergences automatically using your favourite oscillator. [ Installation Guide | Update Guide | Troubleshooting | FAQ | All Products ]
Easy to trade
Finds regular and hidden divergences Supports many well known oscillators Implements trading signals based on breakouts Display

현재 40% 할인
초보자 또는 전문가 트레이더를 위한 최고의 솔루션!
이 지표는 우리가 독점 기능과 새로운 공식을 통합했기 때문에 독특하고 고품질이며 저렴한 거래 도구입니다. 단 하나의 차트로 28 Forex 쌍의 통화 강도를 읽을 수 있습니다! 새로운 추세 또는 스캘핑 기회의 정확한 트리거 포인트를 정확히 찾아낼 수 있기 때문에 거래가 어떻게 개선될지 상상해 보십시오.
사용 설명서: 여기를 클릭 https://www.mql5.com/en/blogs/post/697384
그것이 첫 번째, 원본입니다! 쓸모없는 지망생 클론을 사지 마십시오.
더 스페셜 강력한 통화 모멘텀을 보여주는 하위 창의 화살표 GAP가 거래를 안내합니다! 기본 또는 호가 통화가 과매도/과매도 영역(외부 시장 피보나치 수준)에 있을 때 개별 차트의 기본 창에 경고 표시가 나타납니다. 통화 강도가 외부 범위에서 떨어질 때 풀백/반전 경고. 교차 패턴의 특별 경고
추세를 빠르게 볼 수 있는 다중 시간

Fibonacci Trend Marker — is a trend indicator that analyzes the behavior of the current candle relative to the High-Low (HL) range of previous candles using Fibonacci retracement levels. It visually tracks trend strength, signaling potential weakening or reversal through a change in candle color.
Features: Designed for trend-focused traders, it helps quickly identify trend changes based on Fibonacci levels. Effective on any timeframe with sufficient market volatility, when a sequence of 3–5 c

현재 30% 할인!
이 대시보드는 여러 기호와 최대 9개의 타임프레임에서 작동하는 매우 강력한 소프트웨어입니다. 주요 지표(최상의 리뷰: 고급 공급 수요)를 기반으로 합니다. Advanced Supply Demand
대시보드는 훌륭한 개요를 제공합니다. 다음과 같이 표시됩니다. 영역 강도 등급을 포함하여 필터링된 공급 및 수요 값, 영역에 대한/및 영역 내 Pips 거리, 중첩된 영역을 강조 표시하고 모든 (9) 시간 프레임에서 선택한 기호에 대해 4가지 종류의 경고를 제공합니다. 그것은 당신의 개인적인 필요에 맞게 고도로 구성 가능합니다!
당신의 혜택!
모든 트레이더에게 가장 중요한 질문:
시장에 진입하기에 가장 좋은 수준은 무엇입니까? 최고의 성공 기회와 위험/보상을 얻으려면 강력한 공급/수요 영역 내 또는 그 근처에서 거래를 시작하십시오.
손절매를 위한 최적의 장소는 어디입니까? 가장 안전하려면 강력한 수요/공급 구역 아래/위에 정류장을 두십시오.

M1 Arrow는 변동성과 거래량 분석을 포함한 시장의 자연스러운 거래 원칙에 기반한 지표입니다. 모든 시간 프레임과 외환 쌍에서 사용할 수 있으며, 지표 내의 간편한 파라미터 설정을 통해 원하는 외환 쌍과 시간 프레임에 맞춰 신호를 조정할 수 있습니다. 매수/매도 신호를 제공하는 기본 알고리즘 외에도, 입력값에 따라 선택할 수 있는 다양한 추가 전략이 내장되어 있습니다. 이러한 전략은 별도의 설정이 필요하지 않으며, 지표가 선택한 전략 모드에 따라 자동으로 설정을 적용합니다. 이 알고리즘은 추가 필터를 사용하여 거래량과 가격 파동을 분석합니다. 지능형 알고리즘을 통해 두 가지 시장 요소가 결합될 때만 신호를 생성합니다. 지표는 특정 범위의 파동을 계산하고, 거래량 분석을 통해 파동을 확인합니다. 구매 후 저에게 연락하시면 거래 팁과 유용한 보너스 지표를 무료로 제공해 드립니다!

DayTrader PRO MT5: https://www.mql5.com/en/market/product/186222 DayTrader PRO는 존 에러스(John Ehlers)의 Laguerre 필터와 강력한 자동 최적화 엔진을 결합한 고급 트레이딩 지표입니다. 고정된 파라미터를 사용하는 대신, 최근 시장 상황을 바탕으로 최적의 설정을 자동으로 검색하므로 지속적인 수동 조정 없이도 변화하는 시장 변동성에 대응할 수 있습니다. 이 지표는 명확한 매수(BUY) 및 매도(SELL) 신호를 생성하며, 현재 시장 변동성을 기준으로 계산된 적응형 손절매(Stop Loss) 및 익절(Take Profit) 레벨을 제공합니다. 내장된 추세, 효율성 지수(Efficiency Ratio), 변동성 및 캔들 필터 기능은 저품질의 진입 신호를 제거하여 신호의 정확도를 높여줍니다. 실시간 성능 대시보드에서는 현재 최적화된 설정값, 수익 요인(Profit Factor), 승률(Win Rate), 최대 낙폭

KURAMA GOLD SIGNAL PRO (MT4) — 7중 필터 · 자동 TP/SL · 품질 점수 · 시그널 기록 저장 | XAUUSD 완전 트레이딩 시스템
실시간 리페인트 없음. 시그널이 나타나는 순간 화살표, 진입, TP, SL이 그 자리에 고정되어 이후 절대 움직이지 않습니다. 여러분이 거래하는 것은 바로 이 실시간 시그널입니다. 그리고 v7.20에서는 실제로 발신된 모든 시그널이 자동 저장되어 재시작 후에도 정확히 복원됩니다.
구매자 전용 보너스 평생 라이선스를 구매하시면 AI Zone Radar($59 상당) + 완전 PDF 매뉴얼을 무료로 드립니다. 제품 가격에 더해 $59 상당의 보너스가 따라옵니다. 구매 후 MQL5로 메시지를 보내주세요. AI Zone Radar: https://www.mql5.com/en/market/product/175834
골드 트레이더 커뮤니티에서 실제로 사용되며 정확성과

"다이나믹 스캘핑 오실레이터"는 MT4를 위한 고급 맞춤형 암호화폐/외환 지표이자 효율적인 트레이딩 도구입니다! - 차세대 오실레이터 - 사용 방법은 그림을 참조하세요. - 다이나믹 스캘핑 오실레이터는 적응형 과매도/과매수 영역을 제공합니다. - 오실레이터는 동적인 과매도/과매수 영역에서 정확한 진입 시점을 찾는 보조 도구입니다. - 과매도 값: 녹색선 아래, 과매수 값: 주황색선 위. - 이 지표는 가격 변동 패턴과도 결합하기 좋습니다. - 일반 오실레이터보다 훨씬 정확합니다. - PC 및 모바일 알림 기능 제공. .......................................................................... 여기를 클릭하여 고품질 트레이딩 로봇과 지표를 확인하세요! MQL5 웹사이트에서만 제공되는 오리지널 제품입니다.

Identify over 30 candlestick patterns with precision
This indicator recognizes over 30 Japanese Candlestick Patterns and highlights them beautifully on the chart. It is simply one of those indicators price action traders can't live without. [ Installation Guide | Update Guide | Troubleshooting | FAQ | All Products ] Boost your technical analysis overnight Detect japanese candlestick patterns easily Trade reliable and universal reversal patterns Hop onto established trends safely using continua

Break and Retest Hunter MT4 is a powerful MetaTrader 5 indicator designed to automatically identify support and resistance levels, breakout structures, and potential retest opportunities in real time. Bonus Indicator: After purchasing Break and Retest Hunter , contact me to receive Trade Indicator Assistant EA completely free as a bonus utility.
$65 for the next 10 copies . Next price is $120. Combining adaptive market analysis, clear BUY/SELL signals, Fibonacci-based profit targets, and a pre

This is a professional chart indicator designed for traders focused on stability and clear price action. It helps filter market noise and provides clear visual entry and exit zones for your trading decisions. Core Features: Strictly Non-Repainting: The system is built with strict non-repaint logic. What you see on the chart is the true historical performance. Confirmed Signals: Signals are triggered and confirmed only after the candle closes . Once a trading arrow appears on a closed candle, it

Quantum Naked SMC Prime is a streamlined Smart Money Concepts indicator designed for traders who prefer a clean chart, structured market analysis and clear visual trade setups without unnecessary complexity. The indicator combines market structure, liquidity behavior, institutional zones and confirmation logic into a compact analytical framework. Instead of flooding the chart with technical indicators, Quantum Naked SMC Prime focuses on the core elements of price action and Smart Money Concepts

Forex Breath System 은 모든 시장에서 사용할 수 있는 추세 기반 거래 시스템입니다. 이 시스템은 통화, 금속, 원자재, 지수, 암호화폐, 심지어 주식에도 사용할 수 있습니다. 또한 어떤 시간대에도 사용할 수 있습니다. 이 시스템은 보편적입니다. 추세를 보여주고 추세와 함께 화살표 신호를 제공합니다. 또한 이 지표는 신호가 추세 방향으로 나타날 때 특별한 유형의 경고를 제공하여 추세 거래를 쉽게 만들어줍니다. 이 표시기는 이해하기 어려운 설정을 전혀 처리할 필요가 없으므로 사용하기가 매우 쉽습니다. 차트에 첨부하기만 하면 거래 준비가 완료됩니다. 어떤 거래 스타일을 선호하든 시스템은 시장 방향과 추세 방향에서 가능한 진입점을 확인하는 데 도움이 됩니다. 표시기는 PUSH 알림을 포함한 모든 유형의 경고를 제공합니다. 거래 지침과 큰 보너스를 받으려면 구매 후 저에게 연락하십시오! 행복하고 수익성 있는 거래를 기원합니다!

Prop Firm Sniper MT4 is a professional market structure indicator that automatically identifies high-probability BUY and SELL opportunities using BOS and CHoCH analysis.
Recommended Timeframes: For backtesting, use the indicator on M5 or M15 for Gold (XAUUSD), and M15 or H1 for more volatile Forex pairs such as GBPUSD, USDJPY, EURGBP , and similar markets.
CONTACT ME AFTER PURCHASE TO CLAIM YOUR FREE BONUSES!
Prop Firm Sniper is a professional market structure indicator designed t

Boost your trading precision with the versatile wedges tool
The PZ Wedges Indicator is a technical analysis tool that helps traders identify potential continuation patterns in the market. These patterns, known as wedges, are formed when the price of an asset consolidates within a narrowing range, bounded by upward or downward converging trendlines. Wedges are considered to be continuation patterns because they often precede a breakout in the direction of the preceding trend. When a wedge pattern

매트릭스 화살표 표시기 MT4 는 외환, 상품, 암호 화폐, 지수, 주식과 같은 모든 기호/도구에 사용할 수 있는 100% 다시 칠하지 않는 다중 기간 표시기를 따르는 고유한 10 in 1 추세입니다. Matrix Arrow Indicator MT4 는 다음과 같은 최대 10개의 표준 지표에서 정보와 데이터를 수집하여 초기 단계에서 현재 추세를 결정합니다. 평균 방향 이동 지수(ADX) 상품 채널 지수(CCI) 클래식 하이켄 아시 캔들 이동 평균 이동 평균 수렴 발산(MACD) 상대 활력 지수(RVI) 상대 강도 지수(RSI) 포물선 SAR 스토캐스틱 오실레이터 윌리엄스의 백분율 범위 모든 지표가 유효한 매수 또는 매도 신호를 제공하면 강력한 상승/하락 추세를 나타내는 다음 캔들/막대가 시작될 때 해당 화살표가 차트에 인쇄됩니다. 사용자는 사용할 표시기를 선택하고 각 표시기의 매개변수를 개별적으로 조정할 수 있습니다. 매트릭스 화살표 표시기 MT4는 선택한 표시기에서만 정보를 수

Volume Break Oscillator는 가격 움직임을 오실레이터 형태로 볼륨 추세와 일치시키는 지표입니다.
저는 볼륨 분석을 제 전략에 통합하고 싶었지만 OBV, Money Flow Index, A/D, Volume Weighted Macd 및 기타 여러 지표와 같은 대부분의 볼륨 지표에 항상 실망했습니다. 그래서 저는 이 지표를 직접 작성했고, 얼마나 유용한지 만족스러워서 시장에 공개하기로 결정했습니다.
주요 기능:
가격이 볼륨 증가(브레이크)로 지원되는 방향으로 움직이는 단계를 강조합니다. 볼륨 증가가 멈추고 시장이 수축되는 단계를 강조합니다. 특히 시간 프레임(<=15분)이 있는 일중 거래에서 가격이나 볼륨이 움직이지 않아 시장이 향후 상승에 대비하는 단계를 강조합니다. 볼륨 증가로 지원되지 않는 다른 전문가 자문가의 거짓 신호를 걸러냅니다. 추세와 범위 단계를 시각화하는 것이 매우 쉽습니다. 입력 매개변수:
계산 설정:
계산 유형: FAST, NORMAL, S

Scalper Inside PRO helps you read the intraday trend and plan a trade before you enter the market. It is built around three exclusive strategies for a sharper read of the market. The moment a signal appears, the indicator evaluates market direction and calculates the key levels, so you see the potential entry, the expected stop-loss and several profit-taking levels in advance. Detailed performance statistics show how different instruments and strategies performed in history and help you pick ass

The Super Arrow Indicator provides non-repainting buy and sell signals with exceptional accuracy. Key Features No repainting – confirmed signals remain fixed Clear visual arrows: green for buy, red for sell Real-time alerts via pop-up, sound, and optional email Clean chart view with no unnecessary clutter Works on all markets: Forex, gold, oil, indices, crypto Adjustable Parameters TimeFrame Default: "current time frame" Function: Sets the time frame for indicator calculation Options: Can be set

골드 타겟은 최고의 추세 지표입니다. 지표의 고유한 알고리즘은 기술 및 수학적 분석 요소를 고려하여 자산 가격의 움직임을 분석하고 가장 수익성이 높은 진입점을 결정하며 화살표 및 가격 수준(BUY Entry / SELL Entry) 형태로 신호를 발행합니다. 주문을 엽니다. 표시기는 또한 손절매 가격 수준과 이익 실현을 위한 5가지 가격 수준을 즉시 표시합니다.
주의: 표시기는 사용이 매우 쉽습니다. 한 번의 클릭으로 차트에 표시기를 설치하고 신호 및 가격 수준에 따라 거래하세요. 차트에서는 지표가 설치된 시간대에 관계없이 4개의 시간대(M30 H1 H4 D1)에서 추세 상태가 표시됩니다.
지표의 장점:
1. 표시기는 높은 정확도의 신호를 생성합니다. 2. 표시 신호는 다시 그려지지 않습니다. 가격이 각 라인을 넘으면 소리 알림(알림 및 메시지)이 장착됩니다. 3. 모든 브로커의 MetaTrader 4 거래 플랫폼에서 거래할 수 있습니다. 4. 모든 자산(통화, 금속, 암호화

The Extreme point indicator helps in determining the probable price reversal points on the chart. The indicator facilitates the search for points to enter the market with greater accuracy. The indicator displays certain impulses, after which there is a high probability of the price continuing its movement in the same direction. The indicator can be used in conjunction with other indicators for a more accurate detection of the position entry points. The indicator can also be used independently. F

JSL Orderflow Footprint turns every candle into a price ladder that shows how much volume traded on the bid and on the ask at each price level. It highlights diagonal imbalances, stacked imbalance zones, absorption at candle extremes, cumulative delta (CVD), delta divergence and the daily session volume profile, then combines five of these order-flow conditions into a 0–100 confluence score. A signal is only issued on bar close when the score is high, clearly one-sided and confirmed by the candl

Elliott Live 는 MetaTrader 5용 인디케이터로, 과거 차트와 현재 봉 모두에서 엘리엇 파동을 자동으로 표시합니다. 완성된 파동은 실선으로, 형성 중인 파동은 점선과 물음표 라벨(예: "3?")로 그려지며, 피보나치 목표 구간과 무효화 레벨도 함께 표시됩니다. MT5-version: https://www.mql5.com/en/market/product/200604
작동 방식 먼저 스윙(ZigZag)을 만듭니다. 가격이 극값에서 ATR × 배수 이상 되돌림하면 반전으로 인식합니다. 마지막 점은 현재의 극값으로, 아직 확정되지 않았으며 움직일 수 있습니다. 이 스윙 위에서 엘리엇 규칙에 따라 충격파 1-2-3-4-5를 찾습니다. 2파는 1파의 시작점을 넘지 않고, 3파는 가장 짧은 파동이 되지 않으며, 4파는 1파의 영역에 들어가지 않습니다. 충격파 다음에는 조정파 A-B-C를, 그다음에는 다음 충격파를 찾습니다. 최근 스윙이 패턴의 일부(예: 1-2)만 이루고 있으

CRT Candle Range Theory HTF MT4 - Ultimate CRT Indicator: 고급 ICT 개념 및 Malaysian SnR 트레이딩 시스템 가장 진보된 Candle Range Theory 지표로 마켓 메이커의 발자취를 마스터하십시오. Ultimate CRT Indicator를 사용하여 Smart Money Concepts(SMC)의 진정한 힘을 발휘하고 기관처럼 정확하게 거래하십시오. 진지한 트레이더를 위해 독점적으로 제작된 이 지표는 ICT Concepts(Inner Circle Trader)의 핵심 기둥인 매우 효과적인 Candle Range Theory(CRT)를 자동화하고 Malaysian Support and Resistance(SnR) 진입 방법과 FVG(Imbalance) 영역의 치명적인 정밀도로 이를 강화합니다. MT4 또는 MT5에서 Forex, Crypto 또는 지수를 거래하든 이 알고리즘은 시장 소음을 제거하고 가짜 돌파(fakeout)

골드 ZigZag - 실제로는 다시 칠하지 않고 LAG도 없는 지그재그인 화살표 표시기로 양초가 열릴 때 신호를 제공합니다! 이 표시기는 XAUUSD 쌍(골드)을 위해 특별히 설계되었습니다. 다른 쌍에도 표시기를 사용할 수 있지만 원래 표시기는 금에만 사용하도록 되어 있었습니다. 이 지표는 모든 기간에 사용할 수 있지만 H4 및 D1과 같은 더 높은 기간을 권장합니다. 이 지표는 사용하기 쉽고 상인의 특별한 기술이나 지식이 필요하지 않습니다. 표시기에는 길이와 감도라는 두 가지 공개 매개변수만 있습니다. 이 두 매개변수를 사용하여 개인 거래 선호도에 따라 신호를 조정할 수 있습니다. PUSH 알림을 이용해 이동 중에도 거래가 가능합니다. 거래 팁과 큰 보너스를 얻으려면 구매 후 저에게 연락하십시오! 행복하고 수익성 있는 거래를 기원합니다!
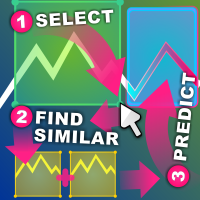
유사 가격 액션 지표 유사 가격 액션은 선택한 차트 영역과 가능한 한 유사한 캔들스틱 패턴의 과거 시퀀스를 찾습니다.
지표는 선택한 가격 액션 영역의 첫 번째 캔들스틱 바로 앞에서 시작하여 차트의 가장 오래된 첫 번째 막대까지 검색을 수행합니다.
두 시퀀스 간의 유사성을 평가하는 데는 몇 가지 기준이 있습니다. 시퀀스는 길이가 동일해야 합니다. 선택한 영역이 20개의 캔들스틱 너비인 경우 일치하는 결과도 20개의 캔들스틱 너비여야 합니다. 원하는 만큼 많은 캔들을 선택할 수 있습니다. 시퀀스는 고가에서 저가까지의 크기로 시각적으로 비교됩니다. 시퀀스는 시가에서 마감까지의 크기와 방향으로 시각적으로 비교됩니다. 캔들스틱 막대가 한 시퀀스에서는 강세이고 다른 시퀀스에서는 약세이면 점수는 0.0으로 설정됩니다. 시퀀스에는 델타에서 비교되는 빠르고 느린 이동 평균이 있습니다. 델타는 해당 영역 내에서 상대적으로 비교하거나 전체 자산에서 절대적으로 비교할 수 있습니다(상대적 및 절대적

MT4용 Crypto_Forex 지표 "Inside Bar & PinBar Patterns"는 리페인트나 지연 없이 사용할 수 있습니다. - "Inside Bar & PinBar Patterns" 지표는 가격 변동 거래에 매우 효과적입니다. - 이 지표는 차트에서 Inside Bar 및 PinBar 패턴을 감지합니다. - 상승 패턴 - 차트에 파란색 화살표 신호(그림 참조). - 하락 패턴 - 차트에 빨간색 화살표 신호(그림 참조). - Inside Bar 자체는 높은 R/R 비율(수익률/위험률)을 가지고 있습니다. - PC, 모바일 및 이메일 알림 기능을 제공합니다. - "Inside Bar & PinBar Patterns" 지표는 지지/저항선과 함께 사용하기에 매우 좋습니다. 여기를 클릭하여 고품질 트레이딩 로봇과 지표를 확인하세요! MQL5 웹사이트에서만 제공되는 오리지널 상품입니다.

트렌드 캐처 인디케이터
트렌드 캐처 인디케이터는 개발자가 자체 개발한 맞춤형 적응형 트렌드 분석 지표들을 조합하여 시장 가격 움직임을 분석합니다. 단기적인 노이즈를 제거하고 근본적인 모멘텀 강도, 변동성 확대, 가격 구조 움직임에 집중하여 진정한 시장 방향을 파악합니다. 또한 이동 평균, RSI, 변동성 필터와 같은 맞춤형 지표들을 활용하여 가격을 평활화하고 트렌드를 필터링합니다.
실제 운영 모니터링 및 기타 제품은 다음 링크에서 확인하실 수 있습니다: https://www.mql5.com/en/users/mechanic/seller
텔레그램에서는 EA나 설정 파일을 판매하지 않습니다. 사기이니 주의하세요. 모든 설정 파일은 블로그에서 무료로 제공됩니다. 중요! 구매 후 즉시 연락 주시면 사용 방법 및 보너스를 드립니다!
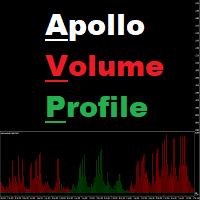
Apollo Volume Profile 은 거래량 분석을 통해 시장 움직임의 방향을 결정하는 지표입니다. 표시기는 사용하기 매우 쉽습니다. 이 지표는 사용된 기간에 따라 시장에서 판매자와 구매자의 비율을 명확하게 보여줍니다. 지표는 모든 거래 시스템의 기초로 사용할 수 있습니다. 지표는 신호를 다시 그리지 않습니다. 이 표시기는 통화, 금속, 지수, 주식, 암호 화폐와 같은 모든 금융 상품을 거래하는 데 사용할 수 있습니다. 이 거래 지표는 주요 거래 시스템 또는 지표의 추세 필터로 사용할 수 있습니다. 귀하의 거래 스타일에 관계없이 이 지표는 귀하에게 매우 유용할 것입니다. 스캘퍼 및 일중 거래, 장기 거래에 적합합니다. 구매 후 반드시 저에게 편지를 보내주세요! 내 거래 추천과 훌륭한 보너스를 여러분과 공유하겠습니다!

소개 Quantum Breakout PRO , 브레이크아웃 존 거래 방식을 변화시키는 획기적인 MQL5 지표! 13년 이상의 거래 경험을 가진 숙련된 트레이더 팀이 개발한 Quantum Breakout PRO는 혁신적이고 역동적인 브레이크아웃 영역 전략으로 거래 여정을 새로운 차원으로 끌어올리도록 설계되었습니다.
Quantum Breakout Indicator는 5개의 이익 목표 영역이 있는 브레이크아웃 영역의 신호 화살표와 브레이크아웃 상자를 기반으로 한 손절 제안을 제공합니다.
초보자 거래자와 전문 거래자 모두에게 적합합니다.
Quantum EA 채널: 여기를 클릭하세요 MT5 버전 : 여기를 클릭하세요 중요한! 구매 후 설치 매뉴얼을 받으려면 개인 메시지를 보내주십시오. 추천:
기간: M15 통화쌍: GBPJPY, EURJPY, USDJPY,NZDUSD, XAUUSD 계정 유형: 스프레드가 매우 낮은 ECN, Raw 또는 Razo

Titan Z-Score Pro Titan Z-Score Pro, MetaTrader 4 için tasarlanmış profesyonel düzeyde bir istatistiksel göstergedir. Bu, mevcut fiyatın tarihsel ortalama değerinden kaç standart sapma uzaklaştığını kesin olarak hesaplar. İstatistiksel varyans kullanarak, gösterge yatırımcıların duygusal önyargıdan ziyade matematiksel olasılıklara dayalı aşırı yayılmış piyasa koşullarını ve yüksek olasılıklı ortalama geri dönüş bölgelerini belirlemesine yardımcı olur. Temel Özellikler: Akıllı V-Reversal Mantığı

only 12 free copies left VOLURIS — Volume Profile 엔진
당신은 이미 트레이딩 방법을 알고 있습니다. 단지 봐야 할 것을 보지 못하고 있을 뿐입니다. 이런 느낌을 이미 겪어본 적이 있을 것입니다.
진입합니다. 가격은 즉시 반대로 움직입니다. 손절이 나갑니다. 그리고 바로 그 직후, 가격은 반전해서 당신이 예상했던 방향으로 정확히 움직입니다. 당신의 판단은 맞았습니다. 단지 너무 빨랐거나, 너무 늦었거나, 둘 다였을 뿐입니다.
다시 차트를 보면 이제 보입니다. 당신의 진입가 바로 위에 Naked POC가 있었습니다. 이전 세션의 Value Area가 가격이 멈춘 바로 그 위치에 있었습니다. VWAP는 저항으로 작용하고 있었지만, 당신의 차트에는 표시조차 되어 있지 않았습니다. 시장의 컨텍스트는 모든 것을 말해주고 있었습니다. 당신에게는 그것을 읽을 도구가 없었을 뿐입니다.
이것은 트레이딩 문제가 아닙니다. 정보 문제입니다.
VOLURIS
FREE

통화 강도 마법사는 성공적인 거래를 위한 올인원 솔루션을 제공하는 매우 강력한 지표입니다. 표시기는 여러 시간 프레임의 모든 통화 데이터를 사용하여 이 또는 해당 외환 쌍의 힘을 계산합니다. 이 데이터는 특정 통화의 힘을 확인하는 데 사용할 수 있는 사용하기 쉬운 통화 지수 및 통화 전력선의 형태로 표시됩니다. 필요한 것은 거래하려는 차트에 표시기를 부착하는 것뿐입니다. 표시기는 거래하는 통화의 실제 강세를 보여줍니다. 지표는 또한 추세와 거래할 때 유리하게 사용할 수 있는 구매 및 판매 거래량 압력의 극한값을 보여줍니다. 지표는 또한 피보나치에 기반한 가능한 대상을 보여줍니다. 표시기는 PUSH 알림을 포함한 모든 유형의 알림을 제공합니다. 구매 후 연락주세요. 나는 당신과 거래 팁을 공유하고 당신에게 무료로 훌륭한 보너스 지표를 줄 것입니다! 나는 당신에게 행복하고 유익한 거래를 기원합니다!

This Indicator only places quality trades when the market is really in your favor with a clear break and retest. Patience is key with this price action strategy!
If you want more alert signals per day, you increase the number next to the parameter called: Support & Resistance Sensitivity. After many months of hard work and dedication, we are extremely proud to present you our Break and Retest price action indicator created from scratch. One of the most complex indicators that we made with over

SMC 올인원: 시장 구조 및 유동성 SMC(Smart Money Concepts) 분석 지표는 Smart Money Concepts 접근 방식을 기반으로 가격 행동 분석을 자동화합니다. 수동으로 레벨을 그리는 대신, 지표가 차트에 내부 및 스윙 시장 구조, 오더 블록(Order Block), 공정 가치 갭(FVG), 유동성 레벨을 실시간으로 라벨링합니다.
기관 참여자들이 주문을 배치하고 있을 가능성이 높은 위치를 파악함으로써, 이 지표는 더 정확한 진입과 청산을 위한 최적의 관심 영역(POI)을 찾는 데 도움을 줍니다.
지표가 처음이신가요? 전체 매개변수 설정에 대해서는 MQL5 블로그의 단계별 [사용자 매뉴얼]을 읽어보세요. 더 깊이 있는 시장 구조 분석을 원하시나요? 브레이커 블록(Breaker Block), 리젝션 블록(Rejection Block), 유동성 풀 및 iFVG와 같은 추가 개념을 다루는 무료 보조 지표인 [SMC Advanced Order Block]을 다
FREE

프리시전 트레이딩 시스템의 로저 메드칼프에 의한 프리시전 인덱스 오실레이터 (Pi-Osc)
버전 2는 차트에 신속하게 로드되도록 주의 깊게 다시 코딩되었으며 경험을 향상시키기 위해 몇 가지 다른 기술적 개선 사항이 통합되었습니다.
Pi-Osc는 정확한 거래 타이밍 신호를 제공하도록 개발되었으며 시장이 모든 사람의 스톱을 청산하기 위해 가야 하는 극도의 고갈 지점을 찾는 데 목적이 있습니다.
이 제품은 극단적인 지점이 어디에 있는지 알고 있는 고전적인 문제를 해결하며 트레이더로서의 삶을 훨씬 간단하게 만듭니다.
이것은 업계 표준 오실레이터와는 상당히 다른 강력한 차이점을 가지고 있는 고도로 복잡한 합의 지표입니다.
사용하는 기능 중 일부는 수요 지수, 자금 흐름, RSI, 스토캐스틱, 패턴 인식, 거래량 분석, 표준 편차 극단점 및 다양한 길이에서 위와 유사한 변형을 갖습니다.
미숙한 눈에는 다른 오실레이터와 비슷해 보일 수 있지만 RSI 또는 모멘텀과 같은 다른 오실레이
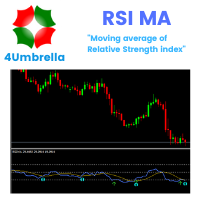
Indicator MT4 : RSI MA is Moving average of strength index
Objective : Find entry price for the good trade
How to set up indicators RSI MA : 1. RSI period 14. 2. MA you can set calculate price and method price. 3. MA period 9. 4. Arrow setting : 6 types. 5. Alert setting : Next bar or Instant bar. 6. Choose display for 1 or 2 calculation by formula.
How to trade for success : Entry point : Buy / Long position 1. When arrow up direction show 2. TP : RSI OVB
Entry point : Sell / Short position

"The Squeeze indicator attempts to identify periods of consolidation in a market. In general the market is either in a period of quiet consolidation or vertical price discovery. By identifying these calm periods, we have a better opportunity of getting into trades with the potential for larger moves. Once a market enters into a "squeeze," we watch the overall market momentum to help forecast the market direction and await a release of market energy." The StdATR Squeeze Channel combines standard

이 인디케이터와 다른 인디케이터도 무료로 받으세요: 인디케이터를 거래 로봇으로 전환하기 (코딩 불필요) 특별 할인 : ALL TOOLS , 개당 $35 , 기간 한정 ! 새로운 도구 될 것이다 $30 위해 첫 주 또는 처음 3개 구매 ! MQL5의 트레이딩 도구 채널: 내 MQL5 채널에 가입하여 최신 업데이트를 받으세요 다중 시간대 & 다중 기호 가이드: 다중 시간대 & 스캐너 사용 설명서 - 12개 언어로 제공 다음에서 MT5 버전을 확인하세요. Volume-Trend Order Block MT5 Multi-Timeframe Scanner 다음에서 MT4 버전을 확인하세요. Volume-Trend Order Block MT4 Multi-Timeframe Scanner 더 많은 제품 보기: 모든 제품 또는 거래 지표, 특별 제안 & 신규 출시 Volume-Trend Order Block Multi-Timeframe Scanner 추세 방향,

MT4용 Crypto_Forex 지표 "WPR SPEED" - 훌륭한 예측 도구, 재도색 불필요 - 이 지표는 물리학 방정식을 기반으로 계산됩니다. WPR SPEED는 WPR 오실레이터 자체의 1차 미분값입니다. - WPR SPEED는 횡보장 및 평탄장 시장에서 스캘핑 진입에 유용합니다. - WPR SPEED 지표는 WPR 자체의 방향 전환 속도를 보여주며, 매우 민감합니다. - 모멘텀 스캘핑 거래 전략에는 WPR SPEED 지표 사용을 권장합니다. 지표의 큰 폭의 고점을 찾고 반대 방향으로 스캘핑 거래를 개시하세요(그림 참조). - 이 지표에는 모바일 및 PC 알림 기능이 내장되어 있습니다. Click here to see high quality Trading Robots and Indicators! 이 제품은 MQL5 웹사이트에서만 제공되는 오리지널 제품입니다.

이 지표는 실제 거래에 완벽한 자동 파동 분석 지표입니다! 사례...
참고: 웨이브 그레이딩에 서양식 이름을 사용하는 데 익숙하지 않습니다. Tang Lun(Tang Zhong Shuo Zen)의 명명 규칙의 영향으로 기본 웨이브를 펜 으로 명명하고 2차 웨이브 밴드를 세그먼트 로 명명했습니다. 동시에, 세그먼트에는 추세 방향이 있습니다. 주요 추세 세그먼트에는 이름이 지정되지만(이 이름 지정 방법은 향후 노트에서 사용됩니다. 먼저 말씀드리겠습니다.) 알고리즘은 굴곡 이론과 거의 관련이 없으므로 그렇게 해서는 안 됩니다. 이는 나의 시장 분석을 통해 요약된 끊임없이 변화하고 복잡한 운영 규칙을 반영합니다.
밴드는 더 이상 사람마다 다르지 않도록 표준화되고 정의되었습니다. 인위적인 간섭의 드로잉 방법은 시장 진입을 엄격하게 분석하는 데 핵심적인 역할을 합니다.
이 지표를 사용하는 것은 거래 인터페이스의 미학을 개선하고 원래의 K-line 거래를

현재 30% 할인! 초보자나 전문 트레이더를 위한 최고의 솔루션! 이 보조지표는 우리가 다수의 독창적 기능과 새로운 공식을 통합한 독특하고 고품질이며 저렴한 거래 도구입니다. 이 업데이트를 통해 이중 시간대를 표시할 수 있습니다. 더 높은 TF를 표시할 수 있을 뿐만 아니라 차트 TF와 더 높은 TF 모두를 표시할 수 있습니다: 중첩 영역 표시. 모든 Supply Demand 트레이더들이 좋아할 것입니다. :)
중요한 정보 공개 Advanced Supply Demand의 잠재력을 극대화하려면 다음을 방문하십시오. https://www.mql5.com/ko/blogs/post/720245 진입 또는 목표의 명확한 트리거 포인트를 정확히 찾아냄으로 해서 거래가 어떻게 개선될지 상상해 보십시오. 새로운 알고리즘을 기반으로 매수자와 매도자 간의 잠재적인 불균형을 훨씬 더 쉽게 분간할 수 있습니다. 왜냐하면 가장 강한 공급영역과 가장 강한 수요 영역과 과거에 어떻게 진행 되었는지를(이전

It predicts the most likely short-term price movement based on advanced mathematical calculations.
Features Estimation of immediate price movement; Calculation of the real market trend; Calculation of the most important support and resistance levels; Algorithms optimized for making complex mathematical calculations with a minimal drain of system resources; Self-adjusting for better performance, so it’s able to work properly at any symbol (no matter how exotic it is) and any timeframe; Compatibl
Everyone who purchases the Scalping signals M1 indicator receives a FREE BONUS — a fully automated Expert Advisor that trades based on the indicator’s signals.
The indicator shows the arrows — the robot can execute the trades for you, following all signals and risk-management rules. Scalping signals M1 – a ready-made trend-following entry system for M1 Scalping signals M1 is an indicator that turns your chart into a clear action map:
a colored trend channel shows the direction of the market, and

Scalper Vault 는 성공적인 스캘핑에 필요한 모든 것을 제공하는 전문 스캘핑 시스템입니다. 이 표시기는 외환 및 바이너리 옵션 거래자가 사용할 수 있는 완전한 거래 시스템입니다. 권장 시간 프레임은 M5입니다. 시스템은 추세 방향으로 정확한 화살표 신호를 제공합니다. 또한 상단 및 하단 신호와 Gann 시장 수준을 제공합니다. 이 시스템은 사용하기가 매우 쉽습니다. 원하는 시장 지역의 화살표만 따라가면 됩니다. 엑시트는 가격이 적정 수준에 도달하거나 시장의 고점 또는 저점 신호가 나타날 때 수행됩니다. 표시기는 PUSH 알림을 포함한 모든 유형의 경고를 제공합니다. 인디케이터 구매 후 연락주세요. 내 개인 거래 권장 사항과 훌륭한 보너스 지표를 무료로 공유합니다! 나는 당신에게 행복하고 유익한 거래를 기원합니다!

SAYON Performance PRO MT4 is a professional statistics dashboard for MetaTrader 4.
One window, everything about your account: 8 key indicators, balance and equity chart, real equity drawdown, profit calendar, hours, weekdays, long vs short, symbols and advanced statistics. Export the full report to Excel with one click. Launch price – the price will increase soon. It is an indicator: it works on any chart, next to any Expert Advisor. It does not trade and does not change anything on your account

Multi Oscillator Divergence MT4 – RSI, CCI, MACD, OBV, Stochastic & AO
Multi Oscillator Divergence MT4 는 하나의 강력한 도구에서 6가지 인기 기술 오실레이터를 사용하여 트레이더가 상승 및 하락 다이버전스를 식별할 수 있도록 설계된 고급 Forex divergence indicator 입니다. 여러 지표를 번갈아 사용할 필요 없이, 이 MT4 Divergence Indicator 는 RSI, CCI, MACD, OBV, Stochastic 및 Awesome Oscillator (AO)를 분석하여 잠재적인 다이버전스와 여러 지표의 확인 신호를 차트에서 직접 명확하게 확인할 수 있도록 제공합니다.
Key Features 1. 하나의 인디케이터에 6개의 오실레이터
하나의 MT4 인디케이터에서 RSI, CCI, MACD, OBV, Stochastic 및 AO 를 사용하여 다이버전스를 탐지합니다.

The Forex Master Pattern is an alternative form of technical analysis that provides a framework which will help you to find and follow the hidden price pattern that reveals the true intentions of financial markets. This algorithm here does a good job detecting the Phase 1 of the Forex Master Pattern cycle, which is the contraction point (or Value).
On Phase 2 we get higher timeframe activation (also called Expansion), which is where price oscillates above and below the average price defined

Neuro Athena is an absolutely new way to get precise entry and exit trading signals. It uses the Fibonacci sequence as the basis for the calculation of its levels. With Neuro Athena you will always know when to open and close your trades with confidence. Message me and get Neuro Athena Assistant as a gift to automize your trading process! Why should you choose Neuro Athena? 1. Reliable Algorithm. Fibonacci sequence is not a new-age marketing slop that feels the Internet nowadays - it is one of
FREE

Please contact us after your purchase and we will send you the complimentary indicators to complete the system Cycle Sniper is not a holy grail but when you use it in a system which is explained in the videos, you will feel the difference. If you are not willing to focus on the charts designed with Cycle Sniper and other free tools we provide, we recommend not buying this indicator. We recommend watching the videos about the indiactor and system before purchasing.
Videos, settings and descri

Market Structure ICT 인디케이터 1. 자동화된 시장 구조 분석 가장 큰 장점은 주관적인 해석으로 인한 오류를 줄여준다는 것입니다. 정확한 추세 식별: 추세 지속을 위한 **BOS (구조 돌파)**와 추세 반전을 위한 **CHoCH (추세 성격 변화)**를 자동으로 식별합니다. 스윙 분류: 단기, 중기, 장기 등 시장 구조 유형을 선택할 수 있어 스캘퍼와 스윙 트레이더 모두에게 적합합니다. 2. 전문 대시보드 다른 타임프레임을 확인하기 위해 화면을 전환할 필요가 없습니다. 한눈에 보는 분석: 대시보드는 모든 타임프레임(M1~W1)의 상태를 한 화면에 표시합니다. 점수 시스템: 하위 타임프레임의 점수를 합산하여 전반적인 편향 (Overall Bias) (예: "강한 상승" 또는 "혼조")을 요약해 줍니다. 추세의 신선도: BOS가 방금 발생한 "신규 돌파(Fresh Break)"인지 오래된 구조인지 알려줍니다. 3. 차트 상의 MTF 표시 (멀티 타임프레임) 정밀한 진

스위트 VWAP Aux로 시간을 절약하고 더 정확한 결정을 내리세요 만약 아직 저희의 메타트레이더 4용 무료 VWAP 지표 를 다운로드하지 않으셨다면 지금 다운로드하시고 놀라운 VWAP 앵커 시각화 능력을 경험해보세요. 그 후에 다시 이곳으로 돌아와서 Sweet VWAP Aux를 만나보세요 - 귀하의 Sweet VWAP 지표에 대한 완벽한 확장 기능입니다. 단 한 번의 클릭으로 Sweet VWAP로 선택한 위치에서 VWAP 지표를 고정할 수 있어 시간을 절약하고 수동으로 구성할 필요성을 제거합니다. 또한 이 지표는 대형 기관이 거래하고 주문을 배치하는 중요한 지점에 대한 가치 있는 정보를 제공하여 더 정확한 결정을 내리고 자신만의 거래 전략을 설정할 수 있도록 도와줍니다. 앵커 지점을 수동으로 구성하는 시간 낭비는 이제 그만하세요. 지금 Sweet VWAP Aux 지표를 구매하여 시장 분석을 새로운 수준으로 끌어올리세요. 이것은 금융 시장에서 성공하려는 모든 진지한 트레이더에게 가치

Crystal Volume Profile Auto POC (MT4) — 자동 POC 볼륨 프로파일 개요
Crystal Volume Profile Auto POC 는 MetaTrader 4용으로 설계된 가볍고 최적화된 인디케이터입니다. 가격대별 거래량 분포를 시각화하며, 가장 많은 거래량이 발생한 가격 수준인 POC(Point of Control)를 자동으로 표시합니다. 이를 통해 숨겨진 지지/저항 구역, 누적/분배 구간 및 기관 투자자의 활동을 쉽게 식별할 수 있습니다. MetaTrader 5 버전도 제공됩니다: Crystal Volume Profile Auto POC (MT5) . 주요 기능 자동 POC 탐지 동적 볼륨 프로파일 (차트 가시 영역 또는 사용자 정의 범위) 고정 프로파일 옵션 (세부 영역 분석) 히스토그램 크기, 색상 및 라인 스타일 완전 사용자 정의 가능 각 캔들마다 실시간 자동 업데이트 Reset VP, Hide VP 버튼 내장 라이트/다크 차트 테마 지원 사용
FREE

This may just look like another indicator for identifying and displaying supply and demand, but dig-in further and you will discover it has much more to offer. In addition to the complete flexibility for displaying zones, consider the identification of recent support or resistance, the back-testing capability to help you learn how to identify the best supply and demand zones to trader from, the continuously updated trend information for all time frames, times from around the world displayed on

다시 색을 칠하지 않고 거래에 진입할 수 있는 정확한 신호를 제공하는 MT4용 지표입니다. 외환, 암호화폐, 금속, 주식, 지수 등 모든 금융 자산에 적용할 수 있습니다. 매우 정확한 추정값을 제공하고 매수와 매도의 가장 좋은 시점을 알려줍니다. 하나의 시그널로 수익을 내는 지표의 예와 함께 비디오 (6:22)시청하십시오! 대부분의 거래자는 Entry Points Pro 지표의 도움으로 첫 거래 주 동안 트레이딩 결과를 개선합니다. 저희의 Telegram Group 을 구독하세요! Entry Points Pro 지표의 좋은점. 재도색이 없는 진입 신호
신호가 나타나고 확인되면(시그널 캔들이 완성된 경우) 신호는 더 이상 사라지지 않습니다. 여타 보조지표의 경우 신호를 표시한 다음 제거되기 때문에 큰 재정적 손실로 이어집니다.
오류 없는 거래 게시
알고리즘을 통해 트레이드(진입 또는 청산)를 할 이상적인 순간을 찾을 수 있으며, 이를 통해 이를 사용하는 모든 거래자의 성공률이
123456789101112131415161718192021222324252627282930313233343536373839404142434445464748495051525354555657585960616263646566676869707172737475767778798081828384858687888990919293949596979899100101102103104105106107108109110111112113114115116117118119120121122123124125126127128129130131132133134135136137138139140141142143144145146147148149150151152153154155156157158159160161162163164165166167168169170171172173174175176
트레이딩 전략과 기술 지표를 판매하기에 가장 좋은 장소가 왜 MetaTrader 마켓인지 알고 계십니까? 광고나 소프트웨어 보호가 필요 없고, 지불 문제도 없습니다. 모든 것이 MetaTrader 마켓에서 제공됩니다.
