MetaTrader 4용 기술 지표 - 6

This indicator was created as an MT4 version inspired by a TMA RSI Divergence indicator found on TradingView.
This indicator detects both Regular and Hidden divergences using RSI pivot points, similar to TradingView's pivot-based divergence logic.
-------------------------------------------------- Features -------------------------------------------------- • Regular Bullish / Bearish divergence • Hidden Bullish / Bearish divergence • Pivot-based detection (Left / Right bars) • Optional RSI SM
FREE

AMD 적응형 이동평균 (AAMA)
AAMA는 MetaTrader 4용 적응형 이동평균 지표로, 시장 상황에 따라 반응 속도를 자동으로 조정합니다. 주요 기능: 카우프만 효율 비율(Kaufman Efficiency Ratio)을 기반으로 한 적응형 이동평균 – 강한 추세에서는 빠르게 반응하고, 횡보장에서는 노이즈를 필터링 AMD의 4가지 시장 단계 자동 감지: 축적기(Accumulation), 상승기(Markup), 분배기(Distribution), 하락기(Markdown) ATR을 통한 변동성 적응 – 현재 시장 조건에 따라 민감도를 자동 조정 실시간 정보 패널: 감지된 시장 단계, 신뢰 수준, 적응 속도 표시 다중 지표 통합 시스템: ADX, RSI, MACD를 활용하여 시장 단계를 정확히 식별 빠름/느림(Fast/Slow) 참조 구역을 통해 적응 행동 시각화 사용법:
이 지표는 시장 상황에 따라 자동으로 적응 속도를 조정합니다. 강한 추세에서는 빠르게, 횡보 구간에서는 느리

Dual Timeframe VWAP Indicator for MT4
Description Professional VWAP indicator that displays both **Daily** and **Weekly** VWAP simultaneously on your chart.
Features: - Dual VWAP Lines: Blue for Daily, Red for Weekly - Configurable Bands: Two deviation bands for each timeframe - Session Control: Customizable trading hours for Daily VWAP - Clean Visuals: Solid lines for main VWAP, dashed for bands - Optimizable: Parameters can be optimized using Genetic Algorithm
Key Settings: - Enable/di
False Breakout MT4 는 가격이 최근의 지지선 또는 저항선을 일시적으로 돌파했다가 빠르게 이전 범위로 되돌아오는 상황을 식별하도록 설계된 지표입니다. 이러한 페이크 브레이크아웃은 임의적 분석이나 역추세 전략에 유용하며, 예측적이거나 자동적인 결정을 내리지 않고도 명확한 시각적 신호를 제공합니다. 주요 기능: 최근 고점/저점 주변의 페이크 브레이크아웃 자동 감지(예: 이틀에 걸쳐 확장된 일간 수준). 실패한 돌파를 강조하는 화살표와 트렌드 세그먼트를 통한 명확한 시각적 표현. 팝업 및 푸시 알림을 통한 사용자 정의 가능한 알림(장치 설정 필요). 사용자가 조정 가능한 매개변수: 스캔할 봉 수, 핍 허용범위, 화살표 위치 오프셋, 색상 등. 빠른 실행과 백테스팅을 위해 최적화된 경량 구현. 예측 알고리즘 없음: 보장된 신호를 제공하지 않으며 기술적 판단을 보조하는 도구로 작동. 호환성: 시간 프레임: M1부터 H4까지. 종목: Forex, 지수, 주식, 원자재. 참고: 이
FREE
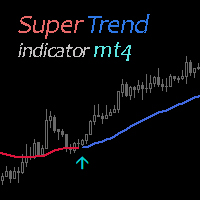
Super Trend Indicator uses two moving averages for calculating the trend direction. Combination with other market signals and analysis is necessary and provides more stable results. Indicator can be easily customized by the user including change of colors, with and arrow sizes.
FREE Super Trend Expert Advisor > https://www.mql5.com/en/market/product/81160?source=Site +Profile+Seller
FREE

Are You Tired Of Getting Hunted By Spikes And Whipsaws?
Don't become a victim of the market's erratic moves.. Do Something About It!
Instantly make smarter decisions with Impulse Pro's precise balance of filters and accurate statistics.
Timing Is Everything In Trading
To learn more, please visit www.mql5.com/en/blogs/post/718212 Anticipate the next big move before it unfolds in 3 Simple Steps!
Advantages You Get
Early impulse detection algorithm.
Flexible combination to different trading s

이동 평균(MA) 지표의 다중 통화 및 다중 시간대 수정. 대시보드에서는 지표의 현재 상태를 확인할 수 있습니다. 즉, Fast MA와 Slow MA의 돌파 및 터치(가격별)는 물론 서로 MA 선의 교차점(이동 평균 교차)도 볼 수 있습니다. 매개변수에서 원하는 통화와 기간을 지정할 수 있습니다. 또한 표시기는 선에 닿는 가격과 선의 교차에 대한 알림을 보낼 수 있습니다. 마침표가 있는 셀을 클릭하면 해당 기호와 마침표가 열립니다. MTF 스캐너입니다. 차트에서 여러 대시보드를 실행할 수 있습니다.
표시기는 현재 차트에 빠른 MA 및 느린 MA 선을 표시합니다. 차트의 MA 기간을 선택하고 다른 기간(MTF MA)의 MA를 볼 수 있습니다. MA의 두 세트에 대한 단축키는 기본적으로 "1"과 "2"입니다.
차트에서 대시보드를 숨기는 키는 기본적으로 "D"입니다.
매개변수 Fast MA Averaging period — 평균화 기간. Shift — 옮기다. Averaging

The indicator displays peak levels of activity formed by the maximum volume, tracks the correlation of the candles on all timeframes (from the highest to the lowest one). Each volume level is a kind of key trading activity. The most important cluster is inside a month, week, day, hour, etc.
Indicator operation features A volume level receives Demand status if the nearest volume level located to the left and above has been broken upwards. A volume level receives Supply status if the nearest volu

Панель предназначена для быстрого визуального нахождения и отображения пин-баров по всем периодам и на любых выбранных валютных парах одновременно. Цвет сигнальных кнопок, указывает на направление пин-бара. По клику на сигнальную кнопку, осуществляется открытие графика с данным паттерном. Отключить не используемые периоды, можно кликом по его заголовку. Имеется поиск в истории (по предыдущим барам). Прокрутка (scrolling) панели, осуществляется клавишами "UP" "DOWN" на клавиатуре. Имеется Push-ув

Contact me after payment to send you the User-Manual PDF File. Harmonic Trading The secret is the Fibonacci. It has been proven in the markets that price always reacts to Fibonacci levels. Fibonacci levels are one of the most important indicators of price changes. Sometimes the sequence of reactions to these levels in the chart make geometric shapes, which are called harmonic patterns. The price creates harmonic patterns with its fluctuation and reaction to Fibonacci levels. Harmonic patterns c

Shadow Zone Detector Shadow Zone Detector is a professional and advanced MT4/MT5 indicator designed to identify and visualize optimal premium and discount zones based on higher timeframe (HTF) candlestick shadows. Inspired by ICT (Inner Circle Trader) techniques, this tool allows traders to quickly spot high-probability areas for entries and exits with a clear, visual representation. Key Features: Premium & Discount Zones: Automatically detects the upper and lower wick zones of previous HTF cand

Title: Price Action Pro - Advanced Multi-Timeframe Reversal Scanner Product Overview: Price Action Pro is not just another candlestick pattern indicator. It is a complete trading system designed to detect high-probability reversal setups. Unlike standard indicators that spam signals on every pattern, Price Action Pro uses a Smart Swing Filter to ensure patterns are only detected at valid swing highs or lows. Combined with Multi-Timeframe (MTF) capabilities and Dynamic ATR Sizing , this tool adap
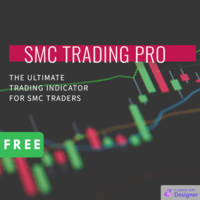
Welcome to the world of SMC (Smart Money Concepts) Trading, where we empower traders with the tools and knowledge to make smarter trading decisions. Our latest addition to our suite of trading tools is the SMC Trading Pro indicator, version 1.0. Key Features: Major Market Structure Identification with BODY break. Order Block must be in Major Swing ( not Small Swing ). Order Block with Fair Value Gap Detection. Order Block in Discount | Premium zone. Filter for only Bullish, Bearish or All Order
FREE
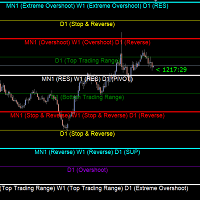
Gold Levels MTF - this is a fine stock technical indicator. The indicator algorithm analyzes the movement of the asset price, displays price levels of support and resistance from all time frames (TF) using the Murray method based on the Gann theory. The indicator indicates overbought and oversold fields, giving an idea of possible reversal points and at the same time giving some idea of the strength of the current trend. Description of levels: (Extreme Overshoot) - these levels are the ultimat
FREE

TrendlyOP – Professional Non-Repaint MT4 Indicator TrendlyOP is a professional-grade MT4 indicator built for traders who refuse repainting, delays, or unreliable signals. It delivers clear, real-time buy and sell signals you can trust—exactly when you need them. 100% Non-Repaint & No Recalculation TrendlyOP never repaints and never recalculates past signals.
Once a signal appears on your chart, it is locked forever.
No tricks. No hindsight. What you see is the real market behavior. True N
가격 행동 거래를 강화하세요. Higher Highs and Lows MT4 지표는 플랙탈 분석을 활용하여 주요 스윙 포인트를 정확히 파악하고, Higher Highs (HH), Lower Highs (LH), Lower Lows (LL), Higher Lows (HL) 같은 트렌드 정의 패턴을 식별하여 시장 방향에 대한 명확한 통찰을 제공합니다. 1900년대 초 다우 이론에 뿌리를 둔 가격 행동의 기본 원칙에 기반하며, 현대 거래에서 Al Brooks의 "Trading Price Action" 시리즈와 같은 전문가에 의해 대중화된 이 지표는 트렌드 지속과 반전을 탐지하는 트레이더에게 필수적입니다. 특히 외환, 주식, 암호화폐 트레이더 사이에서 인기 있으며, 상승 트렌드 (HH/HL) 또는 하락 트렌드 (LL/LH)를 확인하는 능력으로 노이즈를 필터링하고, 풀백 중 입장 타이밍을 정하며, 가짜 브레이크아웃을 피하는 데 도움을 줍니다—변동성 세션에서 정확성을 높이고, 감정적 결정을 줄
FREE

Pips Chaser 표시기는 수동 거래를 보완하기 위해 개발되었습니다. 이 지표는 숏 스캘핑과 롱 스윙 거래 모두에 사용할 수 있습니다 // MT5 버전
특징
다시 칠하기 표시기 없음
이 표시기는 새 데이터가 도착해도 값을 변경하지 않습니다
거래 쌍
모든 통화 쌍
시간대
H1이 바람직하지만 모든 기간에 적용할 수 있습니다.
거래 시간
24시간
Buffers Buy Buffer: 0 / Sell Buffer: 1
요구 사항
일부 포지션 스캘핑을 위해 스프레드가 좁은 ECN 브로커를 사용해야 합니다. 중간 임팩트와 높은 임팩트 뉴스 발표 시간에 거래하지 마십시오.
설치하는 방법
선호하는 거래 쌍에 지표를 부착하십시오(H1 권장).
구성
표시기 설정 : 여기에서 지표의 매개변수를 수정하여 가장 적합한 전략을 채택할 수 있습니다. 추가 세팅 : 여기에서 표시기의 여러 부분의 색상을 변경할 수 있습니다. 경고 구성을 변경할 수도 있습니다.
사용 방법
FREE

It identifies the pivot, support, and resistance price levels of the selected timeframe and then draws lines onto the chart. FEATURES: Option to specify the Timeframe Period in the PivotSR calculation. Option to display the PivotSR of the last candle, of every candle, or of the current candle. Options for displaying labels, line thickness, and line color. PivotSR can be interpreted as reversal levels or past price reactions that can be used as the basis for current price analysis. Some traders b
FREE

After purchase, contact me in private to get 7 days of FREE testing with EA Forex Proton where the robot automatically takes the trade alerts from MBFX Timing! MBFX Timing is an indicator that was developed and created by Mostafa Belkhayate, one of the best traders in the world. We decided to create a modified version that takes inspiration from the Stochastic Oscillator and the Relative Strength Quality Index indicators to improve your trading.
One of the main reasons we released MBFX Timing

"Dragon's Tail" is an integrated trading system, not just an indicator. This system analyzes each candle on a minute-by-minute basis, which is particularly effective in high market volatility conditions. The "Dragon's Tail" system identifies key market moments referred to as "bull and bear battles". Based on these "battles", the system gives trade direction recommendations. In the case of an arrow appearing on the chart, this signals the possibility of opening two trades in the indicated directi

Pan Bands of Asymmetric Volatility
- A Research-Driven Volatility Framework
and Market Regime Switching Signal Author : Heping Pan
Swingtum Prediction Pty Ltd, Australia
panhepingism@gmail.com 28/12/2025
Des cription Move beyond conventional indicators. The Pan Bands of Asymmetric Volatility suite is not merely another technical tool—it is a trading application built upon a peer-reviewed, academically published financial research model [Heping Pan, (2012), "Yin-yang volatility in scale spac
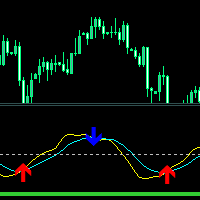
Crossing Line Indicator - 추세 방향으로의 충격적 움직임을 조기에 감지하도록 설계된 지표입니다.
RVI 지표를 기반으로 평활화 및 동작 수정 기능이 있는 오실레이터가 포함되어 있습니다. 두 개의 얇은 선이 교차하면 가격이 변화하는 순간이 발생하며, 그 결과 충격이나 강렬한 움직임이 나타날 수 있습니다.
추세 방향을 결정하는 지표는 가중 MA 지표를 기반으로 합니다. 굵은 밝은 녹색 선은 중앙 수준 아래에 있으면 추세가 하락하고, 위에 있으면 추세가 상승합니다.
사용 및 매개변수 구성이 쉽고, 메인 차트를 로드하지 않습니다.
표시기 기능
신호 화살표는 현재 캔들에 나타나며 다시 그려지지 않습니다. 신호가 발생하면 여러 유형의 알림을 제공합니다. 이는 보편적이며 모든 거래 수단 및 시간 범위에 적용될 수 있습니다. 주로 스캘핑과 단기 거래에 사용할 수 있습니다.
입력 매개변수 설정
이 지표에는 계산을 조절하기 위한 2가지 주요 매개변수가 포함되어 있
FREE
설명
Market Phase Analyzer는 시장의 세 가지 주요 단계인 축적(Accumulation) , 조작(Manipulation) , 분배(Distribution) 를 식별하도록 설계된 고급 지표입니다.
자동 세션 분석을 통해 **아시아 박스(Asia Box)**를 표시하고, 주요 가격 수준 위·아래의 스윕 움직임을 감지하며, ATR 필터 를 사용하여 반전 신호를 확인해 잘못된 신호를 줄입니다. 주요 기능 사용자 정의 가능한 아시아 세션 박스 표시. 강세 또는 약세 스윕 자동 감지. 신호 확인을 위한 선택적 ATR 필터. 일일 시가 라인 표시. 차트 상에 화살표와 텍스트로 시각적 신호 제공. 재초기화 시 객체 자동 삭제. 거래 장점 잠재적인 반전 지점과 추세 단계를 식별하는 데 도움. Smart Money Concepts와 고급 가격 행동(Price Action) 전략 지원. 데이 트레이딩과 스윙 트레이딩에 최적화. 시간, 색상, 가격 수준 완전 사용자 지정 가능. 권장
FREE

스윙 트레이드 컨셉
목적은 무엇인가요?
스윙 트레이딩을 위해 설계된 MT4 지표입니다. 슈퍼트렌드(SuperTrend) 로직을 활용해 추세 반전을 포착하고 자동 피보나치 레벨로 TP(목표가) 지점을 표시합니다.
작동 방식은 어떻게 되나요?
1. 추세 추적
ATR 기반 슈퍼트렌드 알고리즘을 사용합니다. 가격 추세가 깨질 때 신호를 보냅니다.
2. 신호 생성
추세 상승 반전 → 녹색 매수 박스 + 화살표 (캔들 아래)
추세 하락 반전 → 빨간색 매도 박스 + 화살표 (캔들 위)
3. 피보나치 목표가
7개 레벨 자동 표시:
SL: 손절매
Entry: 진입점
TP 1-2-3-4: 목표 이익 실현점
CP: 포지션 청산
모든 레벨은 점선으로 표시되며, 가격은 각 레벨 옆에 표기됩니다.
기능 설명
자동 신호: 매수/매도 박스 및 화살표
피보나치 레벨: TP1-TP4 자동 계산
ATR 기반: 모든 통화쌍(외환, 금, 암호화폐)에서 안정적 작동

Buy Sell Signal Low TF gives buy/sell signals and alerts with up and down arrow at potential reversal of a pullback or a trend continuation pattern in low timeframe. This is an indicator which gives signals based on trend => It works best in trend market with the principle is to ride on the trend not trade against the trend.
The components of Buy Sell Signal Low TF: - The trend is determined by SMMA 13 , SMMA 21 and SMMA 35 ( can be changed manually to suit your preference). - The signal is b
FREE

"추세 식별" 표시기는 매우 정확하고 가장 중요한 것은 짧은 지연으로 진정한 추세 움직임의 시작을 확립할 수 있는 강력한 필터링 방법을 사용합니다. 지표는 거래 스캘퍼 전략과 장기 거래 전략 모두에 사용할 수 있습니다. 지표 평균 알고리즘은 마지막 스크린샷에 나와 있습니다. 표시기 판독값은 명확하고 매우 간단하며 설명이 필요하지 않습니다. 지표의 파란색 선은 상승 추세를 표시하고 금색 선은 플랫, 빨간색 선은 하락 추세를 나타냅니다. 빨간색 또는 금색 선이 파란색으로 바뀌면 바이 로트가 열려야 합니다. 파란색 또는 금색 라인이 빨간색으로 변경되면 매도 포지션이 열립니다. 가격 변경 방향의 가능한 순간은 어떤 상황에서도 다시 그려지지 않는 화살표로 표시됩니다. 표시기는 모든 유형의 알림을 포함합니다. 표시 지침(추세 방향에 대한)이 마지막 두 막대에서 일치할 때 경고가 트리거됩니다. 표시기 설
FREE
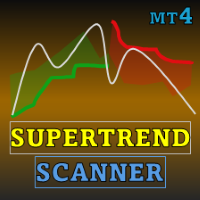
Special offer : ALL TOOLS , just $35 each! New tools will be $30 for the first week or the first 3 purchases ! Trading Tools Channel on MQL5 : Join my MQL5 channel to update the latest news from me SuperTrend by Kivanc Ozbilgic with Scanner 를 소개합니다 – 시장 트렌드를 앞서기 위해 설계된 다기능 강력한 도구로, 사용자 맞춤형 기능과 실시간 알림을 제공합니다. ATR 계산 방법을 RMA (상대 이동 평균)와 SMA (단순 이동 평균) 중에서 선택하여 최대한의 유연성을 제공할 수 있습니다. 기본 설정으로 ATR 기간은 10, 배수는 3으로 설정되어 있으며, SuperTrend 는 매수 및 매도 신호를 효율적으로 감지합니다. 내장된 스캐너와 알림 시스템은 여러 통화 쌍과 시
FREE
설명
SMA Reentry는 메인 추세 내에서 재진입 지점을 식별하도록 설계된 MetaTrader 4용 지표입니다. 단기 움직임을 포착하기 위한 빠른 단순 이동평균선(SMA)과 시장의 전체 방향을 필터링하기 위한 느린 SMA, 총 2개의 이동평균선을 사용합니다. 빠른 SMA가 느린 SMA 위에 있고, 이전 봉에서 빠른 SMA 아래에 있던 가격이 다시 위로 올라설 때 매수 신호가 발생합니다. 빠른 SMA가 느린 SMA 아래에 있고, 이전 봉에서 빠른 SMA 위에 있던 가격이 다시 아래로 내려갈 때 매도 신호가 발생합니다. 작동 방식
화살표는 봉의 변동 폭에 비례한 거리로 차트에 표시되어 시각적 가독성을 높입니다. 신호는 봉이 마감될 때 생성되며, 재계산이나 잘못된 알림을 방지합니다. 알림 기능
팝업, 이메일, 푸시 알림을 통해 신호를 받을 수 있으며, 각 알림 유형은 거래자의 선호에 따라 개별적으로 활성화하거나 비활성화할 수 있습니다. 장점 두 개의 이동평균선을 이용해 역추세 진
FREE

EZT 추세 표시기는 추세, 하락세 및 진입 기회를 보여줍니다. 선택적 필터링과 모든 유형의 경고를 사용할 수 있습니다. 이메일 및 푸시 알림 알림이 추가됩니다. 우리는 또한 이 지표를 기반으로 EA를 개발 중이며 곧 제공될 예정입니다.
두 개의 컬러 히스토그램과 하나의 선으로 구성된 다기능 표시기입니다. 이는 추세 방향과 강도를 시각적으로 표현한 것이며, 선이나 히스토그램에서 여러 번 차이를 발견할 수 있습니다.
표시기는 자동 매개변수 설정과 잘 작동합니다. 이는 주어진 기간에 대해 미리 결정되어 있으므로 해당 설정으로 표시기를 사용하는 것이 좋습니다. 수동 모드에서는 자신만의 매개변수를 설정할 수 있습니다. 이는 다중 시간대(mtf) 표시기입니다.
이 지표는 MTF rsi, MTF cci 또는 MACD pro와 같은 다른 지표의 조합과 잘 작동합니다.
거래되는 상품의 변동성이 클수록 최상의 항목을 찾는 데 사용해야 하는 기간이 더 짧아집니다. 항상 더 높은 기간 방향을

The indicator automatically builds Support/Resistance levels (Zones) from different timeframes on one chart.
Support-resistance levels are horizontal lines. As a rule, the market does not respond to a specific price level, but to a price range around the level, because demand and supply of market participants are not formed clearly on the line, but are “spread out” at a certain distance from the level.
This indicator determines and draws precisely such a price range within which strong positi

Lion Arrow Super Arrow Indicator for MetaTrader 4
The Lion Arrow Super Arrow Indicator for MetaTrader 4 is a hybrid technical analysis system designed to deliver accurate trading signals by combining multiple advanced indicators. By analyzing trend direction, market momentum, and buying/selling pressure simultaneously, this indicator helps traders identify high-probability trade opportunities while minimizing false signals. Core Components of the Indicator
The Lion Arrow Super Arrow indicat
FREE

Free Market structure zig zag to assist in price action trading the screenshots describe how to use and how to spot patterns new version comes with alerts, email alert and push notification alert can be used on all pairs can be used on all timeframes you can add additional confirmation indicators the indicator shows you your higher high and low highs as well as your lower lows and lower highs the indication makes price action analysis easier to spot.
FREE

This is the best Support and Resistance Indicator on the market, and it shows both confirmed Support and Resistance as well as Retests. Support & Resistance: Support marks where buying demand halts price declines, acting as a safety net. Resistance caps price surges, driven by selling pressure. Traders leverage these levels to predict reversals, plan entries, exits, and manage risks, making them trading's fundamental guideposts. Join To Learn Market Depth - https://www.mql5.com/en/channels/suv
FREE

The ADX Dashboard V11.03 is a professional MT4 indicator designed to provide traders with an intuitive visual overview of trend strength and market sentiment across multiple timeframes. It integrates ADX (Average Directional Index) and RSI (Relative Strength Index) indicators, presenting key data in a concise dashboard to help traders make quick and informed trading decisions without complex analysis of individual indicator charts. First, the installation process is straightforward. Copy the co

This indicator watch the Fibonacci retracement for levels and timeframes selected by the trader. In the workload of day trading, having your eyes on all the timeframes to validate some information, for Fibonacci traders, is really time consuming and requires constant focus. With this in mind, this tool allows you to have your attention on other trading details while this one monitors the retracements of each timeframe in real time. In the charts, this indicator data (retracement %, age of the r

FutureForecast is one of the few indicators looking into the future, or rather calculating the current candle's High and Low price values.
Advantages of the indicator no repainting works on any timeframes works with any trading instruments perfectly suitable for scalping and trading binary options
Parameters alert - enable/disable alerts about signals. Enabled by default.
Parameters (Colors) FutureHigh - estimated High price line color. FutureLow - estimated Low price line color.
Recommendat
SR PrevPeriods MT4 개요
SR PrevPeriods는 MetaTrader 4 차트에 전일, 전주, 전월의 고가와 저가를 실시간으로 표시하는 경량형 지표입니다. 이 지표는 과거의 지지와 저항 구역을 강조하며, 이러한 구역은 가격 반응대, 돌파 지점, 밸런싱 존과 자주 일치합니다. 기능
주요 이전 가격 수준에 수평선을 그리며, 필요에 따라 정확한 가격을 표시하는 텍스트 라벨을 추가할 수 있습니다. 모든 수평선은 새로운 틱이 발생할 때마다 자동으로 업데이트되며, 내부 객체 관리 기능으로 차트를 깔끔하게 유지합니다. 왜 유용한가
전일, 전주, 전월의 가격 수준은 많은 재량 및 시스템 트레이더들이 참고하는 핵심 지표입니다. 이러한 레벨을 알면 시장 인식이 높아지고, 추세 되돌림 진입이 향상되며, 돌파 확인에 도움을 줍니다. 이를 통해 과도한 거래를 줄이고 모든 타임프레임에서 객관적인 분석 기반을 제공합니다. 주요 특징
일간, 주간, 월간 레벨 개별 표시 설정 가능
각 레
FREE
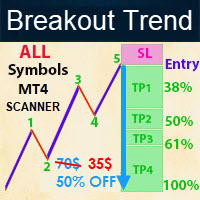
- Real price is 70$ - 50% Discount (It is 35$ now) Contact me for instruction, any questions! - Lifetime update free - Non-repaint - I just sell my products in Elif Kaya Profile, any other websites are stolen old versions, So no any new updates or support. Introduction Breakout Trend Scanner indicator works based on the Elliott Wave in technical analysis describes price movements in the financial market that are related to changes in trader sentiment and psychology and finds end of movement and

Huge 70% Halloween Sale for 24 hours only!
This indicator is unstoppable when combined with our other indicator called Support & Resistance . After purchase, send us a message and you will get it for FREE as a BONUS! Introducing Trend Punch , the revolutionary forex trend indicator that will transform the way you trade! Trend Punch is uniquely designed to provide precise buy and sell arrows during strong market trends, making your trading decisions clearer and more confident. Whether you

이 표시기는 평면 및 추세 위치를 표시하는 데 사용됩니다. 이 디자인은 발진기를 기반으로합니다. 일반 차트 거래 및 바이너리 옵션 모두에 대한 추가 필터로 사용됩니다. 플랫의 장소는 스마트 머니의 개념에 따라 거래를 위해 지표 UPD1 Volume Cluster 에 사용됩니다. 내장 된 경고는 가장 큰 과매 수/과매도의 장소를 알립니다.
입력 매개 변수.
기본 설정. Bars Count - 표시기를 표시할 막대 수 지정. Period - 발진기의 기간을 선택. Start Flat After Bar - 플랫 그리기 시작하는 추세의 종료 후 무시하는 방법 많은 바.
시각적 설정. Color - 자동 또는 수동으로. Floor Color - 색상이"수동으로"설정되어있는 경우,당신은 당신의 자신의 색상을 설정할 수 있습니다. Histo Width (0 - Auto) - 히스토그램의 두께를 선택하거나 자동 모드 설정.
경고 설정. Alert - 알림 설정 활성화/비활성화. Ale
FREE
It is a tool for technical analysis. It allows you to make measurements: Fibo, including the search for clusters Fibo levels (by the DiNapoli method) Overbalance Trend line Selecting S/D levels
Input parameters Trend_Color - color of the trend line Trend_Width - width of the trend line Trend_info - if true, along with the trend line additional information is displayed (low, high, medium of the trend line) Trend_info_color_up_dn - color of the text describing the trend line Trend_info_font_up_dn
Volume Profile Order Blocks - A smarter way to visualize liquidity, volume, and key levels. Volume Profile Order Blocks is a cutting-edge indicator that enhances traditional order block strategies by embedding a detailed volume profile directly within each zone. This provides traders with a clear, data-driven view of where institutional interest may lie — not just in price, but in volume distribution. MT5 Version - https://www.mql5.com/en/market/product/146215/ Join To Learn Market Depth

Ever wondered why standard ADX is made unsigned and what if it would be kept signed? This indicator gives the answer, which allows you to trade more efficient. This indicator calculates ADX values using standard formulae, but excludes operation of taking the module of ADX values, which is forcedly added into ADX for some reason. In other words, the indicator preserves natural signs of ADX values, which makes it more consistent, easy to use, and gives signals earlier than standard ADX. Strictly s

It works based on the Stochastic Indicator algorithm. Very useful for trading with high-low or OverSold/Overbought swing strategies. StochSignal will show a buy arrow if the two lines have crossed in the OverSold area and sell arrows if the two lines have crossed in the Overbought area. You can put the Stochastic Indicator on the chart with the same parameters as this StochSignal Indicator to understand more clearly how it works. This indicator is equipped with the following parameters: Inputs d
FREE

nom Trend Pro — 다중 시간 프레임 트렌드 분석 도구
Venom Trend Pro는 모든 통화쌍과 시간 프레임에서 명확한 방향성 움직임을 식별할 수 있도록 설계된 추세 추종 및 스윙 트레이딩 지표입니다. Forex, 금, 암호화폐, 지수 등 다양한 자산의 데이 및 스윙 트레이딩에 적합합니다.
이 지표는 최근 가격 구조와 모멘텀을 분석하여 새로운 또는 지속적인 추세를 감지합니다. 추세가 확인되면 신호는 고정되며, 캔들이 마감된 후에는 다시 그려지지 않습니다. 주요 특징: 모든 시간 프레임 지원 (M1부터 MN까지) 캔들 마감 후에도 재도색되지 않는 안정적인 신호 다양한 자산에 사용 가능: Forex, 금속, 암호화폐, 지수 등 추세 진입 및 청산 타이밍에 모두 적합 복잡함 없이 깔끔하고 미니멀한 시각적 표시 Venom Trend Pro는 노이즈 없이 시장 방향을 파악할 수 있도록 돕는 구조화된 접근 방식을 제공합니다.
차분하고 규칙 기반의 트레이딩을 추구하는 트레이더에게
FREE

Trend Dot Indicator
– Clean & Powerful Reversal System A fast-reacting Trend Step Regression (TSR) line with color-coded dots instantly shows the current trend. High-probability BUY/SELL signals appear only when a real reversal occurs, confirmed by minimum trend length and ADX strength. Description here: https://www.mql5.com/en/blogs/post/765867 Features: Clear visual TSR line + dots (blue = up, red = down) Filtered reversal signals with text labels Real-time volume pressure dashboard (Buy/S

MACD divergence indicator finds divergences between price chart and MACD indicator and informs you with alerts (popup, mobile notification or email). Its main use is to find trend reversals in the chart. Always use the divergence indicators with other technical assets like support resistance zones, candlestick patterns and price action to have a higher possibility to find trend reversals. Three confirmation type for MACD divergences: MACD line cross zero level Price returns to previous H/L Creat
FREE

이 정보 표시기는 계정의 현재 상황을 항상 알고 싶어하는 사람들에게 유용합니다. 표시기는 포인트, 백분율, 통화 단위의 이익뿐만 아니라 현재 쌍의 스프레드와 현재 기간에서 막대가 마감될 때까지의 시간과 같은 데이터를 표시합니다. 버전 MT5 - 더욱 유용한 지표
차트에 정보선을 배치하는 데는 여러 가지 옵션이 있습니다. 가격 오른쪽(가격보다 뒤에 있음) 코멘트로(차트의 왼쪽 상단에 있음) 화면의 선택된 모서리에 있습니다. 정보 구분 기호를 선택할 수도 있습니다. | / . \ # 표시기에는 다음과 같은 단축키가 내장되어 있습니다. 키 1 - 정보 표시 유형으로 뒤로 이동(가격, 설명 또는 코너 오른쪽) 키 2 - 정보 표시 유형에서 앞으로 나아갑니다. 키 3 - 정보 라인 표시 위치 변경 단축키는 설정에서 다시 할당할 수 있습니다. 이 표시기는 사용하기 쉽고 매우 유익합니다. 설정에서 불필요한 정보 항목을 비활성화할 수 있습니다.
설정 표시된 정보를 교체하기 위한 단축키(뒤로
FREE

RSI / TDI 알림 대시보드를 사용하면 거래하는 모든 주요 쌍에서 RSI를 한 번에(귀하가 선택 가능) 모니터링할 수 있습니다.
두 가지 방법으로 사용할 수 있습니다.
1. 여러 시간 프레임을 선택하면 일반적인 거래 조건을 넘어 확장된 여러 시간 프레임이 있을 때 대시가 표시됩니다. 가격이 여러 기간에 걸쳐 과매수 또는 과매도 수준에 도달하여 최근에 가격이 크게 밀리고 있으므로 곧 철회 또는 반전이 예정되어 있음을 나타내는 훌륭한 지표입니다.
2. 하나의 기간(당신이 가장 선호하는 거래)과 여러 RSI 수준을 사용하여 해당 기간에 RSI 확장의 강도를 보여줍니다. 이것은 가격이 너무 오랫동안 한 방향으로 매우 세게 밀렸고 시장이 차익실현을 해야 할 때 평균 회귀 거래를 취하기 위한 훌륭한 전략입니다. 예시 스크린샷에서 H4 RSI가 25레벨을 넘어 2쌍으로 확장된 것을 볼 수 있습니다. 이는 일반적인 가격 조치보다 훨씬 더 멀리 있기 때문에 매수할 좋은 기회입니다.
대

이것은 무료 제품이므로 필요에 따라 사용하시면 됩니다!
또한 긍정적인 피드백에 감사드립니다! 대단히 감사합니다!
여기를 클릭하여 고품질 트레이딩 로봇과 지표를 확인하세요!
Crypto_Forex 지표: MT4용 Heiken Ashi Candles. 리페인트 없음. - Heiken_Ashi_Candles는 그림에 있는 것처럼 Trend Line MA 지표와 훌륭한 조합을 이룹니다. - 지표 Heiken_Ashi_Candles는 추세를 더 잘 보이게 하는 매우 유용한 보조 지표입니다. - 캔들스틱 차트를 더 읽기 쉽게 만들고 추세를 더 쉽게 분석하는 데 유용합니다. - 대부분의 수익은 시장이 추세를 보일 때 발생하므로 추세를 올바르게 예측하는 것이 필요합니다. - Heikin-Ashi 차트는 각 막대를 계산하는 공식이 다르다는 점을 제외하면 일반 캔들스틱 차트와 비슷하게 구성됩니다. - Heikin-Ashi는 본질적으로 움직임의 평균을 취하기 때문에 더 매끄럽게 보입니다. - 하
FREE

Smart Volume Box is designed to give MetaTrader users a powerful, analytical tool for uncovering the hidden dynamics in the market. This precision-built tool, complete with user-friendly settings, integrates essential volume insights and advanced features like Volume Profile, VWAP (Volume Weighted Average Price), and Point of Control (POC) levels. Unlike typical indicators, Smart Volume Box doesn’t provide specific trade signals but instead offers a clearer perspective on market trends, making

BUY INDICATOR AND GET EA FOR FREE AS A BONUS + SOME OTHER GIFTS! ITALO VOLUME INDICATOR is the best volume indicator ever created, and why is that? The Indicator works on all time-frames and assets, indicator built after 7 years of experience on forex and many other markets. You know many volume indicators around the internet are not complete, does not help, and it's difficult to trade, but the Italo Volume Indicator is different , the Italo Volume Indicator shows the wave volume, when market
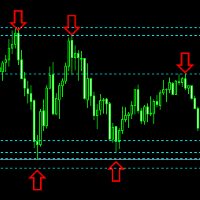
.....................................hi....................... ................for showing high s and low s and support and resistanses .....................we have a lot of ways............................... it can be helpful for finding trends , higher highs , higher lows , lower highs , lower lows
.......................today i write on of thems.......................... ........................you can enter the number of last support and resistanses .........................and it will dra
FREE

System Trend Pro - This is the best trend trading indicator!!! The indicator no repaint!!! The indicator has MTF mode, which adds confidence to trading on the trend ( no repaint ).
How to trade? Everything is very simple, we wait for the first signal (big arrow), then wait for the second signal (small arrow) and enter the market in the direction of the arrow.
(See screens 1 and 2.) Exit on the opposite signal or take 20-30 pips, close half of it, and keep the rest until the opposite

MACD 장중 추세는 1960년대 Gerald Appel이 만든 원본 MACD를 개조하여 개발한 지표입니다.
수년간의 거래를 통해 MACD의 매개변수를 피보나치 비율로 변경함으로써 추세 움직임의 연속성을 더 잘 표현함으로써 가격 추세의 시작과 끝을 보다 효율적으로 감지할 수 있다는 것이 관찰되었습니다.
가격 추세를 감지하는 효율성으로 인해 상단과 하단의 차이를 매우 명확하게 식별하여 거래 기회를 더 잘 활용할 수도 있습니다.
구성 가능한 기능과 경고가 있는 전문가용 버전을 사용해 보십시오: MACD Intraday Trend PRO
특징 모든 통화 쌍에서 작동 모든 시간대에 작동 Renko 차트와 함께 작동 여전히 질문이 있는 경우 다이렉트 메시지로 저에게 연락하십시오. https://www.mql5.com/ko/users/robsjunqueira/
FREE
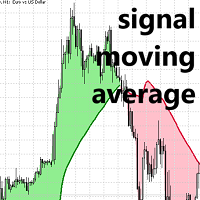
MT5용 신호 이동 평균 Lux 알고리즘
이동 평균 교차 시스템에서 신호선 사용을 위해 특별히 설계된 고유한 이동 평균 지표를 만나보세요. 이 고급 도구는 범위가 좁은 시장에서는 가격에서 벗어나는 반면, 추세가 있는 시장에서는 표준 이동 평균을 면밀히 반영한다는 점에서 차별화됩니다. 이러한 특징은 트레이더가 시장 변동으로 인한 불필요한 노이즈와 잠재적인 과매도를 방지하는 데 도움이 됩니다.
이동 평균은 범위가 좁은 시장에서는 가격에서 벗어나고, 추세가 있는 시장에서는 일반 이동 평균값에 도달합니다.
이동 평균 교차 전략은 일반적인 추세를 파악하는 데 사용되는 느린 이동 평균인 "신호선"에 의존하는 경우가 많습니다. 이 신호선은 빠른 이동 평균과 함께 사용되어 일반 가격과 신호선의 교차에서 발생할 수 있는 휩소 거래를 걸러냅니다.
제안된 지표는 범위가 좁은 기간 동안 가격에서 벗어나지 않으므로 가격과 신호선 사이에 발생하는 교차 횟수를 효과적으로 줄일 수 있습니다.
가격과
FREE

VR Donchian 표시기는 Donchian 채널의 향상된 버전입니다. 개선 사항은 채널의 거의 모든 기능에 영향을 주었지만 주요 운영 알고리즘과 채널 구성은 그대로 유지되었습니다. 현재 추세에 따라 볼 표시기에 레벨 색상 변경이 추가되었습니다. 이는 거래자에게 추세 또는 플랫의 변화를 명확하게 보여줍니다. 스마트폰, 이메일 또는 MetaTrader 터미널 자체를 통해 두 채널 수준 중 하나의 돌파에 대해 거래자에게 알리는 기능이 추가되었습니다. 가격표가 추가되어 거래자가 차트에서 가격 수준을 볼 수 있습니다. 고전적인 Donchian 지표의 작동 알고리즘은 트레이더가 지표가 계산할 기간 수를 직접 설정할 수 있다는 사실로 인해 최적화되고 가속화되었습니다. 고전적인 Donchian 지표는 MetaTrader 터미널에서 사용할 수 있는 전체 내역을 계산하며, 이는 MetaTrader 터미널에 수학적 계산을 많이 로드합니다. VR Donchian 지표는 트레이더가 설정에 설정한 금액만
FREE
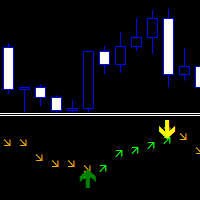
Direction Change Detector - 강세와 약세 움직임의 균형을 구분하는 추세 지표입니다. 방향을 확인하는 신호가 있는 두 줄의 화살표가 있습니다.
추세를 찾기 위한 단독 지표로 활용되거나, 거래를 시작하고 신호 방향을 따르기 위한 추가 도구로 활용될 수 있습니다.
모든 시장과 시간대에 적응 가능합니다. 역사 속에서 자신의 증언을 다시 그리지 않는다. 알림에는 여러 유형이 있습니다. 위쪽을 가리키는 녹색 화살표는 가격이 강세를 보일 것임을 나타냅니다. 아래쪽을 가리키는 주황색 화살표는 하락세 가격 방향을 나타냅니다. 판독값을 변경하기 위한 사용자 정의 매개변수가 1개 있습니다. 방향의 수가 늘어나면 가격은 더 매끄러워지고(낮은 시간 프레임에 사용), 방향의 수가 줄어들면 가격은 더 빨라집니다(높은 시간 프레임에 사용).
Length Directions - 방향의 변화를 계산하기 위한 캔들 수입니다.
FREE
Achieve Trading Precision with Perfect Entry Signal ! Stop guessing and start trading with confidence! The Perfect Entry Signal indicator cuts through the market noise, giving you clear, high-probability entry points. Built on a powerful, non-lagging moving average and filtered by the gold-standard EMA 200, this tool is designed to catch trends early and confirm your trading direction. It's not just a line on your chart—it's your personalized trading edge, delivering immediate, actionable signa
FREE

Smart Reversal Signal is a professional indicator for the MetaTrader 4 platform; it has been developed by a group of professional traders. This indicator is designed for Forex and binary options trading. By purchasing this indicator, you will receive: Excellent indicator signals. Free product support. Regular updates. Various notification options: alert, push, emails. You can use it on any financial instrument (Forex, CFD, options) and timeframe.
Indicator Parameters Perod - indicator calculat

이 프로젝트를 좋아한다면 5 스타 리뷰를 남겨주세요. 이 지표는 열리고, 높은, 낮은 및 마감 가격을 지정합니다.
기간과 그것은 특정한 시간대를 위해 조정될 수 있습니다. 이들은 많은 기관 및 전문가에 의해 보는 중요한 수준입니다
상인은 당신이 더 많은 것일 수있는 장소를 알고 도움이 될 수 있습니다
이름 * 사용 가능한 기간: 이전 날. 이전 주. 지난 달. 이전 분기. 이전 연도. 또는: 현재 날. 현재 주. 현재 달. 현재 분기. 현재 년.
FREE

The indicator finds candlestick patterns based on Gregory L.' Morris "Candlestick Charting Explained: Timeless Techniques for Trading Stocks and Futures". If a pattern is detected, the indicator displays a message at a bar closure. If you trade using the MetaTrader 5 terminal, then you can download the full analogue of the " Candle Pattern Finder for MT5 " indicator It recognizes the following patterns: Bullish/Bearish (possible settings in brackets) : Hammer / Shooting Star (with or without con

FX Dynamic: 맞춤형 ATR 분석으로 변동성과 트렌드를 파악하세요 개요
FX Dynamic 는 Average True Range(ATR) 계산을 활용하여 트레이더에게 일간 및 일중 변동성에 대한 뛰어난 인사이트를 제공하는 강력한 도구입니다. 80%, 100%, 130%와 같은 명확한 변동성 임계값을 설정함으로써 시장이 평소 범위를 초과할 때 빠르게 경고를 받고, 유망한 수익 기회를 재빨리 식별할 수 있습니다. FX Dynamic 는 브로커의 시간대를 인식하거나 수동으로 조정할 수 있으며, 변동성 측정 기준을 일관되게 유지하며, MetaTrader 플랫폼과 완벽하게 연동되어 실시간 분석을 지원합니다.
1. FX Dynamic이 트레이더에게 매우 유용한 이유 실시간 ATR 인사이트
• 하루 및 일중 변동성을 한눈에 모니터링하세요. ATR의 80%, 100%, 130% 임계값이 도달 또는 초과되면, 시장의 중요한 지점에 있음을 알 수 있습니다.
• 변동성이 완전히 폭발하기

기본 공급 수요 지표는 시장 분석을 향상시키고 모든 차트에서 주요 기회 영역을 식별하는 데 도움이 되도록 설계된 강력한 도구입니다. 직관적이고 사용하기 쉬운 인터페이스를 갖춘 이 무료 메타트레이더 지표는 공급 및 수요 영역을 명확하게 볼 수 있어 보다 정보에 입각한 정확한 거래 결정을 내릴 수 있습니다 / 무료 MT5 버전 이 지표에 대한 대시보드 스캐너: ( Basic Supply Demand Dashboard )
특징
지표는 차트에서 공급 및 수요 영역을 자동으로 스캔하여 지루한 수동 분석이 필요하지 않습니다. 가장 가까운 공급 및 수요 구역까지의 남은 거리 그래픽 표시 공급 구역은 하나의 고유 한 색상으로 강조 표시되고 수요 구역은 다른 색상으로 표시되어 빠르고 정확한 해석이 용이합니다. 인디케이터는 가장 가까운 공급 또는 수요 구간과 차트상의 현재 가격 사이의 핍 단위 거리를 자동으로 계산하여 명확하고 정량화할 수 있는 기준을 제공합니다. 핍 단위의 거리가 차트에 명확하고
FREE

Was: $99 Now: $49
Blahtech Daily Range indicator displays the average daily range alongside the individual session ranges. Using the daily open price as a reference the indicator shows fixed range and dynamic range targets as lines on the charts. These lines clearly show when the average range has been exhausted. Daily and session ranges can be useful for confirming entries or setting targets and is an excellent odds enhancer for many trading systems. Links [ Documentation | Install
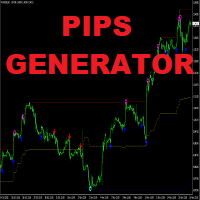
Apollo Pips Generator 는 추세의 방향으로 신호를 제공하는 지표입니다. 표시기는 여러 진입점을 제공하므로 항상 이익을 얻을 수 있는 거래 기회를 찾을 수 있습니다. 스크린샷에 주의하세요. 스크린샷은 상단과 하단을 나타내는 별 신호가 있는 채널로 표시되는 다른 도구와 함께 Pips Generator 도구를 보여줍니다. 이 조합은 시스템을 적용할 수 있는 여러 방법을 제공합니다. 구매 후 두 번째 표시기를 무료로 받으려면 저에게 연락하십시오. 스크린샷에 나와 있는 것과 완전히 동일한 시스템을 갖게 될 것입니다. 또한 최상의 결과를 얻기 위해 이 시스템을 사용하는 방법에 대한 지침도 제공합니다. 두 도구 모두 PUSH 알림을 포함한 모든 유형의 경고를 제공합니다. 나는 당신에게 행복한 거래를 기원합니다!

차트 투영 표시기 차트 프로젝션은 내장된 지그재그 기술 지표를 사용하여 미래 가격 조치를 예측하는 작은 지표로 시작되었습니다(코멘트에서 이전 알고리즘을 찾을 수 있음)
아이디어는 간단합니다. 과거 가격 조치가 미래로 이어지지는 않지만 지나치게 구체적이지 않거나 지나치게 일반적이지 않은 경우 발생할 수 있는 일에 대한 지침을 추출할 수 있습니다.
차트 투영의 "테제"는 다음과 같습니다.
거래자는 차트를 보고 결정을 내리므로 알고리즘도 차트를 볼 수 있습니다. 지표 값을 읽지 않고 가격을 읽지 않고 차트를 봅니다. 무언가를 찾는 것은 반복되는 친숙한 패턴을 찾는 것입니다. 그리고 , 그 익숙한 패턴을 찾으려면 저장해야 합니다.
지그재그로는 충분하지 않았고 이를 수행하고 차트의 시각적 측면에 대한 데이터도 유지하는 새로운 알고리즘이 필요했기 때문에 광학 알고리즘이 필요했습니다.
차트 프로젝션에는 쌍 가격 조치의 저, 중, 고 범위 스캐닝을 위한 3가지 광학 알고리즘이 장착되어
FREE
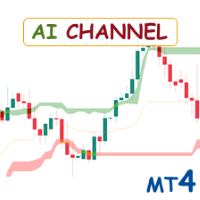
Special offer : ALL TOOLS , just $35 each! New tools will be $30 for the first week or the first 3 purchases ! Trading Tools Channel on MQL5 : Join my MQL5 channel to update the latest news from me AI Channels 지표는 클러스터링 분석의 강력한 머신 러닝 기술인 롤링 K-평균 클러스터링 을 활용하여 실시간으로 기초 가격 트렌드에 대한 통찰을 제공합니다. 이 지표는 클러스터링된 가격 데이터를 기반으로 적응형 채널을 생성하여, 트레이더가 트렌드 방향과 시장 상황에 대한 정보를 바탕으로 결정을 내릴 수 있도록 합니다. 지표 설정에는 트레일링 스탑 옵션 도 포함되어 있어 리스크 관리에 추가적인 유연성을 제공합니다. MT5 버전 보기: AI Channels MT5 다른 제품 보기: 모든 제품
FREE

Contact me after payment to send you the User-Manual PDF File. How To Test
You can test the indicator by free version, to get the free version please contact me ( the free version scans charts in W1 and MN1 time-frames ) it's free.
123 Pattern Breakout
Trend is your friend, trade along the trend, but how do we identify trends? Sometimes the simplest methods have the best results. Pattern 123 is based on the breakout important price levels, when the price is trying to break the previous h
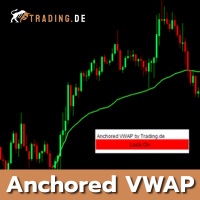
With the Anchored VWAP for MT4 from Trading.de, you can easily calculate and display the volume-based average price starting from a specific point in the chart (anchor). The indicator is ideal for our Trading.de 1-minute chart strategy, but can also be used in all other timeframes. The AVWAP for MetaTrader 4 is calculated using volume or an average period. In the settings, you can specify whether or not to use real trading volume. The indicator also has a "Lock" button in the upper right corner
MetaTrader 마켓은 거래 로봇과 기술 지표들의 독특한 스토어입니다.
MQL5.community 사용자 메모를 읽어보셔서 트레이더들에게 제공하는 고유한 서비스(거래 시그널 복사, 프리랜서가 개발한 맞춤형 애플리케이션, 결제 시스템 및 MQL5 클라우드 네트워크를 통한 자동 결제)에 대해 자세히 알아보십시오.
트레이딩 기회를 놓치고 있어요:
- 무료 트레이딩 앱
- 복사용 8,000 이상의 시그널
- 금융 시장 개척을 위한 경제 뉴스
등록
로그인
계정이 없으시면, 가입하십시오
MQL5.com 웹사이트에 로그인을 하기 위해 쿠키를 허용하십시오.
브라우저에서 필요한 설정을 활성화하시지 않으면, 로그인할 수 없습니다.