MetaTrader 4용 기술 지표 - 16
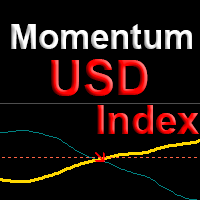
The indicator shows points for the continuation of the trend for currency pairs with the participation of the USD dollar with a probability of more than 80%. The algorithm is based on comparing the momentum of the current currency pair with the momentum of the DX dollar index at the current time. Using the dollar index allows us to evaluate not only the current pair, but the entire picture for all major currencies at once. This approach increases the reliability and reduces the number of false p
The indicator can be used with any time frame and forex pair. One easy to use parameter in the indicator will allow you to adapt the signals to any forex pair and time frame you want to trade.
The Arrows DO NOT REPAINT !
Information Panel: We've equipped this indicator with a user-friendly Panel. one side of the panel, the time frame is displayed, while on the other side, the currency pair is shown. Below that, the direction of the trend is identified, showing whether it is an uptrend or a d

False Breakout Stochastic to be used with our Elliott Wave Indicator as part of the overall strategy on trading the 5th wave.
As we cannot upload multiple files, we have listed this separately. False Breakout Stochastic is best used as a confirmation tool rather than the sole signal indicator The Elliott Wave Indicator Suite is designed around a simple but effective Swing Trading Strategy. The Indicator Suite is great for Stocks, Futures and Forex trading on multiple timeframes You can find the
FREE
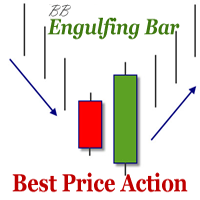
The indicator defines the Bullish and Bearish Engulfing Bar. The pattern has greater reliability when the open price of the engulfing candle is well above the close of the first candle, and when the close of the engulfing candle is well below the open of the first candle. For an engulfing bar to be valid it must fully engulf at least one previous bar or candle - includes all the body and the wick. The engulfing bar can engulf more than one bar as long as it completely engulfs the previous bar.
FREE
Optimize your trading strategy of your custom indicators with the "Indicator Combiner Into One Indicator". This advanced tool combines multiple indicators, including your custom indicators, into a single, user-friendly interface. It generates an arrow signal based on your custom indicators, simplifying your decision-making process. Ideal for traders of all levels, this indicator offers:
Arrow Signals : Get a clear, single arrow signal that combines insights from your custom indicators, mak
FREE
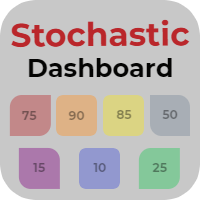
Stochastic Dashboard is an information panel which allows you to have a global market vision through a stochastic indicator. Stochastic Dashboard analyzes and tracks all the assets you want to invest in. Take advantage of this useful dashboard where you can open in a few seconds the chart and quickly invest in it.
Main features of Stochastic Dashboard Graphical panel that allows you to know the situation of many assets. 7 different stochastic situations to discover when an asset is overbought o
Range Cycle Indicator. Gives signal on price range cycling smoothed by moving average. It is better to use it on H1+ timeframes and avoid side markets. Because if market is flat this indicator will give too many zero profit or even losing signals. Parameters: PopUpAlert - to allow it to alert when trend changes; EMailAlert - for email alerts; period - this is a smoothing criteria, use higher values on lower timeframes; TimeFrame(new) - higher timeframe (or the same) to use for calculation, defa
FREE

After purchasing the Tpx Dash Supply Demand indicator, you must download this indicator which will link and feed market data to the Tpx Dash Supply Demand indicator and will provide all Supply Demand price signals, ATR Stop, VAH and VAL, trend values with the ADX, and POC prices and locations in the market. Just download it and Dash will locate the indicator to retrieve the information!
FREE
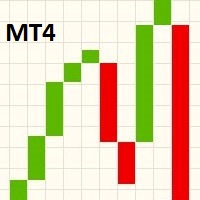
This indicator displays a Line Break chart in the main chart window. To view the line break chart on its own, change the main chart window to display a Line Chart and then change the "Line chart" color to "None" in the F8 properties dialog. When scrolling, zooming in/out or changing the chart pair/timeframe, the indicator will resize the blocks on the next tick to fit the main chart viewing area. Line Break charts were invented in Japan and are similar to Point & Figure and Renko charts. A Japan
FREE

This indicator is based on Guppy's GMMA Strategy. And shows arrows when GMMA lines cross up or down. To have this indicator and get alerts for Multiple Timeframes and multiple Pairs you can check out the demo of this GMMA Trend Scanner indicator: https://www.mql5.com/en/market/product/38747
About GMMA In Brief:
GMMA attempts to identify trends by combining two groups of moving averages with differing time periods: The long-term EMAs (30, 35, 40, 45, 50, and 60) the behaviors of investors that h
FREE

Профессиональный индикатор "Choch Pattern Levels" с RSI-фильтром для MT4 Описание: Вы устали от ложных пробоев и хотите находить точки разворота тренда с высокой точностью? Индикатор Choch Pattern Levels — это ваш профессиональный инструмент для определения смены характера рынка (Change of Character), дополненный мощным фильтром RSI и анализом объемов , чтобы вы входили в рынок только по самым надежным сигналам. Этот индикатор автоматически находит и отрисовывает на графике ключевые паттерны раз
FREE

FOTSI is an indicator that analyzes the relative strength of currencies in major Forex pairs. It aims to anticipate corrections in currency pairs following strong trends by identifying potential entry signals through overbought and oversold target areas. Theoretical Logic of Construction: Calculation of Individual Currency Momentum: FOTSI starts by calculating the momentum for each currency pair that includes a specific currency, then aggregates by the currency of interest (EUR, USD, GBP, CHF,

Is This tools use able for free in Forex market ?
Accuracy Meter is useful and also free product, i made this product for free because i believe that any seller must have some good products for free not just release bad products as free tools.
What does Green koala logo mean :
Means Free Products , i ll release my free products by green koala logo, so when you see green koala, it means new free products is access able for you.
Accuracy Meter Introduction :
Accuracy Meter is powerful tool to
FREE

WaPreviousCandleLevels MT4 shows the previous candle levels, it shows the previous candle Open High Low Close levels (OHLC Levels) in different time frame. It's designed to help the trader to analyse the market and pay attention to the previous candle levels in different time frame. We all know that the OHLC Levels in Monthly, Weekly and Daily are really strong and must of the time, the price strongly reacts at those levels. In the technical analysis, the user can use them as a support and res
FREE

Behaving in a similar fashion as the price action of a chart, the indicator uses " Trix " to opportune itself to the exposure of divergency, flat/low market volume, and price action expansion . The TRIX indicator nicknamed after the Triple-Exponential-average, is a momentum-based oscillator that filters minor price changes and fluctuations that are considered insignificant for forex trading whilst providing money making opportunities! Overall, TRIX is a leading indicator that shows diverge
FREE
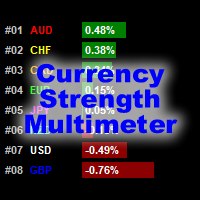
VIEW THE CURRENCY STRENGTH AND PAIR STRENGTH FOR "X" BARS IN A GIVEN TIMEFRAME. The Currency Strength Multimeter indicator shows the strength, direction and rank of each of the following currencies: AUD CAD CHF EUR GBP JPY NZD USD Furthermore, it also shows the strength, direction and rank of each of the following currency pairs: AUDCAD AUDCHF AUDJPY AUDNZD AUDUSD CADCHF CADJPY CHFJPY EURAUD EURCAD EURCHF EURGBP EURJPY EURNZD EURUSD GBPAUD GBPCAD GBPCHF GBPJPY GBPNZD GBPUSD NZDCAD NZDCHF NZDJPY
FREE

중요 공지 – 라이선스 및 활성화 필요
활성화 지침:
구매를 완료한 후 즉시 저희에게 연락하여 라이선스 키, 비밀번호 또는 활성화 세부 정보를 받으십시오. 이들이 없으면 소프트웨어가 작동하지 않습니다. 저희는 원활한 활성화 과정을 보장하고 질문에 대해 도움을 드리기 위해 여기 있습니다.
다국어 사용자 지정
거래 경험을 향상시키기 위해 소프트웨어를 여러 언어로 완벽하게 사용자 지정할 수 있습니다. 저희 팀은 다음 언어로 번역을 제공할 수 있습니다:
중국어 | 프랑스어 | 포르투갈어 | 스페인어 | 러시아어
일본어 | 독일어 | 한국어 | 이탈리아어 | 터키어
선호하는 언어를 알려주시면, 사용자 친화적인 경험을 보장하기 위해 인디케이터를 맞춤 설정하겠습니다.
볼륨 프로필 – 고급 시장 분석 도구
볼륨 프로필은 거래자들에게 시장 역학에 대한 깊은 통찰을 제공하도록 설계된 정교한 분석 도구입니다. 시간이 지남
Special offer : ALL TOOLS , just $35 each! New tools will be $30 for the first week or the first 3 purchases ! Trading Tools Channel on MQL5 : Join my MQL5 channel to update the latest news from me 시장 변화에 원활하게 적응하도록 설계된 첨단 지표 Machine Learning Adaptive SuperTrend 로 고급 머신러닝의 강력한 기능을 활용해 보세요. k-평균 군집화를 SuperTrend 방법론과 결합하여, 이 지표는 정확한 트렌드 식별과 변동성 평가를 가능하게 하며, 역동적인 시장에서 트레이더에게 소중한 이점을 제공합니다. MT5 버전 더 보기: Machine Learning Adaptive SuperTrend MT5 다른 제품 보기: 모든 제품 머신러닝과 적응형 SuperTrend의 정밀
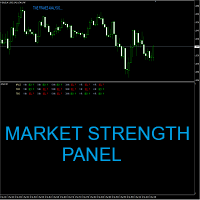
Apollo Market Strength Panel은 외환 및 바이너리 옵션 거래자에게 도움이 될 수 있는 다중 기간 지표입니다. 패널은 M1에서 H4까지 여러 시간 프레임의 시장 상황을 나타냅니다. 이 지표는 세 가지 중요한 시장 측면에 대한 정보를 제공합니다. 트렌드, 포스, 임펄스입니다. 이 3가지 구성 요소가 모두 일치하면 표시기는 시장 방향에 따라 매수 또는 매도 신호를 제공합니다. 표시기는 차트에 바로 신호를 표시합니다. 신호를 생성해야 하는 시간 프레임을 선택할 수 있습니다. 또한 모든 시간 프레임이 정렬되면 신호를 제공할 수도 있습니다. 표시기는 시장 분석을 수행합니다. 신호를 적용할 준비가 되었습니다. 패널은 독립형 시스템 또는 기존 거래 시스템의 일부로 사용할 수 있습니다. 구매 후 저에게 연락하여 개인적인 거래 조언과 훌륭한 보너스 지표를 얻으십시오!

Buy Sell Magic AI – Dynamic Trend Line & Bollinger Bands for MT4 Buy Sell Magic AI is a professional indicator for MetaTrader 4 that combines the power of Bollinger Bands with a dynamic central midline that acts as a real-time trend line . It delivers clear entry signals, visual trend confirmation, and automatic Stop Loss placement—plus a built-in candle timer for precise trade timing. My indicators for free. I only ask that leave your feedback to help me improve them or as a thank you. Have
FREE

Round Numbers Levels indicator for MT4 Round Numbers indicator is a simple but useful indicator to draw 00 and 50 price levels in your chart.
These levels act as supports and resistances, and therefore should be taken into account when trading.
These levels can be used as profit targets or entry points.
Inputs of the indicator are:
TGridColor00: color to be used for xx00 levels GridStyle00: line style to be used for xx00 levels GridWidth00: line width to be used for xx00 levels GridColor50:
FREE

Multicurrency and multitimeframe modification of the indicator Bollinger Bands. On the dashboard you can see breakouts and touches of the Bollinger Bands. In the parameters you can specify any desired currencies and timeframes. The indicator can also send notifications when the price touches the Bollinger Bands, when the current volatility changes (expands or falls), and when the price touches all the bands. By clicking on a cell with a period, this symbol and period will be opened. This is MTF

레벨 인디케이터는 전일 데이터를 기준으로 합니다. 수학 공식에 따라 진입 및 청산 레벨이 결정됩니다.
트레이딩 추천. 레벨은 변동성이 나타날 때 유럽 세션이 시작될 때 거래됩니다. 변동성이 충분하지 않은 경우 테이크프로핏의 절반을 사용하여 종료합니다. 가격이 절반 테이크프로핏에서 반전했다면 반전 시 목표가도 절반 테이크프로핏 수준에서 설정합니다. 가격이 진입 가격에서 반등했다면 반대 방향으로 가격이 두 번째 테이크프로핏에 도달할 수 있습니다.
항상 브레이크 아웃에 진입해서는 안됩니다. 재테스트(레벨 돌파 후 반대쪽에서 테스트)를 기다리는 것이 좋습니다. 재테스트는 시장에 최소 거래량 레벨이 여러 개 있는 경우 잘 작동합니다. UPD1 프로필 레벨 표시기를 참조하세요.
입력 매개변수.
Start Hour - 몇 시부터 하루의 시작을 계산합니다. 00 - 기본값.
Visual Button - 버튼 표시(활성화/비활성화). Corner - 버튼 앵커 각도. X indent -
FREE

Bitcoin Predictor는 가격 반전을 예측하도록 설계된 화살표 기반 지표입니다. 이 도구는 BTC 및 기타 암호화폐와 함께 사용할 수 있습니다. 화폐로도 사용할 수 있습니다. 그러나 먼저 어떤 쌍이 가장 잘 작동하는지 확인해야 합니다. 일부 쌍과 시간 프레임은 정말 훌륭하게 작동할 수 있습니다. 직접 테스트하고 볼 수 있습니다. 표시기는 사용하기가 매우 쉽습니다. 화살표를 따라가기만 하면 됩니다. 표시기는 독립 실행형 시스템으로 작동하거나 이미 사용 중인 시스템의 일부일 수 있습니다. 표시기는 모든 암호화 통화와 함께 쉽게 사용할 수 있습니다. 또한 사용 중인 시간 프레임 및 쌍에 신호를 적용할 수 있습니다. 표시기에서 사용 가능한 하나의 입력 매개변수만 조정하면 됩니다. 정말 쉬워요. 신호를 다시 칠하지 마십시오! 구매 후 연락주세요! 내 거래 권장 사항 및 보너스를 공유하겠습니다!

For some trader's charts analysis use, specially for multi timeframe trading strategies . When you need to check something of the time within different timeframe at the same symbol chart, even different symbol charts, this indicator will show the crosshair at sync moving. You just need to load this indicator into some charts, then the crosshair will shown automatic.
FREE

자기 가격 탐색기 지표는 가격이 되돌아가려는 경향이 있는 평균 가격입니다. XAUUSD H1에 최적화되었습니다. 3개의 선이 있으며, 중앙선은 가격이 목표로 삼아야 할 지점입니다. 역사적 데이터에 따르면, 기본 설정으로 평균 가격으로 되돌아가는 성공률은 92% 이상이었습니다. 그 외의 경우에는 기본 설정된 손절매가 발동했습니다. 진입 지점과 진입 시간은 대략 하루의 시작 부분이며, 편의를 위해 새 날의 첫 번째 캔들은 자기 선보다 아래에서 시작했는지 위에서 시작했는지에 따라 화살표로 표시됩니다. 이 지표는 평균 회귀에 중점을 둔 일중 단일 진입 거래 전략뿐만 아니라 그리드 전략에도 적합합니다. 사용 가능한 설정: Candles: 세부 조정을 위한 캔들 수. 12-24-48 값을 사용하거나 기본값으로 두는 것을 권장합니다. ATR 설정: 전략에 맞춰 손절매를 세부 조정하는 데 필요합니다. ShowLabels: 선 오른쪽에 마커 텍스트를 표시합니다. LabelOffsetBars: 텍스트
FREE

GAP DETECTOR
FVG in trading refers to "Fair Value Gap", . It is a concept used in technical analysis to identify areas on a price chart where there is a discrepancy or gap between supply and demand. These gaps can occur due to rapid movements in price, usually as a result of important news or economic events, and are usually filled later as the market stabilizes. The GAP DETECTOR indicator is designed to identify fair value gaps (FVG) on the price chart and filter them using volatility to dete
FREE

Relative Volume or RVOL is an indicator that averages the volume of X amount of days, making it easy to compare sessions volumes.
The histogram only has 3 colors:
Green - Above average volume
Yellow - Average volume
Red - Below average volume
The default setting is 20 days, which corresponds more or less to a month of trading.
With the data obtained from this indicator you can better gauge the commitment behind a move. For example, you will be better equipped to judge if a breakout of a r
FREE

Mouse Calculation은 마우스로 가리킨 가격에서 청산한다고 가정했을 때, 각 주문의 손익을 빠르게 계산해 줍니다. 그리드, 마틴, 분할 진입 등 다수 주문 운용 시 빠른 의사결정에 적합합니다. 손익분기 가격과 목표 가격을 한눈에 확인할 수 있습니다. 핵심 기능 Mouse PnL (M) : 주문별/총 손익 미리보기(스왑 swap 포함). Break even Price (B) : 전체 포지션의 손익분기 가격/라인 표시. Time_Sync_Lines (T) : 최근 N일의 동일한 시각을 맞춰 비교; 드래그로 핵심 구간 복기. Panel (P) : 패널 표시/숨김. About (A) : 사용 안내 및 정보. 차트 표시 안내 B / S : 주문의 현재 손익 M : 마우스 가격 기준 “해당 가격 청산 시 손익” 추정 T : 총 손익 추천 사용 시나리오 그리드 : 바스켓 익절 구간을 빠르게 결정. 마틴 : 손익분기/플러스 전환에 필요한 반등 범위를 빠르게 확인. 다수 주문 : 부분 청
FREE

이 인디케이터는 임펄스 캔들을 검색하여 차트에 표시합니다. 섀도우 필터가 포함되어 있습니다. 또한 볼린저 밴드의 브레이크 아웃 레벨을 찾습니다. 설정에서 다중 통화 대시보드를 활성화할 수 있습니다. 알림은 현재 차트 또는 전체 목록 중에서 선택할 수 있습니다. Blog-Link - Retest and Fake Breakout with UPD1
거래 패턴: 추세 재테스트. 거짓 브레이크아웃. 기타.
EURUSD, GBPUSD, XAUUSD, ... M15, M30, H1.
입력 매개 변수.
기본. Bars Count - 인디케이터가 작동할 히스토리 막대의 수입니다. Coeff Period – 계산을 위한 기간입니다. Min HL Coeff – 캔들이 검색되는 계수입니다. 기본값은 2.0이지만 더 높은 주기에 더 많은 신호를 찾으려면 1.5로 설정할 수 있습니다. Shadow Filter – 값이 높을수록 캔들 스틱에 그림자의 크기가 커집니다. 50 이하로 설정하는 것이 바람

SMC 세션 지표는 ICT 개념, 유동성 사냥 및 세션 기반 전략 에 의존하는 스마트 머니 트레이더를 위해 제작된 정밀 도구입니다.기관 수준 트레이더가 사용하는 가장 입증되고 인기 있는 개념을 사용하여 중요한 세션 기반 거래 구역을 원활하게 매핑합니다.이 올인원 세션 지표는 다음을 포함하여 가장 효과적이고 확률이 높은 범위 전략으로 차트를 오버레이합니다.ICT 아시아 범위, 런던 브레이크아웃, 뉴욕 범위, ICT 런던 오픈 킬존, ICT 뉴욕 오픈 킬존, 오프닝 범위 브레이크아웃(ORB) ( 런던, 뉴욕, 도쿄 포함) 및 강력한 자정 오프닝 범위 .또한 시드니, 도쿄, 런던 및 뉴욕 을 포함한 주요 외환 거래 세션을 강조 표시합니다.각 범위는 TimeBox 방법론을 사용하여 최대 정확도로 그려져 주요 FVG(공정 가치 갭), 범위 스윕, 세션 최고/최저 및 잠재적인 마켓 메이커 조작 구역을 식별하는

이 지표는 프랙탈의 가격 구조를 분석하고 시장 역학의 가능한 반전 지점을 식별합니다. 다른 유형의 지표와 함께 사용할 때 완벽합니다.
장점:
모든 악기와 시계열에서 작동합니다. 결과를 다시 그리지 않습니다. 표시기 요소의 사용자 정의 색상, 어떤 트렌드 전략과도 잘 어울립니다. 도형의 강도를 조정합니다.
MT5 version -> HERE / Our news -> HERE
Strategy: AW Flexible Fractals is an indicator that indicates signals not instantly, but with a delay, due to the structure of the fractal.
To detect a signal in the " Number of candles on each side of the fractal " variable, you can adjust the number of bars on each side
FREE

Multicurrency and multi-timeframe indicator Inside Bar (IB). In the parameters, you can specify any desired currencies and timeframes. The panel displays the last found Inside Bar (and Mother Bar) pattern, the current price position and the breakout of the levels of the Mother and Inside Bars. You can set the size and color for bars and text in the cells. The indicator can also send notifications when levels are broken. The dashboard highlights Double Inside Bar in a special color. By clicking

Lord Auto Fibonnaci is a free indicator for Meta Trader, in order to show the most famous chart in the financial market known as "Fibonnaci".
As we can see in the images below, the fibonnaci table will automatically analyze the graph for you, with trend factors through percentage, almost infallible use, you can always work when the percentage is low or high, start shopping and sales on time, great for analyzing entries!
In the images below we can see an example in gold in H4, where we are at
FREE
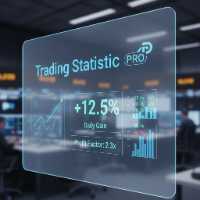
The statistical indicator for the metatrader 5 TradingStatisticPro collects statistical data on your trade, which makes it easier to assess the effectiveness of trading, the profit received and the risks. The indicator is compactly placed in the corner of the main chart of the terminal and displays the following information: 1. The profit earned. 2. Maximum drawdown. 3. The recovery factor. 4. Profit factor. 5. The ratio of profitable and unprofitable transactions (winrate). 6. Average profit a
FREE

This indicator uses a different approach from the previous version to get it's trendlines. This method is derived from Orchard Forex, and the process of making the indicator is demonstrated in there video https://www.youtube.com/watch?v=mEaiurw56wY&t=1425s .
The basic idea behind this indicator is it draws a tangent line on the highest levels and lowest levels of the bars used for calculation, while ensuring that the lines don't intersect with the bars in review (alittle confusing? I know
FREE

"빅 피규어 인디케이터(BIG FIGURE INDICATOR)"는 자동으로 화폐 거래에서 1.0000이나 1.5000과 같은 정수나 절반 수와 같은 구체적인 수준에서 가격 차트에 수평선을 자동으로 인식하고 그립니다. 이러한 수준은 대규모 거래자와 투자자들이 집중할 수 있는 라운드 넘버(round number)를 대표하여 심리적으로 중요하다고 간주되며, 잠재적인 지지 또는 저항 수준으로 이어질 수 있습니다. 빅 피규어 인디케이터는 거래자가 중요한 가격 수준을 식별하고 이러한 수준을 기반으로 거래 결정을 내리는 데 도움이 될 수 있습니다.
라인은 M1과 H4 TIMEFRAME 차트 사이에서만 볼 수 있습니다.
라인의 색상은 Inputs Parameter 탭에서 변경할 수 있습니다.
모든 통화 쌍과 함께 사용할 수 있습니다.
MT5 버전: https://www.mql5.com/fr/market/product/96750
참고: 본 인디케이터의 최상의 기능을 위해서는 먼저 일일(D
FREE
This indicator is a professional Trend identifier, it measures the angle or slope of moving averages with different methods. As this indicator calculate angles you can identify the strength of trend by magnitude of angle. It also shows if angle is increasing or decreasing which gives you the opportunity to make more information about current trend. You can combine this indicator with your strategy as a filter or you can use it alone to make your trading system. This is not a repainting indicator
FREE

Draw and Sync Objects Multiple Charts 1. Draw objects by key press. ( You must: 1. Press Function key => 2. Click where you want to draw => 3. Draw it => 4. Press ESC to complete). (If you don't want to draw after pressing function key, you must press ESC to cancel). 2. Developing : Sync selected objects to multiple charts by button. 3. Developing: Hide objects that do not belong to the current symbol (Objects drawn with this indicator will belong to the symbol they are plotted
FREE

Check my p a id tools they work perfect please r ate Here is an Upgraded version with Bonus Ea in case of purchase it costs 30$ only and you get Ea as Bonus: https://www.mql5.com/en/market/product/96835 This indicator is experimetal, it shows TMA channel arrows with Volatility filter built in to avoid lagging. Try to experiment with it, search for better conditions of use. It is possible to adjust different timeframes for TMA and for Volatility filter Same time on the current chart, so it ma
FREE

All-in-one trading powerhouse: trend, reversal, and exhaustion detection
This indicator is a personal implementation of the famous Traders Dynamic Index, which uses RSI, moving averages and volatility bands to find trends, reversals and price exhaustions. However, this particular implementation supports not only RSI, but many others. It is suitable for scalping, day trading, and swing trading and aims to provide a full picture of the current market conditions. [ Installation Guide | Update Guid
FREE
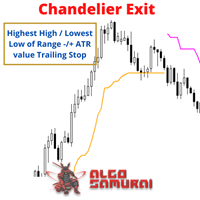
Developed by Chuck LeBeau, the Chandelier Exit indicator uses the highest high / lowest low -/+ a multiple of the ATR value to draw trailing stop lines (orange under buys, magenta over sells) that advance with the trend until the trend changes direction.The value of this trailing stop is that it rapidly moves upward in response to the market action. LeBeau chose the chandelier name because "just as a chandelier hangs down from the ceiling of a room, the chandelier exit hangs down from the high
FREE

Consecutive Candle Indicator MT4로 트렌드 탐지 능력을 강화하세요. 이 다이나믹한 도구는 연속적인 강세 또는 약세 캔들 시퀀스를 식별하도록 설계되어 외환, 주식, 암호화폐, 상품 시장에서 트렌드 확인 및 잠재적 반전을 위한 적시 알림을 제공합니다. Forex Factory와 Reddit의 r/Forex와 같은 거래 커뮤니티에서 찬사를 받고 있으며, Investopedia와 TradingView에서의 논의에서도 모멘텀 분석을 단순화하는 능력으로 인해 호평을 받고 있어, 변동성 높은 시장에서 명확한 신호를 찾는 트레이더들 사이에서 인기 있는 도구입니다. 사용자들은 더 높은 캔들 수(예: 연속 3-5개 캔들)를 사용할 때 지속적인 트렌드 탐지 정확도가 최대 80%에 달하며, 조기 진입을 피하고 확인된 모멘텀 변화를 집중함으로써 거래 타이밍이 15-25% 개선되었다고 보고합니다. 이점으로는 트렌드 강도의 정확한 식별, 핸즈프리 모니터링을 위한 사용자 정의 알림, 추
FREE
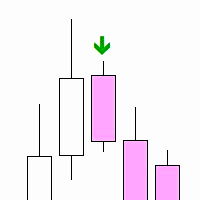
"Inside Bar PA" is a technical indicator designed to determine the inner bars on the chart. An internal bar is a bar or candle, the maximum and minimum of which are completely contained in the previous bar. This may signal a potential reversal or continuation of the trend, depending on the context.
Features: Automatic detection of internal bars. Visual marking of internal bars with arrows on the chart. The ability to adjust the distance of the mark from the bar. How to use: Attach the indicato
FREE

Moving Average Trend Alert is a triple MA indicator that helps traders to identify potential market trends based on 3 MAs alignment and crossover.
Moving Average Trend Alert features: Customizable short-term, medium-term, and long-term MAs. Option to filter signals based on a minimum distance between moving averages to avoid premature MAs alignment. Optional Filter of signals with RSI indicator overbought/oversold levels. Optional Filter of signals with ADX indicator. Popup, email, and phone no
FREE

As per name Strength, This Indicator is a affordable trading tool because with the help of Popular Developers & Support of M Q L Platform I have programmed this strategy. I tried to input different types and different periods of Calculation regarding Support Resistance, Trends, Trend lines, Currency Strength, Oversold and Overbought Indications for good results. Furthermore, I have also care about Adjustable Settings So Trader can easily get in touch with market in another way also. What
FREE

Synchronize objects from one chart to multiple charts. Synchronize objects from one chart to multiple charts. 1. Allows automatic synchronization of new and edited objects to other charts. 2. Allows synchronization of all objects on the chart to other charts at the current time. 3. Allows setting the charts to synchronize based on the position of the chart in the MT4 window. Version 1.2: Allow set list of object names that you don't want to sync (Separated by commas ",")
Allow set 5 types of o
FREE
설명:
MetaTrader 4용 NR4 & NR7 Inside Bar Highlighter 는 NR4 또는 NR7 과 Inside Bar 의 조합에 기반한 가격 압축 패턴을 자동으로 감지하는 지표입니다. 작동 방식:
**NR4 (Narrow Range 4)**는 최근 4개 봉 중 범위가 가장 좁은 봉을 식별하고, NR7 은 최근 7개 봉을 고려합니다. 이러한 좁은 범위 조건이 Inside Bar (이전 봉 안에 완전히 포함된 봉)과 동시에 발생하면, 종종 강력한 브레이크아웃 이전의 저변동성 국면을 시사합니다. 이 패턴들은 브레이크아웃 전략에서 널리 활용됩니다. 강조된 신호:
지표는 차트 상에서 관련 봉들을 설정 가능한 색상으로 표시합니다: NR4 + Inside Bar: 흰색 NR7 + Inside Bar: 주황색 각 신호에는 시각적 식별을 위한 라벨도 함께 표시됩니다. 통합 및 알림:
이 시스템은 MetaTrader 4에서 시각적 알림 , 이메일 , 사운드 또는 맞춤형 트레
FREE

Rua Pinbar This is an indicator to help you quickly identify pinbar candles in the chart. Can be used on any currency pair and any time frame you want. This indicator is often used to determine entry points. You can refer to the product here: https://www.mql5.com/en/users/phamruacoder/seller
A product of Ruacoder Get code indicator and robot (EA) as required.
FREE

The Grand Signal indicator is a unique tool that not only provides an understanding of market behavior but also precisely identifies trend entry points after intraday correction limits, with accuracy down to a five-minute candlestick! It includes individual settings for each currency pair. After purchasing, be sure to message me directly for instructions! Telegram: @Lapinsania or here in the Market! I
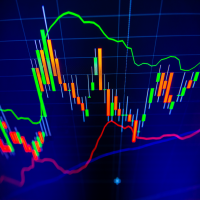
The indicator calculates reversal points based on the past trend and forms a channel (outer) on this basis. This elapsed time span from which the reversal points are determined can be specified in the settings.
An inner channel is also drawn in white. The trend continues in this channel, if there is a sideways trend. Here the upper / lower line form the possible turning point.
The indicator is suitable for all trading areas, whether forex, crypto, metals, indices or futures. All areas traded
DBD AND RBR CANDLESTICK PATTERN: This indicator based on the concept of two candlestick patterns. DROP BASE DROP (DBD) is a buy candlestick pattern and RALLY BASE RALLY (RBR) is a sell candlestick signal pattern. The arrows indicate potential signal setup for long trade and short trade. This indicator includes pop-up alert, push to phone and send to email alert which can be enabled and disabled. The color and size for DBD and RBR can be changed.

This indicator analyzes the ranges in the selected LookBack Bars and shows the relative strength of the price movement with the Level percentage you set. The blue line indicates that the current price movement is strong, and the yellow line indicates that we are in a flat price movement. The blue line does not determine whether the price action is up or down, it just shows relative strength. Therefore, as seen in the picture, direction can be determined with a simple zigzag indicator on the main

Price Channels are also known as Donchian Channels being named after Richard Donchian. They use the highest and lowest price of a set number of periods to create an upper and lower channel or envelope around the price. The upper channel shows the high of the number of periods chosen. The lower channel shows the low of the number of periods chosen. For example, the screenshot shows the Price Channels using 320 periods. The upper channel in the screenshot shows the highest high of the previous 3
FREE

Use with disciplined risk management. Fibonacci entry system based on the golden zone 38.2 - 61.8 where the entry is confirmed at 23.6 with indications of Take Profit 3:1. Automatically plotted Fibonacci contains retracement and expansion Fibonacci in a single indicator. Up to 77% win rate with this system. FTMO challenge pass with 0.50% risk and 1.50% R:R.
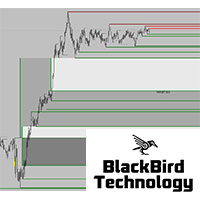
Dear Traders, check out my new multi level market liquidity indicator : https://www.mql5.com/en/market/product/73098
Many of you have been trading very good with this indicator, thanks for the support and positive feedbacks ! For more information about market liquidity, a manual on how to use this indicator please send me a message. A lot of information can be found on the net. (search liquidity trading/ inner circle trader)
https://www.youtube.com/watch?v=yUpDZCbNBRI
https://www.youtube.com/

Introducing a powerful, precision-engineered indicator that seamlessly combines Pivot Points, Moving Averages, and Multi-Timeframe Analysis to deliver high-probability Buy and Sell signals in real-time. This tool is your strategic edge, designed to identify trend reversals, market momentum, and optimal trade entries, no matter your preferred trading style.
Our algorithm goes beyond standard indicators—by analyzing multiple timeframes simultaneously, it spots true market turning points while fi
This Indicator only places quality trades when the market is really in your favor with a clear break and retest. Patience is key with this price action strategy!
If you want more alert signals per day, you increase the number next to the parameter called: Support & Resistance Sensitivity. After many months of hard work and dedication, we are extremely proud to present you our Break and Retest price action indicator created from scratch. One of the most complex indicators that we made with over

This indicator signals about crossing of the main and the signal lines of stochastic (lower stochastic) in the trend direction which is determined by two stochastics of higher time frames (higher stochastics). It is not a secret that stochastic generates accurate signals in a flat market and a lot of false signals in a protracted trend. A combination of two stochastics of higher time frames performs a good filtration of false signals and shows the main tendency. The indicator is recommended for
FREE
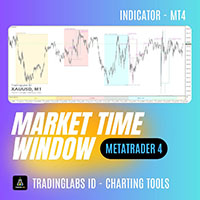
ICT Market Time Cycle – Complete Session & Time Window ICT Market Time Cycle is a professional trading indicator designed to help traders follow the ICT (Inner Circle Trader) methodology with ease.
It automatically displays the main market sessions (Asia, London, and New York), along with Killzones, Silver Bullet windows, and Macro times directly on your chart. With this tool, you no longer need to calculate session times manually – everything is plotted automatically in a clean and professional

When prices breakout resistance levels are combined with Larry Williams' Percentage Range "WPR" oscillator breaks out its historical resistance levels then probability emerges to record farther prices. It's strongly encouraged to confirm price breakout with oscillator breakout since they have comparable effects to price breaking support and resistance levels; surely, short trades will have the same perception. Concept is based on find swing levels which based on number of bars by each side
FREE

Principles of construction of the indicator. The Absolute Bands (AB) indicator is reminiscent of the Bollinger Bands indicator with its appearance and functions, but only more effective for trading due to the significantly smaller number of false signals issued to them. This effectiveness of the Absolute Bands indicator is due to its robust nature. In the Bollinger Bands indicator, on both sides of the moving average - Ma, there are lines spaced from Ma by the standa
FREE

The Candle Countdown Timer for MetaTrader 4 (also available for MT5) is a vital indicator designed to help you manage your trading time effectively. It keeps you updated about market open and close times by displaying the remaining time before the current candle closes and a new one forms. This powerful tool enables you to make well-informed trading decisions. Key Features: Asia Range: Comes with an option to extend the range. Broker Time, New York, London Time: Displays the current broker time
FREE

This masterpiece blends cutting-edge Advance MA, HMA, and Momentum logic into stunning gold star signals, giving you the power to spot market shifts without the guesswork. Perfect for every trader—beginner or expert—this tool turns your XAUUSD charts into a goldmine of opportunity. Don’t just trade—thrive!
Why You’ll Love It
Crystal-Clear Signals : Gold star alerts highlight key market moments, guiding your decisions with ease. Smart Moving Average : Pair with the Advance MA to confidently de
FREE

제품 제목 Smart Accumulation (MT4) – SmartView 시리즈의 일부 간단한 설명 MetaTrader 플랫폼에서 독특한 사용자 경험을 제공하는 Accumulation 지표입니다. 이전에 사용할 수 없었던 고급 기능을 제공하며, 더블 클릭으로 설정 열기, 삭제하지 않고 지표 숨기기/표시하기, 지표 창을 전체 차트 크기로 표시하기 등의 기능을 포함합니다. SmartView Indicators 시리즈의 나머지 부분과 원활하게 작동하도록 설계되었습니다. 개요 SmartView 시리즈는 혁신적인 기능을 통해 MetaTrader 플랫폼의 지표에 독특하고 독특한 사용자 경험을 제공하여 지표 관리를 더 빠르고 쉽게 만듭니다. 각 지표는 차트에 스마트 제어 패널이 장착되어 있어 필수 정보를 표시하고 모든 중요한 기능에 빠르게 액세스할 수 있습니다. 이전에 사용할 수 없었던 고유한 기능 SmartView 시리즈는 지표 작업을 더 쉽고 빠르게 만드는 고급 기능을 제공합니다: 더블
FREE

제품 제목 Smart ATR (MT4) – SmartView 시리즈의 일부 간단한 설명 MetaTrader 플랫폼에서 독특한 사용자 경험을 제공하는 ATR 지표입니다. 이전에 사용할 수 없었던 고급 기능을 제공하며, 더블 클릭으로 설정 열기, 삭제하지 않고 지표 숨기기/표시하기, 지표 창을 전체 차트 크기로 표시하기 등의 기능을 포함합니다. SmartView Indicators 시리즈의 나머지 부분과 원활하게 작동하도록 설계되었습니다. 개요 SmartView 시리즈는 혁신적인 기능을 통해 MetaTrader 플랫폼의 지표에 독특하고 독특한 사용자 경험을 제공하여 지표 관리를 더 빠르고 쉽게 만듭니다. 각 지표는 차트에 스마트 제어 패널이 장착되어 있어 필수 정보를 표시하고 모든 중요한 기능에 빠르게 액세스할 수 있습니다. 이전에 사용할 수 없었던 고유한 기능 SmartView 시리즈는 지표 작업을 더 쉽고 빠르게 만드는 고급 기능을 제공합니다: 더블 클릭으로 설정 열기: 지표 목록을
FREE

Chart Patterns Detect 15 patterns (Ascending Triangle, Descending Triangle, Rising Wedge, Falling Wedge, Bullish Flag, Bearish Flag, Bullish Rectangle, Bearish Rectangle Symmetrical triangle, Head and Shoulders, Inverted Head and Shoulders, Triple top, Triple Bottom, Double Top, Double Bottom) Use historical data to calculate the probability of each pattern to succeed (possibility to filter notification according to the chance of success) gives graphic indication about the invalidation level and

Dark Oscillator is an Indicator for intraday trading. This Indicator is based on Counter Trend strategy, trying to intercept changes in direction, in advance compared trend following indicators. We can enter in good price with this Indicator, in order to follow the inversion of the trend on the current instrument. It is advised to use low spread ECN brokers. This Indicator does Not repaint and N ot lag . Recommended timeframes are M5, M15 and H1. Recommended working pairs: All. I nst
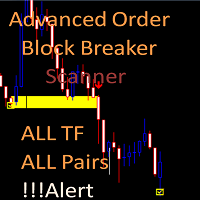
Advanced Order Block Breaker Scanner
This Scanner is free to download but is dependent on you owning the advance order block breaker indicator. Need to purchase the indicator here: https://www.mql5.com/en/market/product/59127
MT5 version: https://www.mql5.com/en/market/product/62769
The Scanner will show you on a single chart all the timeframes (M1 to Monthly) with their own status for the indicator: advance order block breaker Scan all time frame and all symbol: breaker's smart algor
FREE
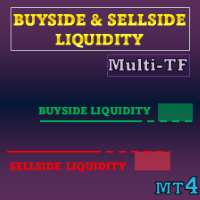
특별 제공 : 모든 도구 , 개당 $35 . 신규 도구 는 첫 주 또는 처음 3건 구매 까지 $30 입니다! MQL5 Trading Tools 채널 : 최신 소식을 받으려면 제 MQL5 채널에 가입하세요 이 지표는 유동성 레벨 과 유동성 존 을 ICT 개념 에 기반하여 시각화하고, 단방향 가격 이동을 강조하기 위해 Liquidity Voids 를 표시합니다. 스톱/미결 주문이 모이기 쉬운 위치와, 가격이 이를 통과한 이후 해당 영역이 어떻게 변하는지에 초점을 맞춥니다.
MT5 버전 더 보기: Buyside and Sellside Liquidity MT5 Multi Timeframe MT4 버전 더 보기: Buyside and Sellside Liquidity MT4 Multi Timeframe 더 많은 제품: All P roducts 핵심 하이라이트 • 색상으로 구분된 레벨/존으로 양방향 유동성 구조(buyside/sellside)를
MetaTrader 마켓은 개발자들이 거래 애플리케이션을 판매할 수 있는 간단하고 편리한 사이트이다.
제품을 게시하고 마켓용 제품 설명을 어떻게 준비하는가를 설명하는 데 도움이 됩니다. 마켓의 모든 애플리케이션은 암호화로 보호되며 구매자의 컴퓨터에서만 실행할 수 있습니다. 불법 복제는 불가능합니다.
트레이딩 기회를 놓치고 있어요:
- 무료 트레이딩 앱
- 복사용 8,000 이상의 시그널
- 금융 시장 개척을 위한 경제 뉴스
등록
로그인
계정이 없으시면, 가입하십시오
MQL5.com 웹사이트에 로그인을 하기 위해 쿠키를 허용하십시오.
브라우저에서 필요한 설정을 활성화하시지 않으면, 로그인할 수 없습니다.