SmartSignal
- 지표
- 버전: 5.0
- 업데이트됨: 5 5월 2025
- 활성화: 7
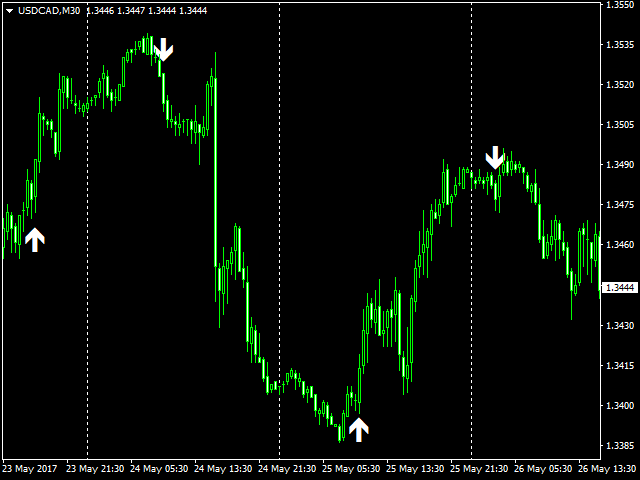
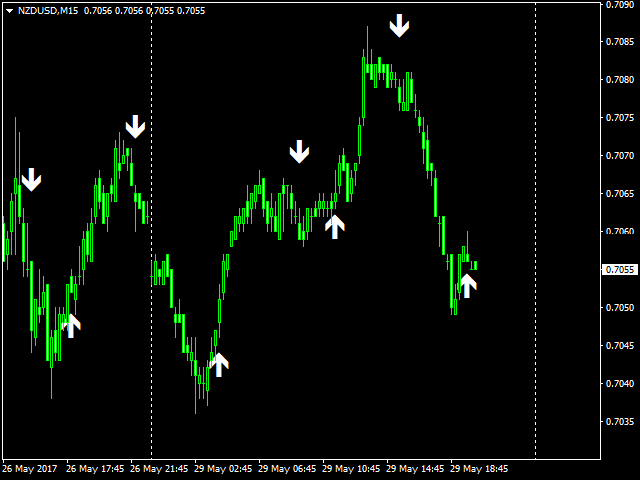
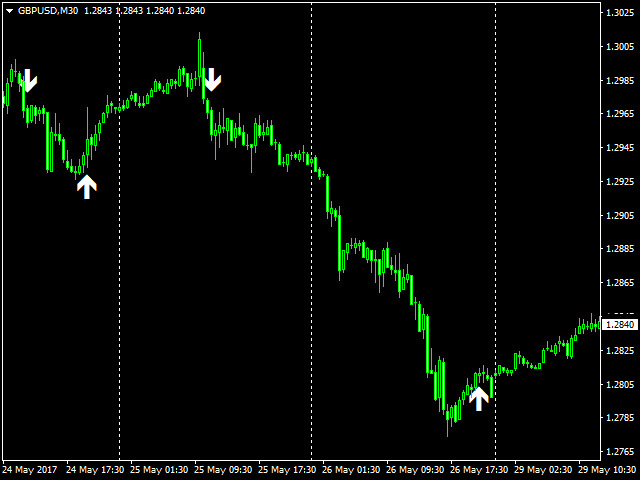
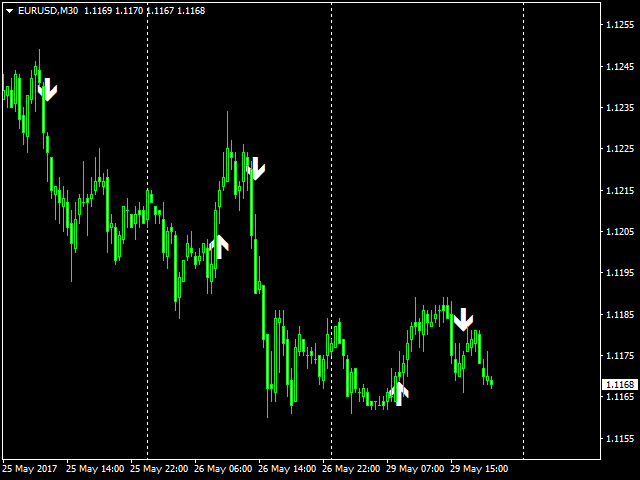
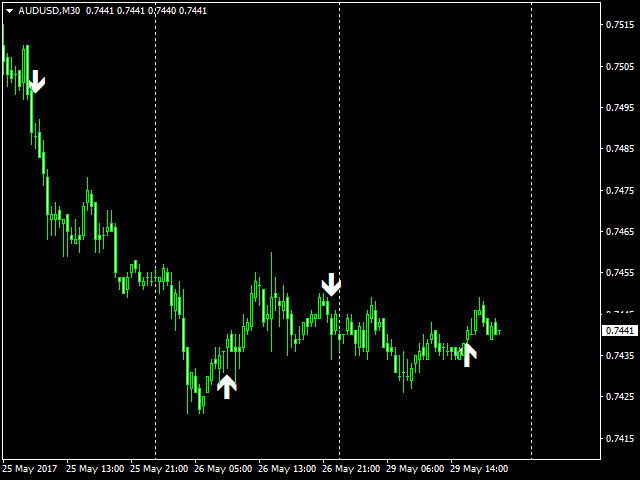
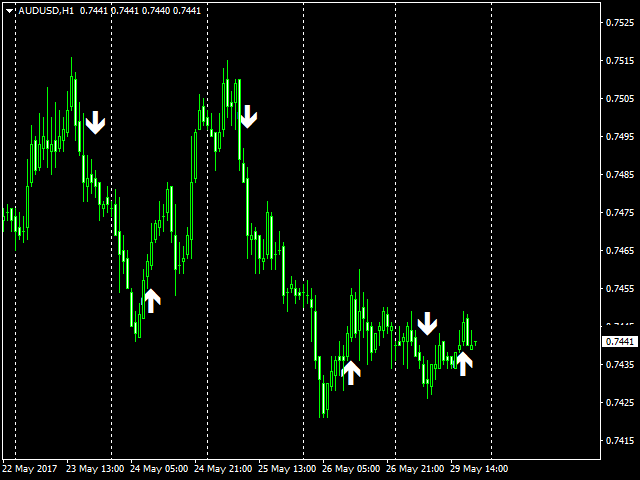
For any trader, the result of market analysis is the correct identification of the market entry and exit points. The more correctly they are selected, the more profitable the trading. The SmartArrows indicator does not display any excessive information that may distract or confuse the trader, but only the mot important things. The indicator is very simple to use. When a down arrow appears, open a SELL trade, with an up arrow open BUY.
Despite its seeming simplicity, the SmartArrows indicator contains a large analytical algorithm, which allows it to work as efficiently as possible.
The indicator generates 2 types of signals - confirmed and unconfirmed. Confirmed signal (large white arrow) is a signal that corresponds to the global trend, unconfirmed signal (small arrow) is a signal that goes against the global trend. Each user can select the suitable trading mode - use all indicator signal, or only the ones that match the global trend.
This indicator does not redraw, it generates signals on the current bar. If an arrow appears, it does not disappear regardless of the development of the market situation.
Indicator Input Parameters
- period - sensitivity of the indicator (the higher the value, the fewer signals are obtained)
- EnableAlerts - enable/disable generating audio alerts when a signal appears
- EmailAlert - enable/disable sending email messages when a signal appears
- MobileAlert - enable/disable sending push notifications when a signal appears
- UseFilter - use the filter of signals based on correspondence to the global trend
- MainFilterPeriod - global filter parameter (if UseFilter = true)
- ExtraFilterPeriod - additional filter parameter (if UseFilter = true)


사용자가 평가에 대한 코멘트를 남기지 않았습니다