MetaTrader 4용 기술 지표 - 7

Indicator Help to Show About CCI Multi Timeframe. ( 1M , 5M , 15M , 30M , 1Hr, 4Hr, 1D)
You can change period as you want.
CCI indicator
The commodity channel index (CCI) is an oscillator indicator that helps show when an asset has been overbought or oversold.It helps you identify peaks or troughs in an asset's price and can indicate the weakening or end of a trend and a change in direction.This means a you can, in theory, enter a trade right as a trend is beginning, or exit an existing trade

A useful scanner/dashboard that shows the RSI values for multiple symbols and time-frames.
It can be easily hidden/displayed with a simple click on the scanner man top left of the dashboard.
You can input upper and lower RSI values and the colours can be set to show when above/below these values. The default values are 70 and 30. There are also input colours for when the RSI is above or below 50 (but not exceeding the upper/lower levels
Symbols and time-frames are input separated by commas.
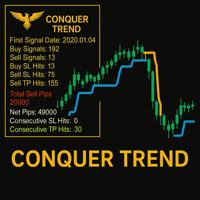
Conquer Trend – Master the Trend Like Never Before! Conquer Trend is your ultimate solution for dominating the markets with precision and simplicity. Built for traders who want to ride the strongest trends across any pair and any time frame, this powerful indicator brings together trend detection, retest confirmation, and performance tracking — all in one streamlined tool.
Multi-Timeframe Trend Analysis Get a clear view of the trend across multiple timeframes. Whether you're scalping, day tra

The indicator show Higher timeframe candles for ICT technical analisys Higher time frames reduce the 'noise' inherent in lower time frames, providing a clearer, more accurate picture of the market's movements.
By examining higher time frames, you can better identify trends, reversals, and key areas of support and resistance.
The Higher Time Frame Candles indicator overlays higher time frame data directly onto your current chart.
You can easily specify the higher time frame candles you'd li

Tick Speed Pro povides a charted record of tick speed to allow you to see the ebb and flow of market activity. Observing patterns in tick speed may allow you to better time entries to reduce slippage and re-quotes.
The tick speed plot updates it's entire position to show you only the last N seconds you choose, ideal for scalping and HFT approaches. An alert is provided to signal when the instrument is getting ticks at a higher rate than the alert limit. Multiple loadings are supported to compare
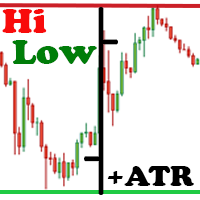
The Hi Low Last Day ( Hi Lo Last Day ) indicator shows the high and low of the last trading day and the second trading day, as well as the minimum and maximum of last week . There are many trading strategies on the daily levels. This indicator is indispensable when using such trading strategies. In fact, everything is simple in trading, you just need to understand and accept it for yourself. There is only price!!! What is price? This is the level on the chart. The level is the price that the

The Elephant Candle is an indicator for MT4. It draws arrows when strong bullish or bearish candles appear. Strong candles frequently initiate a new trend. The arrows can be used in expert advisors. This indicator can improve already existing trading strategies. The indicator is very fast and doesn't repaint.
Inputs Period Candle Multiplier Candle Niceness [%] Arrow Size Enable Alert Enable Push Notification Enable Email
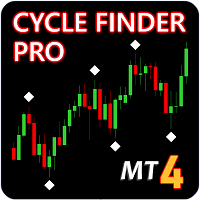
Update - Version 4.0 now includes trend change signal. Indicator will tell you the current trend on all charts. Update - Version 5.0 now includes alerts for mt4, push and email notifications.
Cycle Finder Pro is a chart reading indicator and is designed for trend and pattern traders . Chart reading is time consuming and complex and requires knowledge of price action , cyclicity, and time frame correlation . Cycle Finder Pro reads all this in one simple indicator so you can spot trend and char
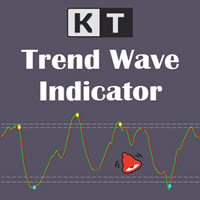
KT Trend Wave is an oscillator based on the combination of Price, Exponential, and Simple moving averages. It usually works great to catch the short term price reversals during the ongoing trending market. The bullish and bearish crossovers of the main and signal lines can be used as buy/sell signals (blue and yellow dot). It can also be used to find the overbought and oversold market. The buy and sell signals that appear within the overbought and oversold region are usually stronger.
Features
Trend WTS — Advanced Modular Trend & Signal Indicator for XAUUSD (M5 Optimized) Unlock precise trading insights with Trend WTS , a powerful and modular trend and signal indicator designed specifically for XAUUSD on the M5 timeframe. Built for traders seeking accuracy and clarity, Trend WTS combines fast moving average crossovers with a long-term EMA filter to deliver reliable buy and sell signals tailored for the gold market. Key Features: Dual Moving Average Trend Detection: Detect strong trend
FREE

Target Geometry is a next-generation indicator that uses the geometric nature of the markets to give high statistical probability levels ( Fibonacci ). This indicator creates a very important map that optimizes the entry points and it optimally defines your own money management. The indicator can be used both in static mode or in dynamic mode, you can use it on any financial instrument. The use in multi timeframe mode is a very good ally to have. The target levels are high statistical probabilit

About: Someone recently shared a pinescript with me. And asked me to convert it to MT4. I found the FVG blocks very effective as SR areas. So here it is. Enjoy!!
What are Fair Value Gaps (FVG)? Fair Value Gaps occur when price moves so quickly that it creates an imbalance between buyers and sellers. These gaps represent areas where price "skipped" levels, creating potential zones for price to return and "fill the gap". Think of it as unfinished business in the market that often gets revisited.
FREE

Elliott Wave Trend was designed for the scientific wave counting. This tool focuses to get rid of the vagueness of the classic Elliott Wave Counting using the guideline from the template and pattern approach. In doing so, firstly Elliott Wave Trend offers the template for your wave counting. Secondly, it offers Wave Structural Score to assist to identify accurate wave formation. It offers both impulse wave Structural Score and corrective wave Structure Score. Structural Score is the rating to sh

"Wouldn't we all love to reliably know when a stock is starting to trend, and when it is in flat territory? An indicator that would somehow tell you to ignore the head fakes and shakeouts, and focus only on the move that counts?" The Choppiness Index is a non-directional indicator designed to determine if the market is choppy (trading sideways) or not choppy (trading within a trend in either direction). It is an oscillating indicator between -50 (very trendy) and +50 (very choppy). There are man

SuperTrend Alert MT4로 시장 트렌드를 마스터하세요. 이 강력한 인디케이터는 외환, 주식, 암호화폐, 상품 거래를 위한 정확한 트렌드 추종 신호를 제공하도록 설계되었습니다. Forex Factory와 Reddit의 r/Forex와 같은 거래 커뮤니티에서 찬사를 받고 있으며, Investopedia와 TradingView의 논의에서도 견고한 트렌드 탐지 능력으로 호평받고 있어, 신뢰할 수 있는 진입 및 퇴장 지점을 찾는 트레이더에게 필수적인 도구입니다. 사용자들은 SuperTrend 신호를 프라이스 액션과 결합하여 트렌드 방향을 최대 90%의 정확도로 식별하며, 실시간 알림을 활용하여 트렌드 변화를 포착함으로써 거래 타이밍이 25-35% 개선되었다고 보고합니다. 주요 이점에는 고급 트렌드 분석, 맞춤형 설정을 통한 개인화된 전략, 지속적인 차트 모니터링 없이 스캘퍼, 데이 트레이더, 스윙 트레이더의 의사 결정을 향상시키는 경량 디자인이 포함됩니다. SuperTrend A
FREE
# 33% off - limited time only #
ChartSync Pro MT4 is an indicator, designed for the MetaTrader 5 trading terminals. It enables the trader to perform better multi-timeframe technical analysis, by synchronizing symbols and objects into virtually unlimited charts. Built by traders for traders! Telegram Premium Support - Dd you purchase the Chart Sync indicator and need a bit of help? Send us a screenshot with your purchase and your Telegram ID so we can add you to our premium support Telegram

Consolidation Zone Indicator is a powerful tool designed for traders to identify and capitalize on consolidation patterns in the market. This innovative indicator detects consolidation areas and provides timely alerts when the price breaks above or below these zones, enabling traders to make informed trading decisions. MT5 Version : https://www.mql5.com/en/market/product/118748 Join To Learn Market Depth - https://www.mql5.com/en/channels/suvashishfx
Key Features:
1. Consolidation Detecti
FREE

Unleash Your Trading Potential with the Ultimate Trend Sniper Are you tired of missing out on major market moves? Want to spot trends with laser-like precision? The Ultimate Trend Sniper is a powerful, yet easy-to-use indicator designed to help you do just that. It's not just another moving average—it's a smart tool that gives you a clear edge in the market. Main Features & Benefits: Precision Entry & Exit Signals: The indicator uses two advanced T3 moving averages to generate highly accurate bu
FREE
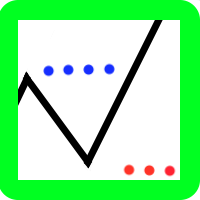
The indicator is a polyline (ZigZag segment) that tracks and connects the extreme points of the chart price that are at least a specified size apart from each other in points on the price scale.
The one and only setting is the minimum size (in points) of a ZigZag segment. The indicator displays levels to determine a possible trend reversal:
level "LevelForUp" - the breaking of this level determines the possible reversal of the trend up (to buy);
level " LevelForDown " - the breaking o

The Supply and Demand Zone Indicator is a powerful and easy-to-use tool designed to help traders identify critical supply and demand zones on the chart. These zones can provide valuable insight into potential market reversals, breakouts, and important price levels where buyers or sellers are likely to take control. The best FREE Trade Manager . If you want to create your own Hedging or Grid strategies without any coding make sure to check out the ManHedger Key Features: Automatic Zone Detect
FREE
Engulfing Candle Signal Alert: Elevate Your Trading Strategy Unlock the full potential of your trading with the Engulfing Candle Signal Alert, the ultimate tool for identifying market reversals and enhancing your trading precision. Designed specifically for traders who value accuracy and timely alerts, this powerful indicator detects engulfing candle patterns, a key signal in technical analysis that often indicates a potential shift in market direction. What is an Engulfing Candle? An engu
FREE

RSI TrendGate 3MA는 RSI와 3개의 이동평균선(MA)을 조합하여 추세 방향을 더 명확하게 확인할 수 있도록 돕는 차트 표시용 인디케이터입니다.
선택한 조건에 따라 시장 상태가 “상승 우위” 또는 “하락 우위”로 판단될 때, 차트 창에 화살표를 표시합니다. 이 제품은 화살표를 단독 매매 신호로 사용하도록 설계되지 않았습니다. 권장 사용 방식은 상위 시간대에서 방향을 확인하고, 하위 시간대에서는 사용자의 자체 규칙으로 진입 타이밍을 결정하는 운용입니다. 개요 본 인디케이터는 다음 요소를 기반으로 방향을 판정합니다. 3개 MA의 정렬로 레짐 판정(방향의 기반)
단기/중기/장기 3개 MA를 계산하고, 정렬 상태에 따라 시장을 분류합니다. 상승 레짐: MA Short > MA Mid > MA Long 하락 레짐: MA Short < MA Mid < MA Long 레짐 없음: 그 외의 상태(MA가 서로 얽혀 방향이 명확하지 않음) 단기 MA 기울기 필터(선택)
단기 MA의 기울기
FREE

Free automatic Fibonacci is an indicator that automatically plots a Fibonacci retracement based on the number of bars you select on the BarsToScan setting in the indicator. The Fibonacci is automatically updated in real time as new highest and lowest values appears amongst the selected bars. You can select which level values to be displayed in the indicator settings. You can also select the color of the levels thus enabling the trader to be able to attach the indicator several times with differe
FREE

ON Trade Waves Patterns Harmonic Elliot Wolfe를 소개합니다. 이는 수동 및 자동 방법을 사용하여 다양한 시장 패턴을 감지하기 위해 개발된 고급 지표입니다. 다음은 그 작동 방식입니다: 조화적 패턴: 이 지표는 차트에 나타나는 조화적 패턴을 식별할 수 있습니다. 이러한 패턴은 Scott Carney의 "Harmonic Trading vol 1 및 2"에서 설명한 것처럼 조화적 거래 이론을 연습하는 트레이더에게 중요합니다. 수동으로 그리든 자동 감지를 사용하든 ON Trade Waves Patterns가 도움을 줄 것입니다. 컨트롤 패널: 이 지표에는 사용자 친화적인 컨트롤 패널이 있습니다. 차트 및 시간 프레임 설정을 저장하여 다양한 구성 간에 쉽게 전환할 수 있습니다. 차트 공간을 최대화하려면 최소화할 수도 있습니다. 다른 분석 도구를 사용하는 것을 선호하는 경우 닫기 버튼을 클릭하여 모든 지표 데이터를 숨길 수 있습니다. 템플릿 저장: 설정을 사

자동 고정 VWAPs로 거래 통찰력 해제하기: 자동 고정 VWAPs 는 거래 세계에서의 당신의 안내자입니다. 이 인디케이터들은 중요한 시장 전환점을 정확하게 찾아 VWAP 라인을 사용하여 차트에 나타냅니다. 이것은 고정 VWAP 전략을 사용하는 트레이더에게 혁명을 가져다주는 것입니다. 어떻게 작동하나요? 고점 식별: 현재 양초의 가장 높은 가격이 이전 양초의 가장 높은 가격보다 낮을 때, 그리고 이전 고점이 그보다 이전에 나온 고점보다 높을 때, 우리는 고점을 식별한 것입니다. 이 중요한 지점은 이 세 개의 양초 중간에 위치합니다. 저점 인식: 현재 양초의 최저 가격이 이전 양초의 최저 가격보다 높을 때, 그리고 이전 저점이 그보다 이전에 나온 저점보다 낮을 때, 우리는 바닥을 발견했습니다. 이 바닥의 중심이 바로 우리의 초점입니다. 고정된 VWAPs 그리기: 각 상단과 하단은 VWAP 라인에 해당합니다. 그러나 제한이 있습니다: 인디케이터의 계산 요구 사항으로 인해 차트에서 동시에

Fractals Dynamic Fractals Dynamic – 이제 프랙탈 동적 표시기를 기반으로하거나 기반으로 한 모든 거래 전략에는 추가 신호가 있습니다. 또한 프랙탈은 지원 및 저항 수준으로 작용할 수 있습니다. 그리고 일부 거래 전략에서는 유동성 수준을 보여줍니다. 이를 위해,이 버전의 멀티 프랙탈 및 멀티 프레임 표시기 MultiFractal Levels 에 레벨이 도입되었습니다. 당신은 어떤 가격 차트에 거래의 조수로 더 많은 정보,시각 및 유용이 표시를 찾을 수 있습니다. 거래 시스템에 추가로 Fractals Dynamic 표시기를 사용하십시오 또한 시장에 내 다른 제품을 사용해보십시오 https://www.mql5.com/ru/users/capitalplus/seller
지표가 마음에 드셨다면, 평가하고 리뷰를 남겨주세요. 저에게는 매우 중요합니다! 거래에서 큰 이익을 얻으세요!
FREE

트렌드 라인 맵 표시기는 트렌드 스크리너 표시기의 애드온입니다. Trend screener (Trend Line Signals)에 의해 생성된 모든 신호에 대한 스캐너로 작동합니다.
Trend Screener Indicator 기반의 Trend Line Scanner입니다. Trend Screener Pro 표시기가 없으면 Trend Line Map Pro가 작동하지 않습니다.
MQL5 블로그에 액세스하여 추세선 지도 표시기의 무료 버전을 다운로드할 수 있습니다. Metatrader Tester 제한 없이 구매하기 전에 사용해 보십시오. : 여기를 클릭하세요
1. 쉽게 얻을 수 있는 이점 통화 및 시간 프레임을 기반으로 매수 및 매도 신호를 표시합니다. 차트에 화살표가 나타난 이후 가격이 몇 핍 증가 또는 감소했는지 평가하십시오. ( 트렌드 스크리너 표시기 화살표 ) 신호의 타이밍을 표시합니다. 구매 및 판매 알림에 대한 다중 기간 및 다중 통화 알림 받기.
2. 추세

Gold Buster M1 System - XAUUSD 쌍의 M1 차트를 위한 전문 거래 시스템입니다. 그러나 시스템이 원래 금 거래 전용으로 개발되었다는 사실에도 불구하고 시스템은 일부 다른 통화 쌍과도 함께 사용할 수 있습니다. 구매 후 XAUUSD 외에 시스템에서 사용할 수 있는 거래 쌍 목록을 제공하여 이 시스템의 사용 가능성을 확장합니다. 시스템의 모든 표시기가 반복되지 않습니다! 이 시스템은 세 가지 지표의 집합입니다. 시장의 강세를 시각적으로 보여주는 추세 표시기, 화살표 표시기 및 거래량 표시기입니다. 구매 후 트렌드 지표를 즉시 다운로드할 수 있습니다. 나머지 두 지표는 전체 시스템의 일부이므로 무료로 제공합니다. 차트에 지표를 로드하는 데 사용할 수 있는 템플릿도 제공합니다. 또한 내 시스템과 거래하고 내 권장 사항을 공유하는 방법을 알려 드리겠습니다. 당신을 기다리고있는 큰 보너스도 있습니다! 구매 후 즉시 저에게 편지를 보내십시오!
Special offer : ALL TOOLS , just $35 each! New tools will be $30 for the first week or the first 3 purchases ! Trading Tools Channel on MQL5 : Join my MQL5 channel to update the latest news from me 개요
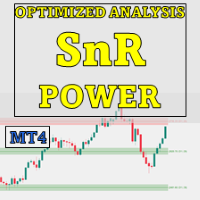
OA SnR Power는 트레이더가 지지와 저항 레벨의 강도를 식별하고 평가하도록 설계된 강력한 도구입니다. 거래량, 반등 빈도 및 재테스트 횟수와 같은 주요 요소를 통합하여 이 지표는 시장의 주요 가격 영역에 대한 종합적인 뷰를 제공합니다. 더 많은 제품 보기: 모든 제품 OA SnR Power의 작동 원리 고점과 저점 식별 이 지표는 지역 고점과 저점을 계산하기 위해 지능형 알고리즘을 사용합니다. 사용자는 영역 폭 설정을 조정하여 잠재적인 지지 및 저항 수준을 정확하게 탐지할 수 있습니다. 주요
FREE

We have combined all of our beloved indicators the likes of: Key level order block , Key level supply and demand , Key level liquidity grab and Key level wedge into one single indicator and dashboard.
Whats new Dashboard : There is an easy access dashboard for all your needs. Multi-timeframe button : There is now a multi-timeframe option for Order Blocks and Supply and demand zones, making it easy to see higher timeframe zones easily on the current timeframe by just clicking the desired timefra
이 지표는 차트에 공급 및 수요 구역을 그립니다. 이 지표를 귀하의 규칙과 기술과 결합하면 귀하만의 강력한 시스템을 만들거나 개선할 수 있습니다. 훨씬 더 많은 것을 제공하는 유료 버전 도 확인해 보세요. 제 추천은 최소 25개 막대 이후에 첫 번째 구역 테스트가 발생하는 거래 기회를 찾는 것입니다. 특징 구역에는 3가지 색상이 있습니다(입력으로 조정 가능). 테스트되지 않은 구역은 어두운 색상, 테스트된 구역은 중간 색상 , 깨진 구역은 밝은 색상입니다 . 각 구역의 바깥쪽 경계 가격과 구역 테스트 금액은 각 구역에 적혀 있습니다. 입력 매개변수 최대. 첫 번째 극값을 검색하기 위한 백바 - 기본값은 3000입니다. 시간 이전의 첫 번째 극값 xx 막대를 검색합니다. 값이 높을수록 더 많은 시스템 리소스가 필요합니다 . 느린 컴퓨터의 경우 500-1000 값이 더 적합할 수 있습니다. 존 테스트 사이의 최소 캔들 수 테스트되지 않은 수요 색상 테스트
FREE

Gold Pro Scalper
Precise entry points for currencies, crypto, metals, stocks, indices! Indicator 100% does not repaint!!!
If a signal appeared, it does not disappear! Unlike indicators with redrawing, which lead to loss of deposit, because they can show a signal, and then remove it.
Trading with this indicator is very easy.
Wait for a signal from the indicator and enter the deal, according to the arrow
(Blue arrow - Buy, Red - Sell).
I recommend using it with the Trend Filter (download

BinaryUniversal is a signal indicator for binary options and Forex. In its work, the indicator uses a complex algorithm for generating signals. Before forming a signal, the indicator analyzes volatility, candlestick patterns, important support and resistance levels. The indicator has the ability to adjust the accuracy of the signals, which makes it possible to apply this indicator for both aggressive and conservative trading. The indicator is set in the usual way, it works on any time period and
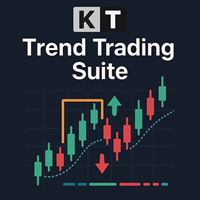
KT Trend Trading Suite는 트렌드 추종 전략과 여러 돌파 지점을 결합한 다기능 지표입니다. 이러한 돌파 지점은 진입 신호로 사용됩니다.
새로운 추세가 형성되면 이 지표는 여러 번의 진입 기회를 제공하여 트렌드를 성공적으로 따라갈 수 있도록 돕습니다. 덜 중요한 진입 신호를 피하기 위해 되돌림 기준값이 사용됩니다.
MT5 버전은 여기에서 확인할 수 있습니다 https://www.mql5.com/en/market/product/46270
기능
여러 가지 시장 흐름을 하나의 수식으로 결합하여 현재 추세를 명확하게 시각화합니다. 진입 신호가 발생한 구간에 직사각형 박스를 표시하여 지역 고점과 저점을 명확히 나타냅니다. 신호의 정확도를 측정하고 간단한 성능 지표를 제공합니다. 다중 시간대 대시보드를 포함하여 모든 시간 프레임을 스캔하고 각 시간대의 추세 방향을 표시합니다.
입력 파라미터
History Bars: 과거 신호 분석에 사용할 히스토리 바 개수입니다.

ACB Breakout Arrows 지표는 특별한 돌파 패턴을 감지하여 시장에서 매우 중요한 진입 신호를 제공합니다. 이 지표는 차트를 지속적으로 스캔하며 한 방향으로 안정적인 모멘텀이 형성되는지를 확인하고, 주요 움직임 직전에 정확한 진입 신호를 제공합니다.
다중 심볼 및 다중 타임프레임 스캐너 받기 – ACB Breakout Arrows MT4용 스캐너
주요 기능 지표가 자동으로 손절(Stop Loss) 및 이익실현(Take Profit) 레벨을 제공합니다. 모든 시간대의 돌파 신호를 추적하는 MTF 스캐너 대시보드가 포함되어 있습니다. 단타 트레이더, 스윙 트레이더, 스캘퍼에게 적합합니다. 정확도를 높이기 위한 최적화된 알고리즘 사용. 손익분기(Breakeven) 또는 단기 목표를 위한 특수 라인(퀵 프로핏 라인) 제공. 승률, 성공률, 평균 수익 등과 같은 성과 분석 지표 제공. 리페인트 없음 – 한번 생성된 신호는 사라지지 않습니다.
거래 확인 - 신뢰도 낮은 신호를
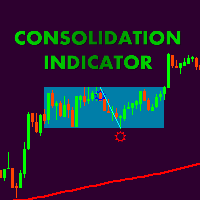
Сonsolidation box indicator with possibility of flexible settings according to the traiders requipments. Also, it is possible to embed indicatior in EA. Thank Alexey Mavrin for realization of technical task. According to the classic technical analysis the price is in motion without a clear direction for almost 70% of the market time and methods of getting profit from flat should be in the arsenal of any trader. Price consolidation- are periods of market equilibrium when supply and demand are app

The ZhiBiJuJi indicator analysis system uses a powerful internal loop to call its own external indicators, and then calls the analysis before and after the cycle. The data calculation of this indicator analysis system is very complicated (calling before and after the cycle), so the hysteresis of the signal is reduced, and the accuracy of the advance prediction is achieved. This indicator can be used in all cycles on MT4, and is most suitable for 15 minutes, 30 minutes, 1 hour, 4 hours. Buy:

Visit our all-new Stein Investments Welcome Page to get the latest information, updates and trading strategies. Do you want to become a constantly profitable 5-star forex trader? Then get our Stein Investments trading tools and send us a screenshot to get your personal invitation to our exclusive trading chat with 500+ members.
FX Trend displays the trend direction, duration, intensity and the resulting trend rating for all time frames in real time.
You'll see at a glance at which dire

The most crucial price level in any "Volume Profile" is the "Point of Control" . Is the price level with the highest traded volume. And mainly, is the level where the big guys start there their positions, so it's an accumulation/distribution level for smart money.
The idea of the indicator arose after the "MR Volume Profile Rectangles" indicator was made. When creating the "MR Volume Profile Rectangles" indicator, we spent a lot of time comparing the volumes with those from the volume profile

대칭 삼각형 차트 패턴은 가격이 강제로 상승 또는 붕괴되기 전에 수축 및 통합 기간을 나타냅니다. 하단 추세선에서의 분석은 새로운 약세 추세의 시작을 나타내고 상단 추세선의 이탈은 새로운 강세 추세의 시작을 나타냅니다. 대시보드를 사용하여 대칭 삼각형 패턴으로 거래하는 모든 상품과 시간 프레임을 한 번에 모니터링하십시오! https://www.mql5.com/en/market/product/69169/
MT5 버전 사용 가능: https://www.mql5.com/en/market/product/70006/
이 표시기는 이러한 패턴을 식별하고 4가지 핵심 포인트가 형성되고 가격이 다시 삼각형으로 되돌아갔을 때 경고하므로 잠재적인 돌파에 대비할 수 있습니다. 대칭 삼각형이 항상 완벽하게 대칭인 것은 아니며 가격이 오르거나 내릴 수 있지만 일반적으로 가장 성공적인 돌파는 삼각형의 첫 번째 점을 형성한 높거나 낮은 방향입니다. 따라서 지표는 돌파에 대한 강세 또는 약세 편향을 제공하

Welcome to our Price Wave Pattern MT4 --(ABCD Pattern)-- The ABCD pattern is a powerful and widely used trading pattern in the world of technical analysis.
It is a harmonic price pattern that traders use to identify potential buy and sell opportunities in the market.
With the ABCD pattern, traders can anticipate potential price movements and make informed decisions on when to enter and exit trades. EA Version : Price Wave EA MT4
MT5 version : Price Wave Pattern MT5
Features :
Automatic
FREE
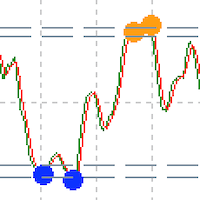
About RSI CyberZingFx RSI, a powerful MT4 indicator designed to provide traders with accurate signals and insights into the strength or weakness of a stock or market. Whether you are a seasoned trader or just starting out, CyberZingFx RSI can help you make informed trading decisions. Indicator Features
One of the standout features of CyberZingFx RSI is its unique technique for finding the best entry points to trade. By analyzing historical data and identifying oversold or overbought levels, thi
FREE
How To Determine If The Market is Strong Or Weak?
Strength Meter uses an Adaptive Algorithm That Detect Price Action Strength In 4 Important Levels! This powerful filter gives you the ability to determine setups with the best probability.
Features Universal compatibility to different trading systems Advance analysis categorized in 4 levels Level 1 (Weak) - Indicates us to WAIT. This will help avoid false moves Weak Bullish - Early signs bullish pressure Weak Bearish - Early signs bearish press
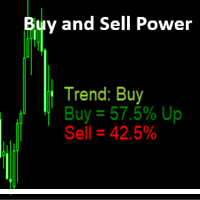
Simple Indicator that shows the Buy and Sell volume in percent.
Settings : Font size for percentage labels Horizontal offset from right edge (pixels) Vertical offset for Signal label from bottom (pixels) Vertical offset for Buy label from bottom (pixels) Vertical offset for Sell label from bottom (pixels) Color for Buy label Color for Sell label Color for Strong Buy signal Color for Buy signal Color for Strong Sell signal Color for Sell signal Color for Neutral signal Default to every tick
FREE

수익성 있는 거래 기회를 쉽게 식별하는 데 도움이 되는 강력한 외환 거래 지표를 찾고 계십니까? Beast Super Signal보다 더 이상 보지 마십시오. 사용하기 쉬운 이 추세 기반 지표는 시장 상황을 지속적으로 모니터링하여 새로운 개발 추세를 찾거나 기존 추세에 뛰어들 수 있습니다. Beast Super Signal은 모든 내부 전략이 정렬되고 서로 100% 합류할 때 매수 또는 매도 신호를 제공하므로 추가 확인이 필요하지 않습니다. 신호 화살표 알림을 받으면 구매 또는 판매하기만 하면 됩니다. 구매 후 비공개 VIP 그룹에 추가되도록 저에게 메시지를 보내주세요! (전체 제품 구매만 해당).
최신 최적화된 세트 파일을 구입한 후 저에게 메시지를 보내주세요.
MT5 버전은 여기에서 사용할 수 있습니다.
여기에서 Beast Super Signal EA를 받으세요.
최신 결과를 보려면 댓글 섹션을 확인하세요!
Beast Super Signal은 1:1, 1:2

Trade smarter, not harder: Empower your trading with Harmonacci Patterns This is arguably the most complete harmonic price formation auto-recognition indicator you can find for the MetaTrader Platform. It detects 19 different patterns, takes fibonacci projections as seriously as you do, displays the Potential Reversal Zone (PRZ) and finds suitable stop-loss and take-profit levels. [ Installation Guide | Update Guide | Troubleshooting | FAQ | All Products ]
It detects 19 different harmonic pric
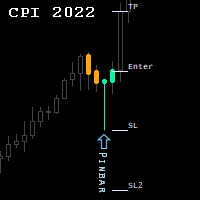
Candlestick Patterns Indicator.
NEW! FREE Candlestick Patterns Expert Advisor > https://www.mql5.com/en/market/product/105634?source=Site +Profile
The Indicator draws colored candlestick patterns, their description and future levels of Stop Loss / Take Profit. Combined with other market analysis, can greatly improve trading results. Indicator can be highly customized by the user including change of colors, fonts, levels, candle sizes etc...
developed, tested and optimized on " VantageMark
FREE
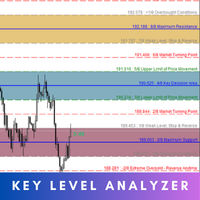
Key Level Analyzer – Know Better, Trade Smarter Key Level Analyzer is a powerful trading tool designed to provide precise market insights by identifying high-probability price zones , market turning points , and key decision areas . Unlike traditional indicators, it uses a smart algorithm to dynamically calculate support, resistance, and balance zones, helping traders make informed, data-driven decisions . MT5 Version - https://www.mql5.com/en/market/product/132810/ With real-time updates, mul

A simple indicator that automatically highlights all FVGs (Fair Value Gaps) formed on the chart, as well as FVGs on history. It is possible to select colors for FVGs of different directions (long or short), select the time interval, select the color of middle point and you can also choose whether to delete filled FVGs or leave them on the chart (the option is beneficial for backtesting). The indicator can be very useful for those, who trade according to the concept of smart money, ICT, or simply
FREE
SURE REVERSAL은 히스토그램 과매수/과매도 유형의 지표로, 강세장 또는 약세장 움직임을 나타내는 주요 반전 지점을 제공합니다 , 이 지표는 이동평균선과 RSI 지표의 융합이며, 비재도장 지표이며, 지연되지 않습니다. 매개변수 : Ma 주기 Ma 방법 Ma 가격 확실한 기간(Rsi) 확정값(Rsi) ============== -----------------------------------------------------------------------------------------------------------------------------------------------------------------------

표시기는 현재 기호에 이익(손실)을 표시합니다. 라인을 자유롭게 드래그 앤 드롭하여 현재 손익을 표시할 수 있습니다.
You can find my products here
매개변수 Calculation in money or in points — 포인트나 돈으로 이익/손실을 계산합니다. Add pending orders to calculate — 계산 시 지정가 주문을 고려하세요. Magic Number (0 - all orders on symbol) — 기호의 모든 주문) — 특정 주문을 평가하는 데 필요한 경우 매직 넘버입니다. Offset for first drawing (points from the average price) — 첫 번째 시작 시 평균 가격의 라인 오프셋입니다. Decimal places for calculating the Sum — 합계를 표시하기 위한 소수점 뒤의 자릿수입니다. Decimal places for calculating the Perc
FREE

2 copies left at $65, next price is $120
Scalper System is a user-friendly indicator designed to detect market consolidation zones and anticipate breakout movements. Optimized for the M1 or M15 timeframe, it performs best on highly volatile assets like gold (XAUUSD). Although originally designed for the M1 or M15 timeframe, this system performs well across all timeframes thanks to its robust, price action-based strategy.
You can visually backtest the indicator to evaluate the accuracy of its si

BUY INDICATOR AND GET EA FOR FREE AS A BONUS + SOME OTHER GIFTS! ITALO LEVELS INDICATOR is the best levels indicator ever created, and why is that? Using high volume zones on the market and Fibonacci the Indicator works on all time-frames and assets, indicator built after 7 years of experience on forex and many other markets. You know many levels indicators around the internet are not complete, does not help, and it's difficult to trade, but the Italo Levels Indicator is different , the Ital

BUY INDICATOR AND GET EA FOR FREE AS A BONUS + SOME OTHER GIFTS! ITALO TREND INDICATOR is the best trend indicator on the market, the Indicator works on all time-frames and assets, indicator built after 7 years of experience on forex and many other markets. You know many trend indicators around the internet are not complete, does not help, and it's difficult to trade, but the Italo Trend Indicator is different , the Italo Trend Indicator shows the signal to buy or sell, to confirm the signal t

Description Helps you detect the structure of the market, using different types of Smart Money concepts. This should help you to upgrade your trading strategy in every way. MT5 Version Here Smart Money Features: Color candle to signal the type of structure Shows CHOCH and BOS Equal Lows and Highs Order Blocks Internal and Swings Weak and strongs high and lows Fair Value Gaps High and Lows in daily weekly and monthly timeframes Premium and discount Zones KEY LINKS: How to Install – Frequent
FREE
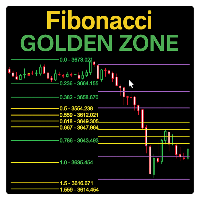
Fibonacci Sessions 지표는 정밀한 스캘핑 및 단기 전략을 위해 설계된 강력한 트레이딩 도구입니다. 뉴욕, 런던, 아시아 세션의 주요 피보나치 레벨を 자동으로 표시하여 트레이더들에게 주요 시장 세션에서의 가격 움직임을 명확하게 보여줍니다. 각 세션에서는 가격 반응이 가장 많은 고유한 "골든 존"이 강조됩니다. 이를 통해 되돌림, 돌파, 추세 지속 전략을 위한 매우 신뢰할 수 있는 영역이 생성됩니다. 이 지표는 가격이 한 골든 존에서 다른 골든 존으로 자주 이동하는 모습을 시각적으로 보여주며, 트레이더가 일관된 기회를 포착하도록 돕습니다. XAUUSD M5 시간 프레임에 최적화되어 있으며, 다른 외환쌍 및 글로벌 지수에서도 뛰어난 성능을 발휘합니다. 금, 통화쌍 또는 지수를 거래하든, 이 세션 기반 피보나치 맵핑은 높은 확률의 거래 구역을 식별하는 데 추가적인 이점을 제공합니다. 빨간 선: 극한 이익 목표 수준. 노란 선: 골든 존 (고확률 반응 영역).
FREE

First time on MetaTrader, introducing IQ Star Lines - an original Vedic Astrology based indicator. "Millionaires don't use astrology, billionaires do" . - J.P. Morgan, Legendary American financier and banker.
IQ Star Lines, an unique astrological indicator purely based on Vedic astrology calculations, published for the first time on Metatrader. This unique tool plots dynamic planetary grid lines based on real-time stars, constellations, and celestial movements, which allows you to plot t

Huge 70% Halloween Sale for 24 hours only!
After purchase, please contact me to get your trading tips + more information for a great bonus!
Lux Trend is a professional strategy based on using Higher Highs and Lower Highs to identify and draw Trendline Breakouts! Lux Trend utilizes two Moving Averages to confirm the overall trend direction before scanning the market for high-quality breakout opportunities, ensuring more accurate and reliable trade signals. This is a proven trading system u
READ THE DESCRIPTION ITS IMPORTANT - ONLY TAKES 2 MINUTES - THIS IS A TOOL NOT A TRADING STRATEGY
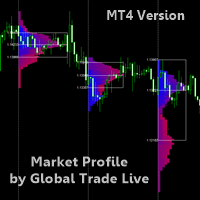
Market Profile By Global Trade Live A Market Profile is a graphical representation that combines price and time information in the form of a distribution. A Market Profile is used to determine elapsed time, number of ticks and volumes traded at specific prices, or over a price interval, over a given period. A Market Profile also makes it possible to identify prices accepted or rejected by the mark
FREE
특별 할인 : ALL TOOLS , 개당 $35 . 신규 도구 는 $30 첫 주 또는 처음 3회 구매 에 한해 제공됩니다! Trading Tools Channel on MQL5 : 최신 소식을 받으려면 제 MQL5 채널에 참여하세요 Specter Trend Cloud 는 이동평균 기반의 추세 시각화 도구로, 시장 방향과 핵심 재테스트 기회를 강조합니다. 적응형 평균과 변동성 보정을 결합하여, 추세 변화에 따라 반전되는 컬러 “클라우드”를 생성하고 진행 중인 추세에서 가격이 단기 평균과 어떻게 상호작용하는지 추적합니다.
MT5 버전 더보기: Specter Trend Cloud MT5 Scanner MT4 버전 더보기: Specter Trend Cloud MT4 Scanner 더 많은 제품 보기: All P roducts Key Features 멀티 MA 코어 엔진
SMA, EMA, SMMA (RMA), WMA, VWMA 선택 가능. 사용자 정의 길이의

TopBottom Checker 는 가격의 바닥과 상단을 결정하는 지표입니다. 표시기는 모든 통화 쌍과 함께 사용할 수 있습니다. 표시기는 M1에서 D1까지의 모든 시간 프레임에서 작동합니다. 이 지표는 절대적으로 모든 전략에 매우 중요한 시장 측면과 함께 작동하므로 지표는 독립형 거래 시스템으로 또는 사용하는 거래 시스템의 일부로 사용할 수 있습니다. 지표 신호는 추세와 함께 진입하거나 추세에 반대하여 반전으로, 그리고 열린 포지션의 폐쇄 가능성, 즉 시장을 종료할 가능성을 나타내는 데 모두 사용할 수 있습니다. 표시기는 사용하기가 매우 쉽습니다. 차트에 지표를 추가하고 필요에 따라 해당 신호를 따르기만 하면 됩니다. 이 도구는 외환 거래 및 바이너리 옵션 거래에 사용할 수 있습니다. 기본적으로 지표는 가격 반전을 예측하기 위해 분석이 수행되어 그러한 조건 형성의 가장 빠른 징후를 찾으려고 시도하기 때문에 신호를 약간 다시 그릴 수 있습니다. 다시 그리기는 사소하지만 가능합니다.

Read detailed blogpost with screenshots here: https://www.mql5.com/en/blogs/post/764306 Note: This is the MT4 only version. Get the MT5 version here: https://www.mql5.com/en/market/product/150789
Features Kalman smoothing to reduce market noise. Supertrend bands for trend direction. Color-coded dots and arrows for quick reading. Arrow signals for trend continuation. Custom Timeframe for drawing bands Alerts for trend changes. Adjustable inputs for different styles.
How to Use
Green dots = bul

Scalping Edge Pro Indicator Unleash the Power of Precision Trading: Introducing Scalping Edge Pro Tired of market noise and conflicting signals that cloud your judgment? Are you searching for a tool that delivers the clarity and confidence needed to seize rapid opportunities in volatile markets? Scalping Edge Pro is the engineered solution designed for traders who demand precision and professionalism in every trade. It is meticulously calibrated for peak performance on the 15-minute (M15) timef
FREE

Индикатор строит блоки заказов (БЗ) по торговой системе (ТС) Романа. Поиск блоков осуществляется одновременно на двух таймфремах: текущем и старшем (определяемым в настройках). Для оптимизации и игнорирования устаревших блоков в настройках задается ограничение количества дней в пределах которых осуществляется поиск блоков. Блоки строятся по правилам ТС состоящем из трех шагов: какую свечу вынесли (что?); какой свечой вынесли (чем?); правило отрисовки (как?).
FREE

Scalper Arrow x is a buy sell arrow type indicator, the strategy behind its signals is based on the MFI indicator with trend filter using Halftrend formula, this indicator can be used alone or mixed with other tools. NOTE : THIS INDICATOR DOESN'T REPAINT OR BACK PAINT, AND ITS ARROW SIGNALS ARE NOT DELAYED. ---------------------------------------------------------------
FREE

Currency Strength Gauge incicator
The currency strength gauge is an indicator to measure of the strength or weakness of currencies in the Forex market. Comparing the strength of currencies in a graphic representation will lead to a good overview of the market and its future trends. You will see in a graphic chart both the strength of the currencies and their correlation, and this will help you in your decisions to get better trades. -To easy detection of over Overbought and Oversold points,
The indicator highlights the value in "over Sold" and "over Bought" zones. in addition, arrow indicates the return of the value from the extreme zone. Indicator can be easily customized by the user including change of colors, with, levels and arrows. Combination with other market signals and analysis is necessary and provides more stable results. Alert is also available for user.
FREE

Title: Price Action Pro - Advanced Multi-Timeframe Reversal Scanner "Experience the full power of 'Price Action Pro' completely on EURUSD!" Product Overview: Price Action Pro is not just another candlestick pattern indicator. It is a complete trading system designed to detect high-probability reversal setups. Unlike standard indicators that spam signals on every pattern, Price Action Pro uses a Smart Swing Filter to ensure patterns are only detected at valid swing highs or lows. Combined with Mu
FREE

또는 M oving verage S upport를 R의 esistance 밴드.
MASR 밴드 표시기는 지지 및 저항 수준으로 함께 작동하는 두 밴드로 둘러싸인 이동 평균입니다. 통계적으로 MASR 밴드는 시간의 93%에 가격 캔들을 포함합니다. 단계별로 계산하는 방법은 다음과 같습니다. 1. 첫 번째 단계는 X 기간 동안 최고 고가(HHV)와 최저 저가(LLV)를 계산하는 것입니다.
2. 두 번째 단계는 HHV를 LLV로 나누어 그들 사이의 거리가 얼마나 넓은지 백분율로 구하는 것입니다. 나는 이 단계의 결과를 MASR Filter라고 부른다.
3. MASR 필터 = 합계((HHV / LLV)-1) / 막대 수
4. 나는 이동 평균 저항의 지름길인 상위 밴드를 MAR이라고 부릅니다. 저는 이동 평균 지원의 지름길인 하단 밴드 MAS라고 부릅니다. 밴드 사이의 이동 평균을 중앙선이라고 합니다.
5. MAR = MASR 센터 + (75% x MASR 필터 x MASR 센터
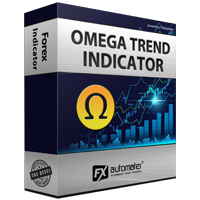
The Omega Trend Indicator is an advanced tool that has been specifically designed to detect market trends early, and follow them efficiently. The indicator draws two lines. The main (thicker) Trend Line represents the presumed lower or upper volatility limits of the current market trend. A break in the main Trend Line indicates a potential reversal or shift in the movement of the trend. The Trend Line also indicates the best point to place a stop loss order. In Omega Trend Indicator, the Trend L
FREE
트레이딩 전략과 기술 지표를 판매하기에 가장 좋은 장소가 왜 MetaTrader 마켓인지 알고 계십니까? 광고나 소프트웨어 보호가 필요 없고, 지불 문제도 없습니다. 모든 것이 MetaTrader 마켓에서 제공됩니다.
트레이딩 기회를 놓치고 있어요:
- 무료 트레이딩 앱
- 복사용 8,000 이상의 시그널
- 금융 시장 개척을 위한 경제 뉴스
등록
로그인
계정이 없으시면, 가입하십시오
MQL5.com 웹사이트에 로그인을 하기 위해 쿠키를 허용하십시오.
브라우저에서 필요한 설정을 활성화하시지 않으면, 로그인할 수 없습니다.