MetaTrader 4용 기술 지표 - 113
Become a constantly profitable 5-star forex trader!
We offer a few indicators to support you understand and analyse the market! With our strategies you will improve your trading system and bacome an expert...
We have indicators for trend direction, market direction and others.. for multi-time frames and that covers all majors or your favorite trading symbols! Some of them offer a customizable calculation parameters... or Graph features!
See how powerful they are! The are also easy-to-use tr
Become a constantly profitable 5-star forex trader!
We offer a few indicators to support you understand and analyse the market! With our strategies you will improve your trading system and bacome an expert...
We have indicators for trend direction, market direction and others.. for multi-time frames and that covers all majors or your favorite trading symbols! Some of them offer a customizable calculation parameters... or Graph features!
See how powerful they are! The are also easy-to-use t
Become a constantly profitable 5-star forex trader!
We offer a few indicators to support you understand and analyse the market! With our strategies you will improve your trading system and bacome an expert...
We have indicators for trend direction, market direction and others.. for multi-time frames and that covers all majors or your favorite trading symbols! Some of them offer a customizable calculation parameters... or Graph features!
See how powerful they are! The are also easy-to-use tr

세계에는 세 가지 주요 외환 시장이 있습니다.
뉴욕(미국 세션), 런던(유럽 세션) 및 도쿄(아시아 세션).
Forex 시장을 거래하기 가장 좋은 시기는 주요 거래 시장이 겹칠 때입니다. 일반적으로 대부분의 거래자는 이러한 거래 세션에 참여하므로 유동성이 높아지고 투자자가 거래하는 통화 쌍 간의 차이가 줄어듭니다. 이 기간을 선택하십시오. 무역을 하고 돈을 버는 것이 더 쉽습니다.
시장이 겹치는 시점을 알 수 있는 지표를 개발했습니다.
내 지표를 통해 일부 거래 비밀을 발견할 수 있습니다.
내 지표는 수익성이 있다고 생각하는 지표와 쌍을 이룰 수 있으므로 수익성 있는 거래를 쉽게 할 수 있습니다.
질문이 있으면 저에게 연락하십시오. 내 제품이 좋다고 생각한다면 긍정적인 평가를 할 수 있습니다.
내 지표는 매우 간단합니다.
1. 기본 매개변수는 GMT+3입니다. 플랫폼에 따라 시간을 조정할 수 있습니다.
2. 총 4개의 기간(뉴욕(미국 시간), 런던(유럽 시간),

The Awesome Oscillator (AO) is one of the most popular indicators that are used to measure momentum in the stock and commodity markets. It was developed by Bill Williams, a famous charting enthusiast and technical analyst who approached the markets on a psychological level. In this article, we will detail the calculations used to compile the Awesome Oscillator to then move on to applying the indicator in practice. We are also going to look at how the AO is different from other oscillators, as we
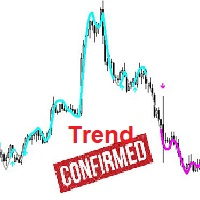
Introducing the Trend Confirmation Indicator: Your Gateway to Confident Forex Trading.
The Trend Confirmation Indicator is a powerful MetaTrader 4 tool meticulously designed to simplify trend identification and streamline entry point selection in the forex market. Built upon customized Moving Average principles, this intuitive indicator offers traders an unparalleled advantage in navigating currency trading with precision and confidence.
Key Features: 1. Customized Moving Average: The Trend Co

This indicator gives entry signals in trend direction and also trend direction there is tow mode of signals for tow type of trading 1 - swing trading 2- scalping On scalping mode signals have small stop loss and big R/R On swing mode can be waited more for TP or SL . Non-Repaint Indicator suitable for all currency and all time frame Detect UpTrend , DownTrend and SideTrend (Possibility of Changing Trend) There is tow mode for signals (Scalp Mode , Swing Mode) Pop up alert , email , Push not

레머 평균은 창 함수로 간주할 수 있으며 가중치 계수는 계산에 사용된 변수의 값에 따라 다릅니다. 이 평균은 계산에 지수가 사용되기 때문에 비선형입니다. 표시기의 특성은 두 가지 매개변수에 따라 다릅니다. iPeriod - 표시기 기간, 유효한 값은 2 이상입니다. iPower - 지표 값을 계산할 때 사용되는 지수. 유효한 범위는 -32768 ~ 32767입니다.
iPower = 0이면 조화 평균을 얻습니다. iPower = 1 - 산술 평균, iPower = 2의 경우 역고조파 평균입니다. 지수가 크면 Lehmer 평균이 시계열의 최대 경계를 강조 표시합니다. 그리고 음수 지수를 사용하면 최소값이 강조됩니다. 이 속성으로 인해 Lehmer 평균은 시계열을 평활화하고 채널을 구성하는 데 모두 사용할 수 있습니다.
첫 번째 그림은 지수가 +500 및 -500인 종가를 사용하여 계산된 채널을 보여줍니다. 두 번째 그림은 iPower = +1000 및 -1000인 동일한 채널을 보

This indicator is a powerful assistant that shows bullish/bearish zones on the chart and the candlestick patterns that happen on any timeframe. It shows zones based on changes in price and 25 defined patterns which are shown as bullish or bearish on the chart after close of the candle, so there is no repaint. Also, you can select other timeframes in order to see the patterns happening on them. Patterns There are 25 defined patterns in this indicator. Eight patterns can be bullish or bearish, 8 p

its not just an Indicator. its a trading system I'm working on for 3 years and also would be updated you don't need any thing else to trade because its a price action indicator that shows all static and dynamic support and resistance this indicator contains 7 lines that gives us dynamic static support and resistance also when main lines (white ones) become flat for 26-52 periods they show strong levels. you can find consolidating areas, strong downtrend(in Green channel) and strong uptrend(in
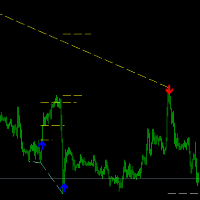
Stock! Now there is a special price for the first 10 buyers. Hurry up. Divergence HiLo is an indicator that identifies highs and lows prices (High end Low) . Based on a special algorithm, the indicator determines the value of divergence or convergence. In addition to divergence or convergence values, the indicator determines the expected take levels profit. The price chart shows divergence lines, possible profit levels and arrows that indicate the formed signal of the indicator in buy or sell.

Full automatic. Does not require technical settings.
Works on all currency pairs. The indicator has a built-in zigzag filter that limits repetitions of unidirectional signals (i.e. after a buy signal, the next one will be a sell signal, and vice versa).
For the convenience of displaying, the indicator provides settings for the type of icons, their color and size: Size Arrow Code Arrow Buy Color Arrow Buy Code Arrow Sell Color Arrow Sell Indicator signals are not redrawn.
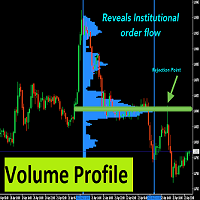
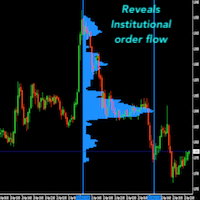
With Fixed Range Volume Profile,The traces left by the big players will not go unnoticed by you.
Professional Volume Profile Indicator reveals Institutional order flow. This advanced market indicator will teach you to spot the buying and selling. Dont want to say more because its well known by most professionals trader. This Indicator : - Quickly Identify the Strongest Institutional S/R Zones. - W orks with all Trading Instruments (Forex, Futures, Indexes, Commodities, Stocks, Cryptocur

Ease of movement is a momentum indicator that demonstrates the relationship between the rate of change in an asset’s price and its volume. It is intended for the daily chart and larger timeframes. As its name implies, the larger the magnitude of the indicator – the “easier” the movement in price – the more robust the trend is believed to be. A larger positive value indicates price moving upward on disproportionately low volume. Conversely, a larger negative value indicates price moving downward

KT Higher High Lower Low은 가격의 스윙 포인트를 식별하고 해당 지지 및 저항 수준을 표시하여 보다 효율적인 시장 분석을 돕습니다. Higher High: 이전 고점을 초과하여 형성된 새로운 고점으로, 일반적으로 강한 상승 추세를 나타내며 매수세가 우세한 시장 상황을 반영합니다. Lower High: 이전 고점보다 낮은 고점으로, 하락 추세가 형성되거나 조정 단계에 진입했음을 시사할 수 있습니다. Lower Low: 이전 저점을 초과하여 형성된 새로운 저점으로, 하락 추세가 지속될 가능성이 높아지는 상황에서 주로 발생합니다. Higher Low: 이전 저점보다 높은 저점으로, 상승세가 유지되거나 새로운 상승 추세가 시작될 가능성을 나타냅니다.
기능 좌우 바의 개수를 조정하여 스윙 포인트의 강도를 설정할 수 있어 보다 유연한 분석이 가능합니다. 새로운 HH, LH, LL, HL이 발생하면 즉시 알림을 제공하여 트레이더가 실시간으로 시장 변화를 감지할 수 있도록

Def ault settings are just for visu alis ation, it c an not be profit able with it.
Get a Free EA as a Bonus when you Purchase the Indicator! Plus, Receive 4 Interesting Additional Indicators. Recommended set files for backtesting the indicator on recommended pairs are available in the comments section (last page). Please note that this product is exclusively sold on the MQL5 market. Any other sources offering it are scams, and the author bears no responsibility. To receive the bonus gifts,

Reversal Point Detector (RPD) is an advanced indicator that is obtained from a combination of advanced mathematical functions, especially price action, which is able to detect price reversal points, or in other words, invisible market supports or resistances without the use of any tools.
This indicator can identify the appropriate trading opportunities on its own and each person can trade by setting the appropriate SL and TP according to their trading strategy and risk management.
This advance

모두를 위한 지표 Pip Scalper는 스캘핑 트렌드입니다. 이 표시기로 추세를 더 오래 유지하십시오. 모든 시간 프레임과 자산에서 작동합니다. 이 도구로 매일 핍을 얻으십시오. 200 이동 평균을 사용하여 거래를 필터링하십시오. 더 짧은 기간을 권장합니다. 데이 트레이딩에 사용합니다.
정보 및 사용 방법:
Pips Scalper는 장기 추세 거래를 기반으로 합니다. 파란색으로 구매 레드에 판매 200 이동 평균을 필터로 사용하고 활성 기간 동안 거래하십시오. Pip Scalper는 스캘핑 트렌드입니다. 이 표시기로 추세를 더 오래 유지하십시오. 모든 시간 프레임과 자산에서 작동합니다. 이 도구로 매일 핍을 얻으십시오. 200 이동 평균을 사용하여 거래를 필터링하십시오. 더 짧은 기간을 권장합니다. 데이 트레이딩에 사용합니다.
정보 및 사용 방법:
Pips Scalper는 장기 추세 거래를 기반으로 합니다. 파란색으로 구매 레드에 판매 200 이동 평균을 필터로 사

Description of ZiqScalping The ZiqScalping indicator is designed to trade both currencies with high volatility and trend-oriented currencies.
Recommended time frame for scalping: М5, М15, М30.
Recommended timeframe for intraday trading and above: H1, D1.
Works on all pairs!
Settings : See screenshots.
Decision principle!
The indicator is based on 2MA, MACDI,OSMA. Arrows with trend directions and 2MA lines are shown graphically.
Calculations of volumes by positions are entered into the fo

PullbackMatrix provides the key information of the trading transactions when it finds the right market moment based on its built-in logic algorithm. The high accuracy signals including Trading Symbol, Entry Price, Entry Time, TakeProfit, Stoploss, and more. And that's all will be available instantly in your chart panel, drawing the position lines and also sending signal notification to email, mobile phone, and screen popup. More important is that also saves signals into a .csv file which is usef
Trade with super Support and Resistance Breakout system.
are you looking for the most sophisticated tools for your daily trading ? this tools are perfect for you, it has a most comprehensive breakout identification spot on all market (Forex, CFD, indice, etc)
Limited offer : 10 copy for 30$
Indicator parameter: Depth: to arrange how deep to calculates the support and resistance zone Deviation Back-step
the demonstration result you can see on the media file below.
This is a key indicator and guideline for institutions and pension plans that look to take large positions and need to know whether they are getting in at a good price or not. It also allows them to get into positions without disrupting the market or elevating prices unnaturally with their large orders, resulting in unfavorable entry prices for them. The VWAP is a major level of importance that a lot of big traders and institutions monitor and is why you should be paying attention to it too. Ba
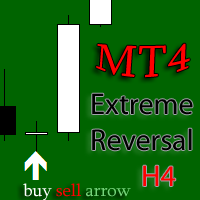
Версия индикатора под Meta Trader 4 ! Этот стрелочный индикатор ищет возможные развороты рынка и коррекционные движения на таймфреймах H4 и D1 . Основан на закономерностях рынка FOREX, точных определениях текущего экстремума и нахождения свечных моделей на вершинах/низах рынка. Универсальный алгоритм помогает определить точки разворота указывая стрелками где осуществить вход в рынок. Настройка индикатора очень проста! Переместите на график выбранной валютной пары и следите за появлением сигн

Heiken Ashi candle chart is an improved version of The Japanese candle chart, which can effectively filter the market "noise" of the Japanese candle chart. It is favored by many traders for its simplicity and intuition. For trend traders, the HA candle chart is a magic tool. Unlike the traditional Japanese candle chart, Heikenashi does not reflect the opening price, high price, low price and closing price of the market. Instead, Heikenashi calculates the value of a single K line in the dominant

Trade Assistant MetaTrader indicator — a multi-timeframe indicator that is based on three standard indicators: Stochastic oscillator , RSI (Relative Strength Index), and CCI (Commodity Channel Index). It displays current trend directions for M1, M5, M15, M30, H1, H4, D1, W1, and MN1 timeframes. When you follow such an indicator you have a clear picture of the trends across all important timeframes. It doesn't matter which timeframe you attach this indicator to. The indicator can be d

Watch how indicator works here; https://www.youtube.com/watch?v=3rfwzWgU6Rk CURRENTLY 50% OFF !! will only be available for first 10 DROP A COMMENT WHEN YOU PURCHASE THE INDICATOR SO I CAN ADD YOU TO THE TELGRAM GROUP Best Solution for any Newbie or Expert Trader! This indicator have been made affordable and easy to interact with, it is precise and direct to use. IT IS NONE REPAINT INDICATOR THAT CAN SEND NOTIFICATION TO YOUR PHONE
PLEASE IF YOU PURCHASE THIS INDICATOR YOU WILL BE ADDED TO A TE
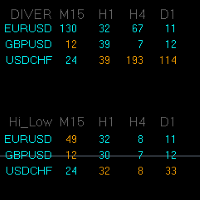
The logical continuation of the divergence indicator is the Divergence HiLo Dashboard indicator - a divergence scanner immediately for three currency pairs. In the indicator menu, select which currency pairs we will analyze. The analysis is carried out on the timeframes M15, H1, H4, D1. In addition to divergences, tops and bottoms are analyzed. All data is entered into tables Alerts are provided in the indicator. According to the logic of the indicator, the signal appears after the end of 3 bars

Supertrend indicator uses a combination of a moving average and average true range to detect the trend of a trading instrument.
Supertrend indicator for MetaTrader 5 easily shows the trend as a line following the price.
USAGE THIS INDICATOR If the closing prices are above Supertrend Line, there is a Bullish sentiment at that moment. The opposite is a Bearish sentiment. Three green lines - Strong Bullish sentiment. Three red lines - Bearish sentiment.
For BUY : - Three green lines and price

Market Heartbeat in your hand! *** Contact me to send you " Trend Finder indicator " free and add you in "Market Heartbeats group" for sharing or seeing experiences with other users. Introduction The Market Heartbeat indicator with a special enhanced algorithm (volume, money flow, cycle of market and a secret value) is a very repetitive trend finder with a high success rate . Interestingly, this Winner indicator indicates that the trend has changed its direction or the end of a trend retracem

[ MT5 Version ] Bulls and Bears Power Bulls and Bears Power is an indicator that clearly highlights if bulls or bears are currently in control of the market. A price movement started with high Bulls control in the market can indicate the beginning of a new trend movement. The relative indicator power between price peaks also indicates if the movement is losing strength and might foresee a significant correction or a trend reversal. Bulls and Bears Power indicator offers a clear and simplified vi

Non-repaint indicator to identify trade opportunities in swing action as prices move within an upper and lower band. Inspired by the Keltner Channel, the most popular channel Indicator introduced by Chester Keltner. It is different with a Bollinger Bands. It represents volatility using the high and low prices, while Bollinger's studies rely on the standard deviation. Customized by adding the trends exactly in the middle line, arrows when price cross over the outer lines and Fibonacci Levels L

Would you like to learn a technical system refined by centuries of use, but virtually unknown here? A system so versatile that it can be fused with any other indicator/technical tool? A system as pleasurable to use as it is powerful? If so, this indicator which scans candlestick charting techniques is for you. You should find it valuable no matter what your background in technical analysis. This trading system has been designed after years of hard work and back testing. Indicator will find stro
Данный помощник в торговле основан на индикаторе Force Index, хороший осцилятор для скальпинга в периоде H1, входы в сделки указаны стрелками, выходы соответственно можете определять самостоятельно, к примеру можете воспользоваться стандартным индикатором Stochastic. Данный индикатор работает только в периоде H1! В настройках при желании можете изменить цвета и период. На основе этого индикатора пишется робот, желающему пишите в лс.
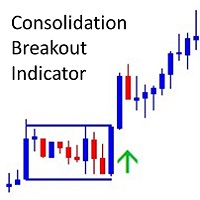
The Consolidation Breakout Alerts Indicator will revolutionize your trading strategy. Our innovative indicator offers unique buy and sell arrows when price breaks out from consolidation, allowing you to get in at the most optimal entry with minimal risk and maximum reward potential. Never again will you miss out on the lucrative trading opportunities available in volatile markets. Let the Consolidation Breakout Alerts Indicator do the work for you and reap the rewards!
Buy and Sell Arrows whe

이 표시기는 이산 Hartley 변환을 기반으로 합니다. 이 변환을 사용하면 재무 시계열을 처리할 때 다양한 접근 방식을 적용할 수 있습니다. 이 지표의 특징은 판독값이 차트의 한 지점이 아니라 지표 기간의 모든 지점을 참조한다는 것입니다. 시계열을 처리할 때 표시기를 사용하여 시계열의 다양한 요소를 선택할 수 있습니다. 필터링의 첫 번째 가능성은 이 접근 방식을 기반으로 합니다. 불필요한 모든 고주파수 구성 요소는 단순히 폐기됩니다. 첫 번째 그림은 이 방법의 가능성을 보여줍니다. CutOff 매개변수를 선택하면 원래 시계열의 세부 정보를 선택할 수 있습니다(빨간색 선 - 주요 정보만 남음 CutOff = 0, 노란색 - 주요 및 가장 낮은 주파수 기간 CutOff = 1 , 파란색 - 가장 높은 주파수의 모든 노이즈가 삭제됩니다. CutOff = 4 ). 그러나 이것이 유일한 가능성은 아닙니다. 추가 필터링으로 노이즈 성분을 억제할 수 있습니다. 두 옵션 모두 이 표시기에 구현
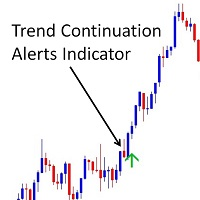
!! FLASH SALE !! Over 80% off !! Now only $47 - normally $297!
Buy and sell arrows on the chart when the trend is about to continue. Aslo Sends Alerts – On MT4 To Your Phone To Your Email.
Does not repaint.
Works on any pair, any timeframe. (Just ajust the settings for your pair and timeframe.)
10 Activations allowed so you are free from limitations
See an example of alerts from today (23 May 2020) using this and 2 other indicators here . MT5 version here .
Spreads from 0.1pip RAW/
이 필터는 베셀 다항식을 기반으로 합니다. 주요 장점은 시간 지연이 적다는 것입니다. 이 필터의 또 다른 기능은 금융 시계열의 최신 값에 대한 높은 민감도입니다. 이 때문에 지표는 활성 가격 변동을 강조하는 동시에 노이즈 편차를 완화합니다. 고전적인 변형 외에도 Bessel 계수의 로그가 가중치 함수로 지표에 추가되었습니다. 이 경우 지표가 더 매끄럽게 나타나지만 동시에 가격이 활발하게 움직일 때 지연될 수 있습니다. 베셀 다항식을 계산할 때 계승이 사용됩니다. 이러한 이유로 지표의 기간은 아래에서 위로 제한됩니다. 일반 베셀 필터를 사용할 때는 지표의 작은 주기에 주의하는 것이 좋습니다. 기간이 증가함에 따라 표시기의 동작이 점점 더 안정되고 그 차이가 점점 더 눈에 띄지 않게 되기 때문입니다. 그림은 두 필터 유형의 동작을 보여줍니다. 표시 매개변수: TypeFilter - 일반/대수 필터 유형 선택 iPeriod - 표시 기간, 유효한 값 3 - 85.

[ MT5 Version ] Ultimate Alpha Trend MT4
Ultimate Alpha Trend is the first trend indicator, which combines volatility, volume, average price and momentum. The results is a highly versatile representation of trendy and sideways market conditions, highlighting, at the same time, significant supply and demand levels. The Ultimate Alpha Trend indicator can be used to find entry oportunities and to set SLs taking into consideration current market volatility, volume and momentum. Besides that, the ind
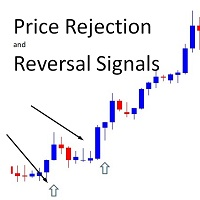
!! FLASH SALE !! Over 80% off !! For ONE week only. Now only $47 - normally $297! >>> Ends on 30 June 2023 - Don't miss it!
Buy And Sell Signal Arrows On The Chart When The Price Is About To Reverse. Also Sends Alerts – On MT4 To Your Phone To Your Email.
Does not repaint.
Works on any pair, any timeframe. (Just ajust the settings for your pair and timeframe.)
10 Activations allowed so you are free from limitations
MT5 version here . Spreads from 0.1pip RAW/ECN Accounts,

Trade any Forex combine out there. Many prop firms offer challenge or instant funding combines. The biggest problem is controlling the loss. With this indicator you can get a visual system that can limit loss and teach discipline. This uses the MACD and the strategy is scalping. You can determine the risk and reward. Visually follow small trends for scalps. Trade during active sessions. It's just a simple system to instill discipline while limiting loss and scalping pips with the paramet

Imbalance / Fair Value Gap (FVG), this is a zone / gap created when the price move with force in a given direction. It identify a zone where the price could potentially go back. This gives perfect targets for your trades.
Imbalance is created from the high and low of 3 candles. When the wicks the of 1st and 3rd candle does not fully overlap the middle one.
This indicator will help you to easily spot mitigated/unmitigated imbalances in your chart.
NEW FEATURE Update: Multi-TimeFrame Feature
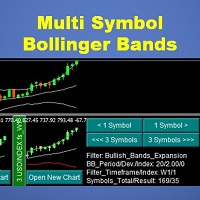
This indicator will display mini candlestick chart with Bollinger Bands indicator of the symbols that pass a filter criteria in the indicator subwindow from 1 to 10 symbols per subwindow. Feature:
Button to scroll 1 symbol, click to scroll the displaying symbols back and forth 1 symbol per click Button to scroll 1 page , click to scroll the displaying symbols back and forth 1 page(number of symbols per subwindow) per click Button to open new chart, click to force mt4 terminal to open a new char

Holy Grail arrow is for scalping. The period you use will determine the trend. You can try different time frames and periods to see what works best for your strategy. Filters can be applied like a moving average or trendlines. The 1 minute works good for scalps and always trade during active periods and avoid consolidation times. Using other indicators to determine trends is recommended but this can also be a free flowing scalping system alone with tp and sl.
Inputs: Period = trend period

The Colored Volume is a simple, yet useful indicator that paints the color of the volume based on the price direction. If the price has increased, the volume will be shown in green. If the price has decreased, the volume will be shown in red. This indicator will make it super easy for traders to track volume bars based on price movements. (The settings of the volume bars including line width and color can be manually changed by the trader.)
MT4に表示している同一通貨ペアのチャート上で、水平線や垂直線、トレンドラインなどのオブジェクトを同期します。 このインジケーターを使うと、1つの時間足で作成した水平線などのオブジェクトが、同一通貨ペアの他のチャートにも同じオブジェクトが作成されるようになります。また、作成後の移動、プロパティ変更、削除なども同期することができます。
チャートオブジェクトが同期されるケース
・チャートオブジェクトの作成 ・チャートオブジェクトのスタイル変更(色、太さなど) ・チャートオブジェクトの移動 ・チャートオブジェクトの削除
対応しているチャートオブジェクト
以下24のオブジェクトに対応しています。 ・水平線
・垂直線
・トレンドライン
・平行チャネル
・フィボナッチリトレースメント
・フィボナッチ・エクスパンション
・フィボナッチ・チャネル
・フィボナッチ・タイムゾーン
・フィボナッチ・ファン
・フィボナッチ・アーク
・角度によるトレンドライン
・アンドリューズ・ピットフォーク
・標準偏差チャネル
・線形回帰チャネル
・サイクルライン
・三角形
・長方形
・楕円
・ギャン・ライン

고급 추세 필터링 및 경고 표시 기능이 있는 MACD 오실레이터. 추세를 결정하고 약한 추세는 걸러지고 추세의 새로운 강점이 표시됩니다. MACD 오실레이터는 모든 시간대와 모든 기호(통화, 지수, 오일, 금속, 주식, 옵션, 오프라인 renko 차트)에서 작동합니다. 1. 사용자는 MACD 값을 변경할 수 있습니다. 2. 최소 MACD 레벨 필터, 3. 나누기 값은 차트에서 추세 변경 표시가 필요한 검정력 비율을 필터링합니다. 4. 버퍼 값에는 추세가 변경된 후 경고 신호를 보내기 위해 추가 Macd 값 이동을 제공하는 추가 필터가 있습니다. 5. 경고 추가 메시지 팝업에 대해 True 또는 False를 선택할 수 있습니다. 이 버전은 모든 차트에서 MACD의 다양한 레벨 확인을 사용하여 추세가 변경되는 거래 진입 신호용입니다. 거래 종료의 경우 사용자는 필요에 따라 거래 종료를 위해 자신의 후행 손절매를 사용할 수 있습니다. 권장되는 차트 기간은 H1, H4, D1 및 renk
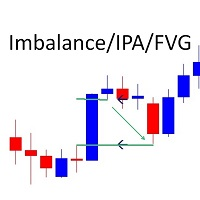
Marks Market Imbalance / Fair Value Gaps / Improper Price Action On The Chart . As traders continue to search for the best trading indicators to guide their investments, the I mbalance / I mproper P rice A ction / F air V alue G ap I ndicator has become increasingly popular. This indicator helps to identify opportunities for taking profit . The indicator begins by scanning the markets for imbalance-improper price action events, allowing traders to immediately see when markets

This indicator is excellent for scalping on the M1 or M5 chart. Uses a special algorithm for the lines. No need to set up the indicator. Does not feature any alerts and is best used manually after visually confirming the line displays. NB: Make sure to download M1 history before testing and use.
How to use: Simply attach to M1 or M5 chart. Zoom chart out completely. Sell when all lines above the white line (PriceLine). Sniper line crosses above white line. Buy when all lines below the white lin
!! FLASH SALE !! Over 80% off !! For ONE week only. Now only $47 - normally $297! >>> Ends on 30 June 2023 - Don't miss it!
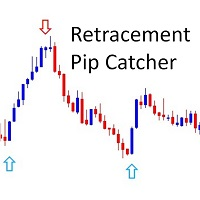
Buy and Sell Arrows when price is about to retrace. It Also Sends Alerts – On MT4 To Your Phone To Your Email
Does not repaint.
Works ony any pair, any timeframe.
10 Activations allowed so you are free from limitations
See an example of alerts from today (23 May 2020) using this and 2 more of my indicators here . MT5 Version here . Spreads from 0.1pip RAW
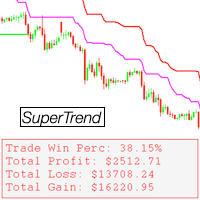
Super Trend Double Pro
- Includes the classic SuperTrend indicator x2 - Includes two indicators for much better market analysis - Comes with various settings - Comes with a display - Displays statistical win/loss information
The "Super Trend Double Pro" indicator provides the ability to combine two of the classic SuperTrend indicators into one, displaying two indicators with different settings on the same chart. The indicator comes with many customizable settings as well as a display which sh

Ready trading system. The indicator arrow shows when and in what direction you need to open an order. At the end of the blue rectangle we put TakeProfit, and at the end of the red rectangle we put StopLoss. The indicator calculates the size of TakeProfit and StopLoss automatically, depending on the market volatility and the probability of price direction. Therefore, the indicator does all the work instead of the trader. He analyzes the market himself, determines the distance for TakeProfit and

This indicator XRX Master indicator.Indicator displays trend movement. Indicator helps to buy and sell. Features FiltPer- displays indicator period.
deviation - displaus indicator deviation.
deviation2 - displaus indicator deviation 2.
HL_period - displaus indicator Highest and Lowest period. HL_period2 - displaus indicator Highest 2 and Lowest 2 period.
How to understand the status: If the trend color arrow is green, trend is up. I f the trend color arrow is red, trend is down.
///////////

The ' Renko Brick Arrows ' indicator was developed to showcase the traditional renko brick grid pricing on chart. An alternative to using an offline chart generator for renko grid prices, and a unique charting style to strategize.
Key Features Renko bricks are drawn over the chart without having to generate a new chart. Optional horizontal lines shows where the next arrows are supposed to appear. Both one and two step reversals are available to draw arrows for buy and sell.
Input Parameters Gr

IMPORTANT; Price is subject to rise at any time from now! Do not miss this offer! Dear trader I am glad to introduce my new tool called Trend Analyser Dashboard to you. The design, style, and settings of this indicator have been made simple to make its users not take too much time in understanding the indicator itself. The purpose is to help traders in analysing the direction of the major trend and the status of the trend whether in weak trend or its strong trend. The indicator will also prov

About Scanner:
Detailed blog post is here: https://www.mql5.com/en/blogs/post/749119
BB Squeeze Scanner uses bbsqueeze.ex4 in background to calculate when BB Squeeze (Bollinger Bands Squeeze) happens and when BBands expand. It is attached with the above blog post.
What is Bollinger Bands Squeeze:
The Bollinger bands squeeze is a special pattern when the volatility of a market decreases after trending periods. It is generally observed the price is ranging during this period until a new t

The "Spread Monitor" indicator allows you to analyze the spread change during the day, control the expansion of the spread by your broker and has a number of interesting additional features Choosing a broker with a minimum spread value is very important for the work of night advisors, scalping and intraday trading.
However, the MT4 terminal does not store spread data, so the multifunctional "Spread Monitor" indicator will be useful for any intraday trader. Features:
The indicator shows the curr
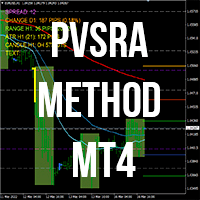
PVSRA 거래 방법. 시스템은 큰 선수가 위치를 얻는 방향을 계산하는 것을 기반으로 합니다.
PVSRA는 P - 가격(가격), V - 거래량(거래량), S - 지지(지지), R - 저항(저항), A - 분석(분석)의 약어입니다.
PVSRA 방법은 라운드 가격 수준(예: 1.2000)과 중간 수준(예: 1.2250, 1.2750)을 사용합니다. 라운드 수준 아래의 연결은 롱 포지션을 위한 준비이며, 수준 위의 연결은 숏 포지션을 위한 준비입니다.
표시기는 다음으로 구성됩니다. 3 이동 평균 - 추세의 방향과 호버의 각도를 나타냅니다. 거래량 - 노란색은 현재 TF의 이전 10개 캔들에 대한 평균 거래량의 150% 이상인 경우를 나타냅니다. 파란색은 거래량이 300% 미만이 되었을 때이며 포지션을 종료하는 것을 고려할 가치가 있습니다. 라운드, 중간 및 피벗 레벨 - 둘 다 사용하거나 둘 중 하나를 비활성화할 수 있습니다. 거래 세션 표시기 - 거래 시간 구성 가능
입

CHART OBJECTS: Blue box : Bullish Order Blocks (OB) Red box : Bearish OB Orange box : Mitigated OB. Price bounce from this area the made a new high/low Light gray box : Price bounced from this area but did not made a new high/low Dark gray box : Broken OB. Filled boxes : TimeFrame 1 Order Blocks
Unfilled boxes : TimeFrame 2 Order Blocks
INDICATOR SETTINGS: Order Block Required Length: Required number of subsequent candles in the same direction to identify Order Block. Default value: 5 Imba

Scalping indicator. Points show the price reversal places on the chart. Not redrawn. Minimum delay. Works on M1, M5, M30, H1, H4 timeframes. You can work on all currency pairs. The indicator can also work on gold, silver and cryptocurrencies. This indicator can also be used for binary options.
How to trade (an example of a strategy for GBPUSD)? When a blue dot appears, buy. When a red dot appears, sell. TakeProfit set to 25 points. StopLoss set 35 points. TrelingStop is set at 15 pips. Benefit
Target Striking - One of the best binary options trading tools!
It is set up so powerfully that you can trade not only on currency pairs, but also on raw gold oil!
You can also try on cryptocurrency!
Ideal for trading on currency pairs, the percentage of reliable transactions is more than + 75%
The trading tool is already set for the best profit!
Only Target Striking can unlock the potential of the trading market for you!
With it, the signals are even and accurate without redrawing, a sig

With this indicator, you will feel complete freedom, you no longer have to look for water in a trade for hours and guess about stop loss and take profit levels. Now everything has become simple. This system is inspired by two popular strategies at the time: the Turtle System and PVRSA. I took the best of both worlds and made this wonderful indicator.
Trading rules: A red bar means increased volume, and you need to look for an opportunity to enter the market If there is a clear signal, an arrow

Improve trading with this indicator. Find areas of buys or sells in Fibonacci retracement areas. Fulltrend is for scalping and making swing trades. Fib levels are added for take profits and stop losses. This works on any time frame and can be used by itself or together with other systems and indicators for filters. The indicator doesn't repaint. Alerts are added and can be true or false. No need to sit glued to the computer, just set on charts and listen or the alerts to come. Take a posi
The Breakeven levels indicator is an indicator that, according to its algorithm of work, determines the number of open orders on a certain instrument finds the level at which all orders go from loss to profit. Separately, for sell and buy orders, the general level of the beginning of profit is found. In the lower left or right corner, information is displayed on three buttons to choose from. When you press the button, a horizontal line of a certain level is displayed on the screen. On the right
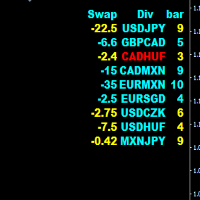
Divergence HiLo scaner is a good tool for market analysis. The indicator looks through all currency pairs and finds those that meet the selection conditions, where corrections or reversals to the main movements are supposed to begin. The indicator values are entered in the final table. 1 value is swap 2 Currency pair. 3 The number of bars after finding the selection conditions. The bar color blue is used for the buy signal. The bar color yellow is used for the sell signal. The color of the

Developed methods for trading collected in one indicator. In the form of arrows, it defines entries in the direction of the trend.
It has 2 types of arrows - trend and signal guides, informing about the potential movement in the direction of the trend.
Works without redrawing, ready for use on all symbols/tools.
The most suitable time frames to use are M15, M30, H1, H4.
How to use
The indicator finds the direction of the trend in the form of a signal arrow, a graphic rectangle stretches along
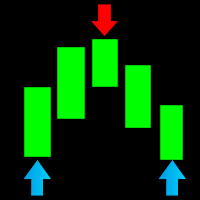
An indicator that shows price reversal points on the chart. Using RSI and other standard indicators, the indicator determines the price reversal points and shows them on the chart with arrows. The indicator does not redraw its values and in 95% of cases it shows accurate signals. This indicator works on all currency pairs and all timeframes.
How to trade with this indicator (recommendations): We recommend opening trades in the direction of the arrow that appears. If a blue arrow appears, ope

Fibonacci retracements are trend lines drawn between two significant points, usually between absolute lows and absolute highs, plotted on a chart. Intersecting horizontal lines are placed at the Fibonacci levels. Fibonacci retracements are useful tools that help traders identify support and resistance levels. With the information gathered, they can place orders, identify stop-loss levels, and set price targets. Although useful, traders often use other indicators to make more accurate assessments

Multi-timeframe signal trend indicator.
Detects the trend direction and is colored in the corresponding color.
It has three different sensitivity options
Can show trend direction on other timeframes
Has embedded audible and visual alerts on trend reversals.
Can send notifications to your phone or email.
Allows trend and counter-trend trading.
Works on all timeframes, all currency pairs, metals, indices and cryptocurrency.
It can be used for binary options.
Distinctive features No re-d
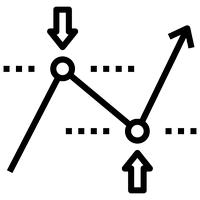
이 표시기는 최적의 이익실현 및 손절매 수준을 표시합니다. 이 수준은 과거 데이터를 기반으로 계산됩니다. 처음 시작할 때 표시기는 기록에 대해 학습됩니다. 그런 다음 그는 가격이 미래에 이 또는 그 수준을 극복할 확률을 평가하고 정지 주문을 하기 위한 가장 최적의 옵션을 선택합니다. 예를 들어 이익을 취하는 값은 이익이 최대이고 가격이 해당 수준에 도달할 확률이 가장 높도록 선택됩니다. 손절매 수준은 최소한이어야 하지만 도달할 확률은 최소한이어야 합니다. 결과적으로 승리에 대한 수학적 기대치가 가장 높은 레벨이 생성됩니다. 또한 이 지표는 지지선과 저항선의 형태로 사용될 수 있습니다. 이를 위해 다양한 예측 길이와 오프셋을 결합할 수 있습니다. 표시 매개변수: 길이 - 예측 길이. 이 매개변수는 향후 막대 거래의 예상 기간을 나타냅니다. Shift - 막대에서 이동합니다. 이 매개변수 덕분에 과거의 표시기 판독값을 볼 수 있습니다. 너비 - 선 너비. ClrBuy - 매수 포지션의
MetaTrader 마켓 - 거래자를 위한 로봇 및 기술 지표는 거래 터미널에서 바로 사용할 수 있습니다.
The MQL5.community 결제 시스템은 MQL5.com 사이트의 모든 등록된 사용자가 MetaTrader 서비스에서 트랜잭션을 수행할 수 있습니다. 여러분께서는 WebMoney, 페이팔, 또는 은행 카드를 통해 자금을 예치하거나 인출하실 수 있습니다.
트레이딩 기회를 놓치고 있어요:
- 무료 트레이딩 앱
- 복사용 8,000 이상의 시그널
- 금융 시장 개척을 위한 경제 뉴스
등록
로그인
계정이 없으시면, 가입하십시오
MQL5.com 웹사이트에 로그인을 하기 위해 쿠키를 허용하십시오.
브라우저에서 필요한 설정을 활성화하시지 않으면, 로그인할 수 없습니다.