Elliott Wave Trend MT4
- 지표
-
Young Ho Seo
 Harmonic Pattern Indicator - Repainting + Japanese Candlestick Pattern Scanner + Automatic Channel + Many more
https://www.mql5.com/en/market/product/4488 - 버전: 11.5
- 업데이트됨: 2 3월 2022
- 활성화: 6
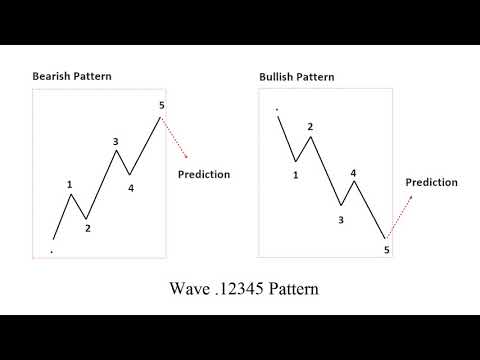
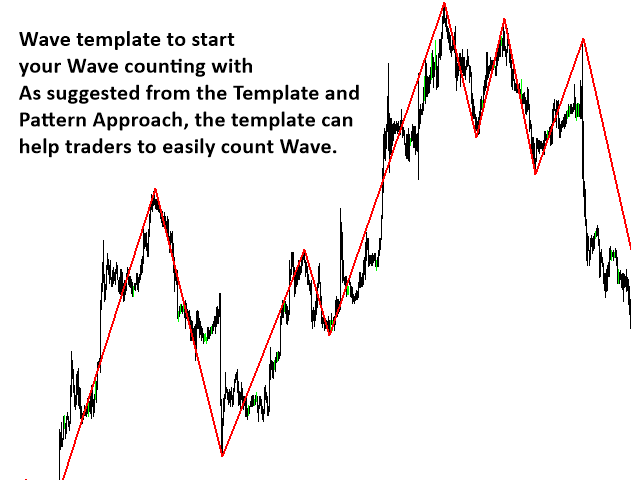
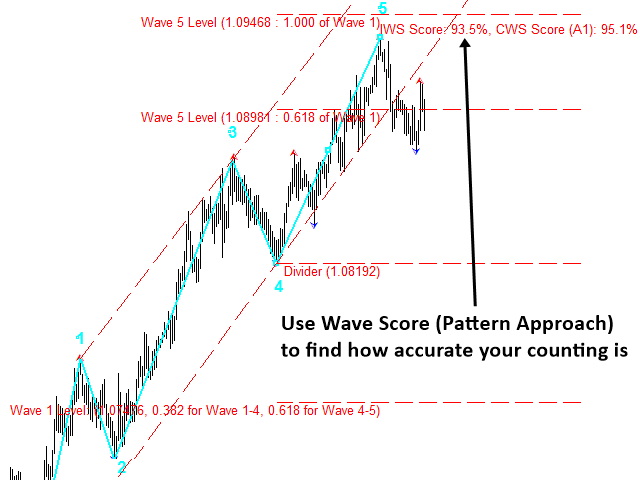
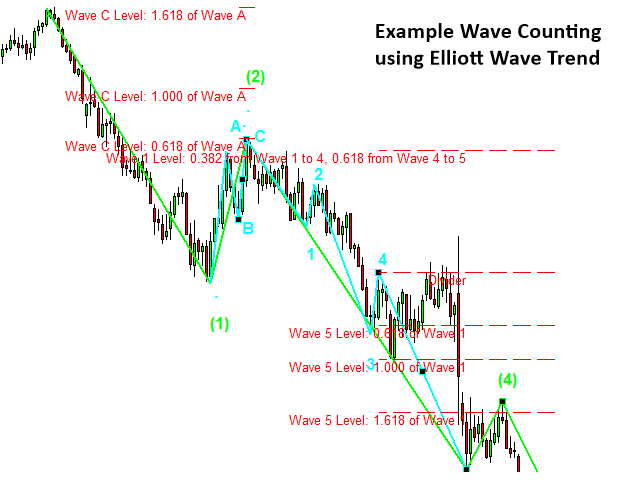
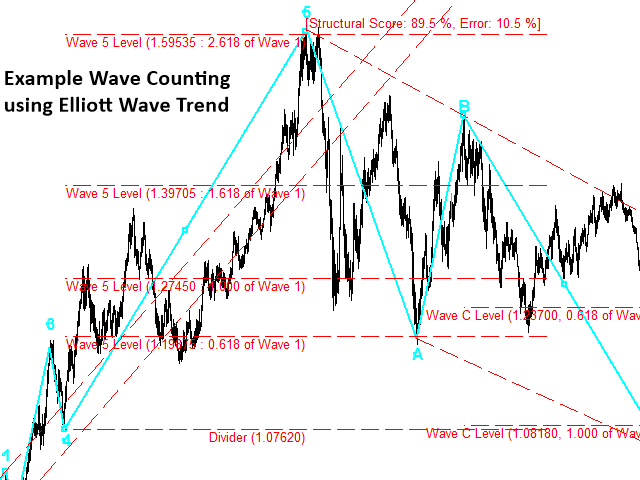
Elliott Wave Trend was designed for the scientific wave counting. This tool focuses to get rid of the vagueness of the classic Elliott Wave Counting using the guideline from the template and pattern approach. In doing so, firstly Elliott Wave Trend offers the template for your wave counting. Secondly, it offers Wave Structural Score to assist to identify accurate wave formation. It offers both impulse wave Structural Score and corrective wave Structure Score. Structural Score is the rating to show how good your Elliott Wave pattern is. 100% means that it is good wave pattern. The score below 80% or negative values means that you might have some mistakes in your analysis. Elliott Wave Trend will correct some obvious mistake in your wave counting if the counting goes against the three Wave rules proposed by Ralph Elliott.
Must Read
Please note that even though there are many automatic features inside Elliott Wave Trend. However, some manual operation is still required for Elliott Wave counting. In addition, you will need some discipline and knowledge in Elliott Wave counting to use this tool.
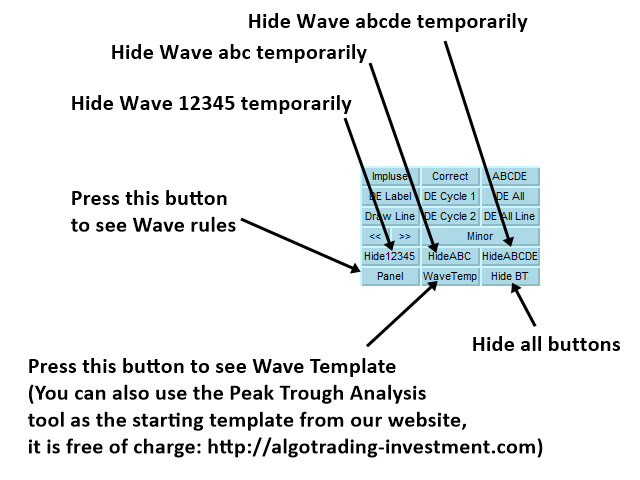
Our Elliott Wave Trend operate mostly with button and mouse clicks.
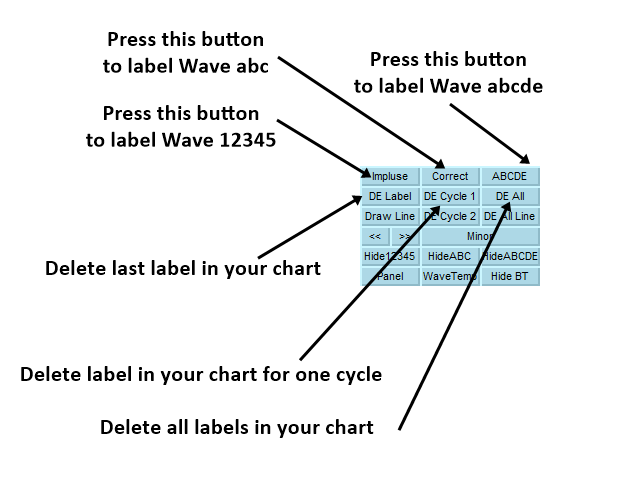
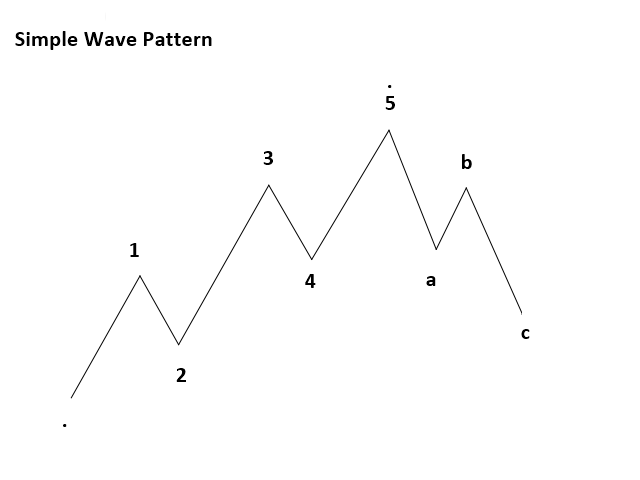
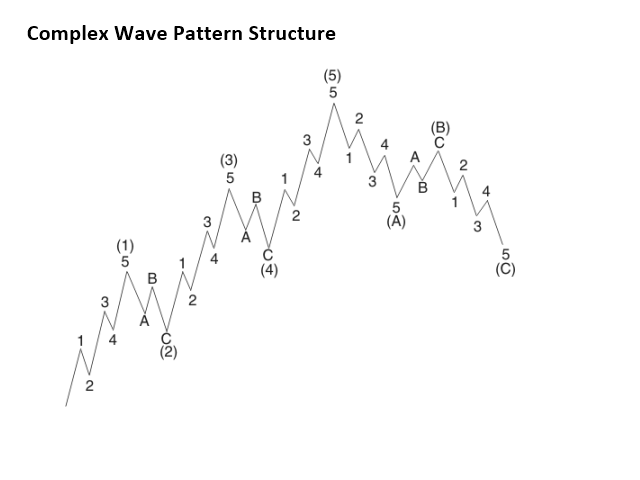
- Impulse: Press this button first to start labeling impulse waves on your chart. When this button is off, you can’t label any impulse wave in your chart. Once this button is pressed, then double click in your chart to label each impulse wave (i.e. wave 1, 2, 3, 4 and 5). When you finish labeling for impulse wave, just release this button again. Note that in your first double click, origin (.) of your wave will be marked. After that, label 1, 2, 3, 4 and 5 will follow.
- Correct: Press this button first to start labelling corrective waves on your chart. When this button is offer, you can’t label any corrective wave in your chart. Once this button is pressed, then double click in your chart to label each corrective wave (i.e. wave A, B and C). When you finish labeling for impulse wave, just release this button again. Note that in your first double click, origin (.) of your wave will be marked. After that, label A, B and C will follow.
- DE Label: DE Label is the short for delete label. When you press this button, the latest label will be deleted from your chart.
- DE Cycle 1: DE Cycle 1 is the short for Delete Cycle 1. When you press this button, all the labels in the current wave cycle will be deleted. While impulse button pressed, pressing DE Cycle 1 will remove all the labels for impulse wave in the current cycle only leaving the labels for corrective wave. While correct button pressed, pressing DE Cycle 1 button will remove all the labels for corrective wave in the current cycle only.
- DE ALL: DE ALL is the short for delete all. When you press this buttons, all the labels will be removed regardless of their cycle.
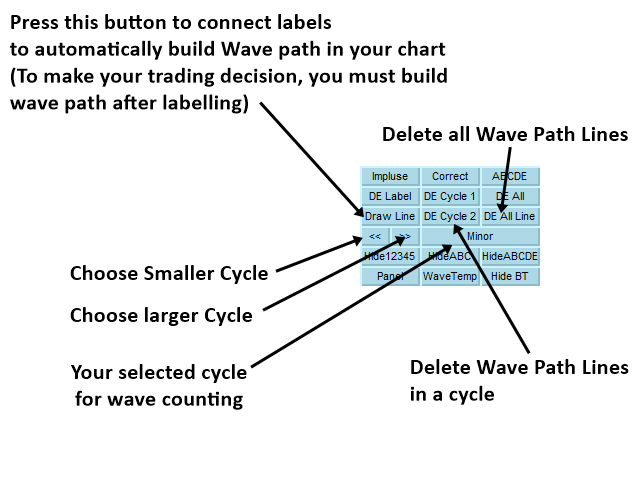
- Draw Line: You should use this button after your labelling is done in your chart. When you press this button, Elliott Wave Trend will connect each label with lines automatically.
- DE Cycle 2: DE Cycle 2 is the short for Delete Cycle 2. When you press this button, all the lines in the current wave cycle will be deleted. While impulse button pressed, pressing DE Cycle 2 will remove all the lines for impulse wave in the current cycle only leaving the lines for corrective wave. While correct button pressed, pressing DE Cycle 2 button will remove all the lines for corrective wave in the current cycle only.
- DE All Line: DE All Line is the short for Delete All Lines. When you press this buttons, all the lines will be removed regardless of their cycle.
- Panel: Press this button to show and hide the information panel. The information panel provide you the three Elliott Wave counting rules.
- WaveTrend: Press this button to show and hide the trend indicator in your chart. You can use this trend indicator to assist for your trading.
- << : decrease Cycle
- >> : increase Cycle
Trading Strategy Guide
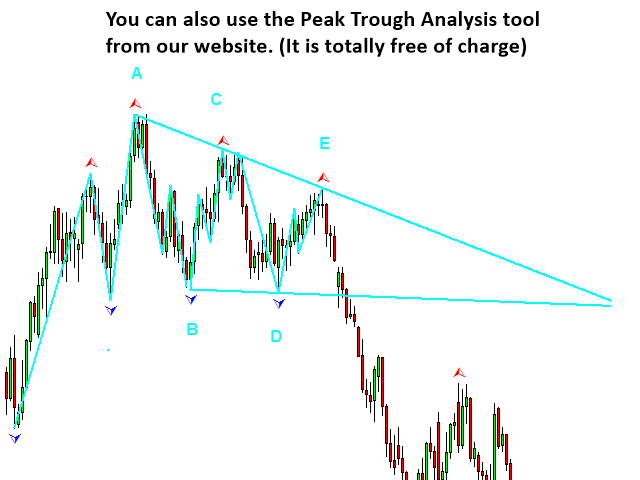
You will find the detailed guide line using Elliott Wave Theory and Elliott Wave Pattern from the link below:
https://www.mql5.com/en/blogs/post/750343
Important Note
This is the off the shelf product. Therefore, we do not accept any modification or customization request on this product. In addition, we do not provide any code library or any support for your coding for this product.


Precise indicator... will help you understand Elliot Waves... essential. Good work