PZ Divergence Trading
- 지표
- 버전: 14.0
- 업데이트됨: 19 7월 2024
- 활성화: 20

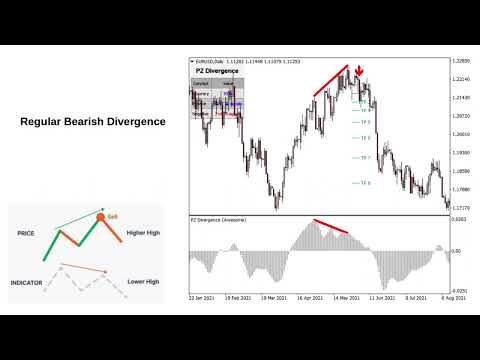
Unlock hidden profits: accurate divergence trading for all markets
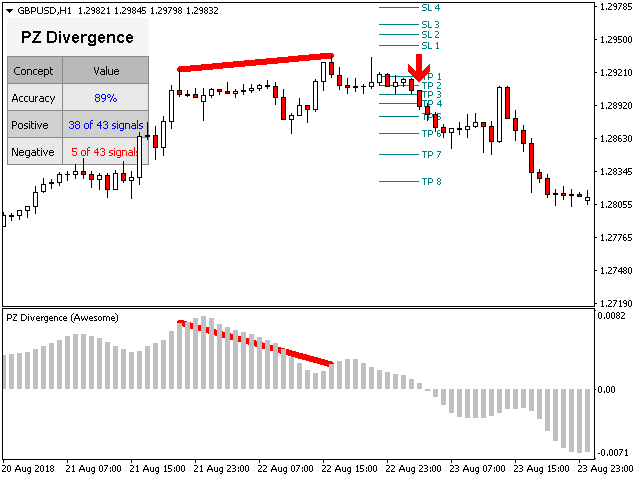
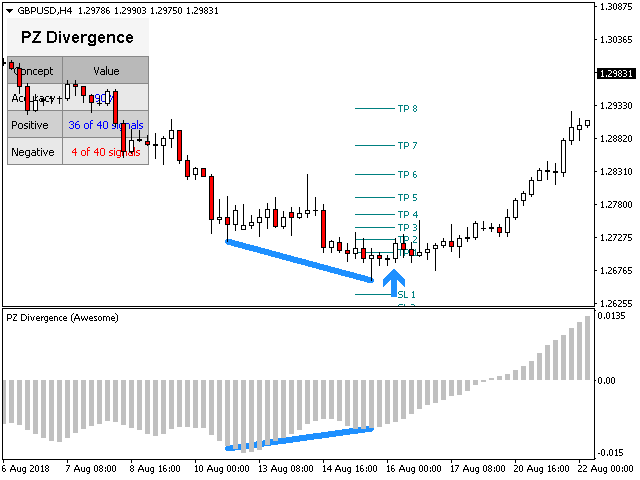
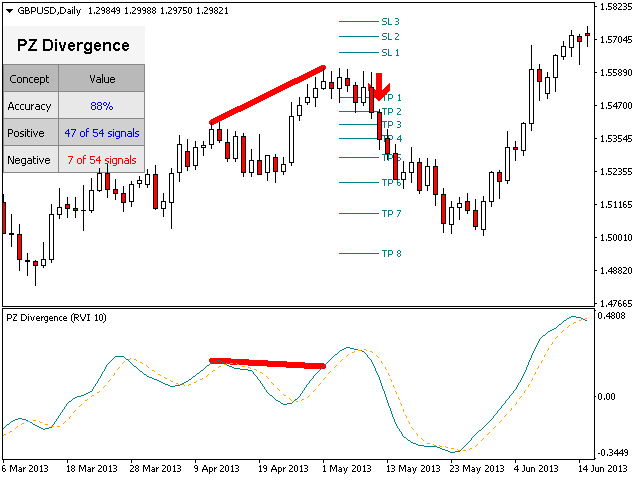
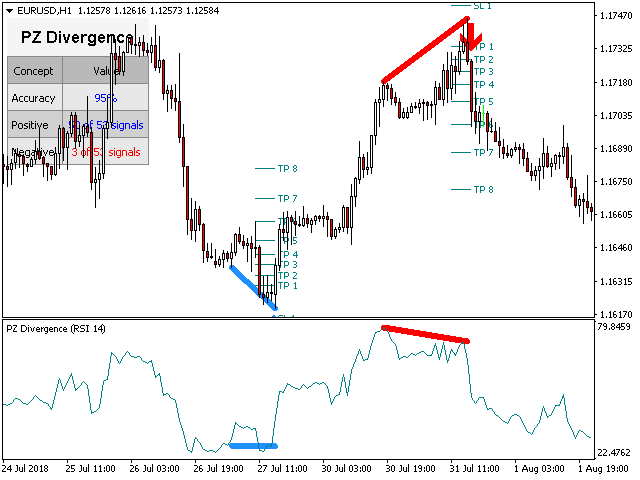
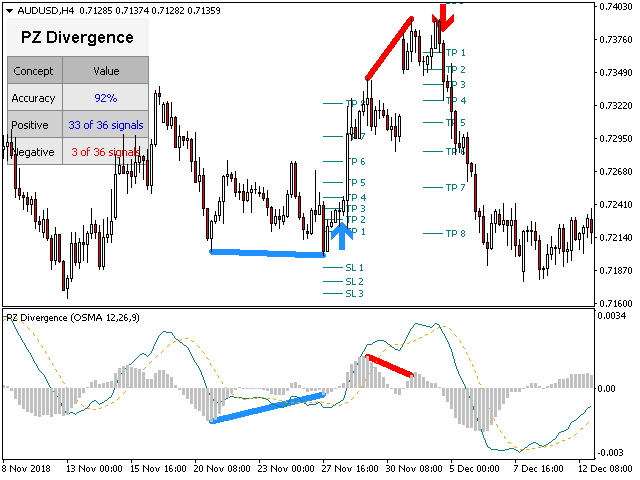
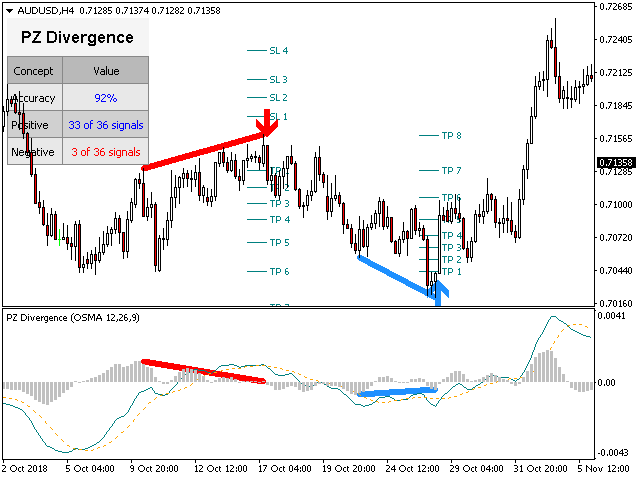
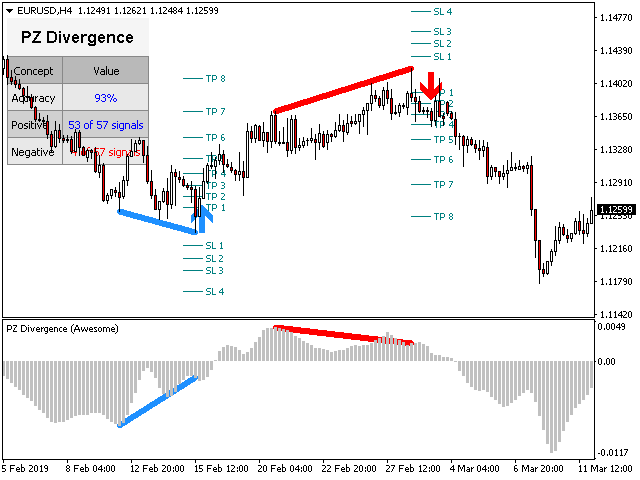
Tricky to find and scarce in frequency, divergences are one of the most reliable trading scenarios. This indicator finds and scans for regular and hidden divergences automatically using your favourite oscillator.
[ Installation Guide | Update Guide | Troubleshooting | FAQ | All Products]
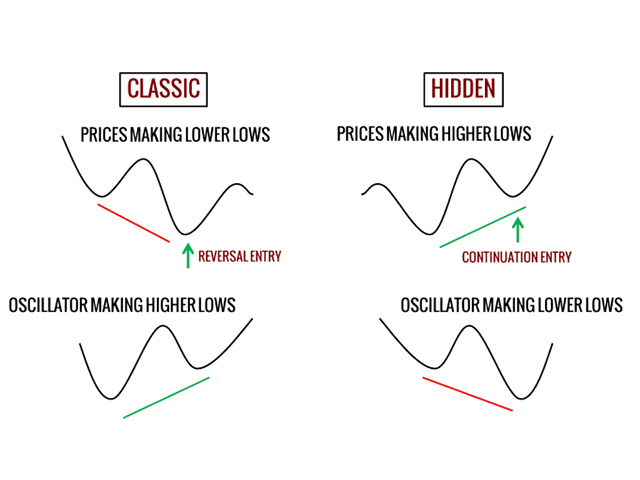
- Easy to trade
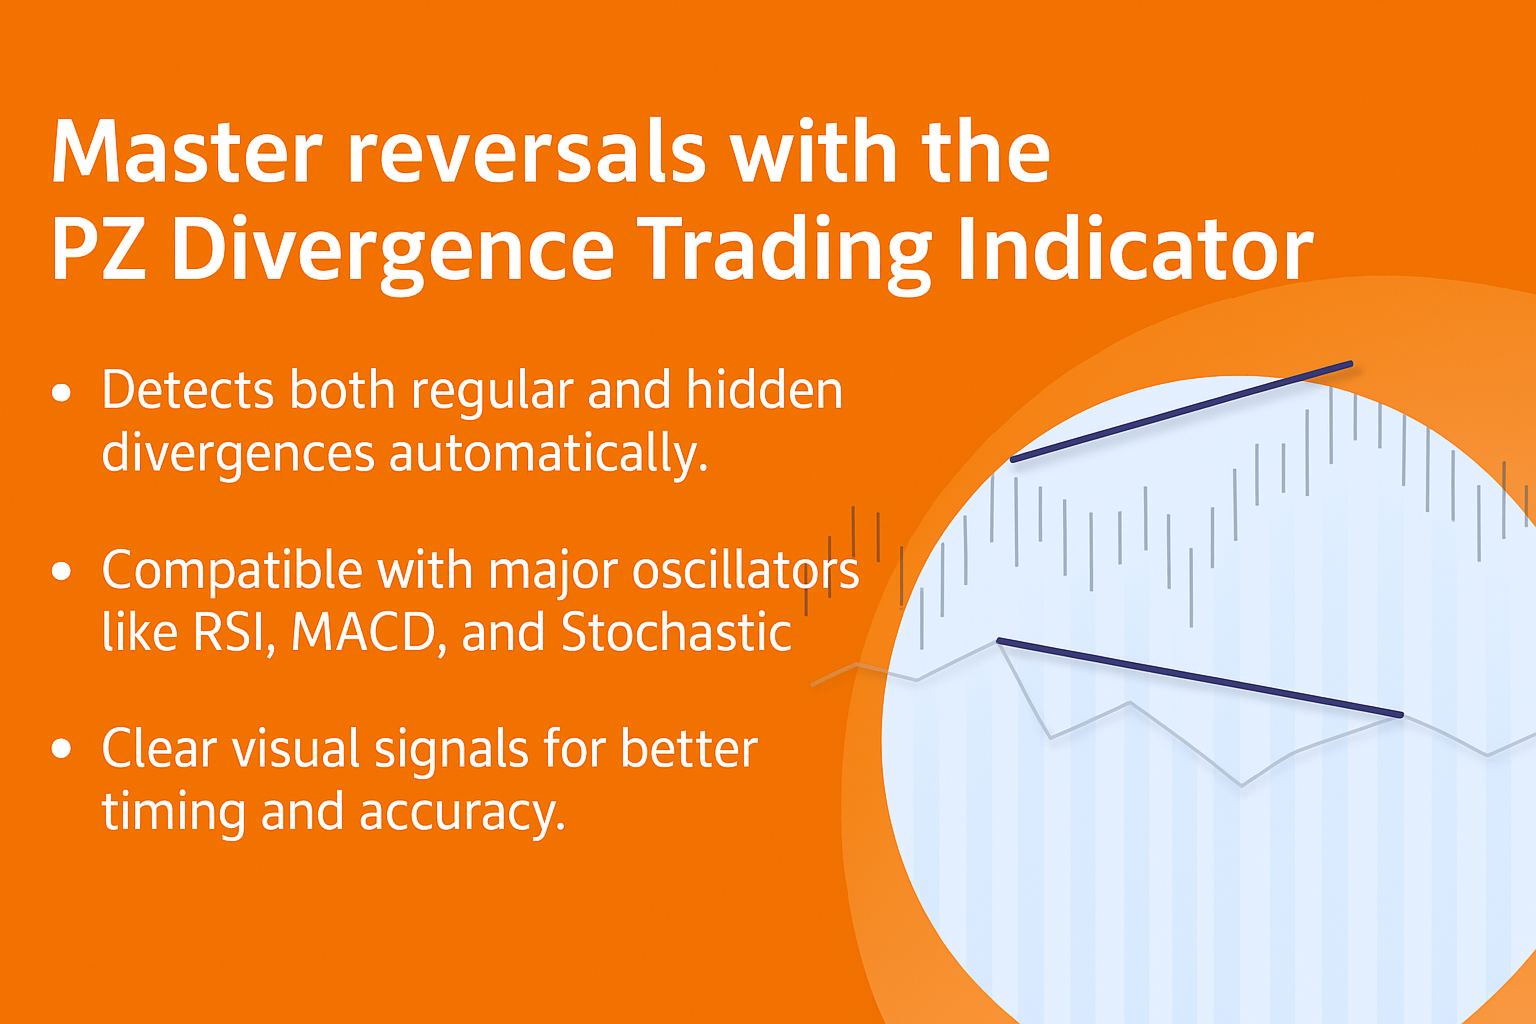
- Finds regular and hidden divergences
- Supports many well known oscillators
- Implements trading signals based on breakouts
- Displays suitable stop-loss and take-profit levels
- Configurable oscillator parameters
- Customizable colors and sizes
- Filter divergences by size in bars
- It implements performance statistics
- It implements email/sound/visual alerts
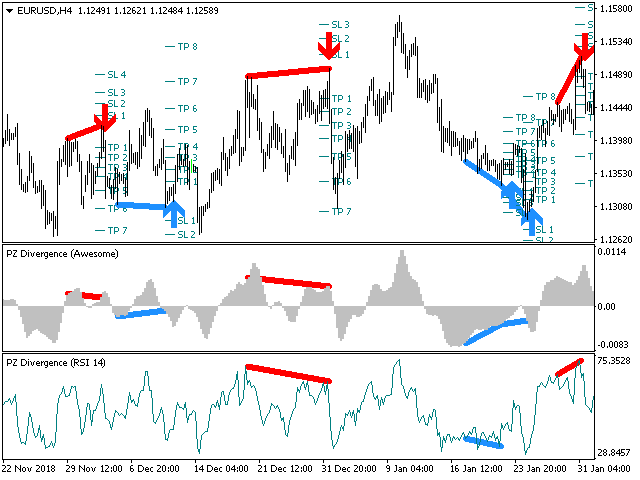
To offer a broad market perspective, the indicator can be loaded many times in the same chart using different oscillators, without interference. The indicator supports the following oscillators:
- RSI
- CCI
- MACD
- OSMA
- Stochastic
- Momentum
- Awesome Oscillator
- Accelerator Oscillator
- Williams Percent Range
- Relative Vigor Index
- Money Flow Index
- On Balance Volume
- Rate of Change
Since divergences can expand quite a bit, especially in the Forex market, this indicator implements a twist: it waits for a donchian breakout to confirm the divergence before signaling the trade. The end result is an otherwise repainting indicator with a very reliable trading signal.
Input Parameters
- Amplitude: Zig-Zag period used to find divergences
- Oscillator - Choose the oscillator to load to the chart.
- Breakout period - Breakout period in bars for the trading signals.
- Divergence types - Enable or disable divergence types: hidden, regular or both.
- Min divergence size in bars - Minimum size in bars for a divergence to be displayed.
- Max divergence size in bars - Maximum size in bars for a divergence to be displayed.
- Max. history bars - Amount of bars to evaluate when the indicator is loaded.
- Indicator Settings - Desired indicator settings for all the oscillators involved.
- RSI period
- CCI period
- WPR period
- Momentum period
- Stochastic periods
- MACD settings
- RVI period
- ROC period
- Drawing Settings - Choose colors and line sizes of the divergences.
- Alerts - Enable or disable alerts of all kinds, plus set a custom alert text.
Author
Arturo López Pérez, private investor and speculator, software engineer and founder of Point Zero Trading Solutions.


I would highly recommend this to anyone who uses divergence in their trading. It's not perfect but this indicator does have some versatility along with some limitations. It does repaint but you need to understand divergence is a process generally not a single candle. I have had the best success using the Zig Zag setting on 8, then waiting for a candle to close across the 15 EMA for confirmation the price is going in the right direction. You may also want to combine divergence with support and resistance and overbought oversold for more confluence.