 MetaTrader 5
 Experts
 지표
지표
 라이브러리
라이브러리
 유틸리티
유틸리티
 위젯
위젯
 규칙
규칙
MetaTrader 4용 기술 지표 - 173
 아래 나열된 기술 지표의 시그널은 MetaTrader 4 플랫폼의 거래를 열고 종료하는 데 중요한 역할을 합니다.
지표의 본질은 가격 변화를 예측하기 위한 금융 시그널 값의 수학적 변형입니다.
아래 나열된 기술 지표의 시그널은 MetaTrader 4 플랫폼의 거래를 열고 종료하는 데 중요한 역할을 합니다.
지표의 본질은 가격 변화를 예측하기 위한 금융 시그널 값의 수학적 변형입니다. 
FOREX MEGA SALE! 50% OFF!
Buy WallStreet Crypto Indicator with a huge –50% discount ! Promo Price: $147
(Regular Price: $297 — You Save $150!) Act now before this deal ends! WallStreet Crypto Indicator is a precision market-analysis tool engineered specifically for high-volatility environments like cryptocurrency (BITCOIN and ETHEREUM) and volatile Forex pairs. Built to deliver real-time visual clarity without chart clutter, it transforms complex price action into clean trend direction, clear

MT4용 Crypto_Forex 지표 HTF ADX. - MT4용 전문 HTF ADX 지표로 거래 방식을 업그레이드하세요. HTF는 상위 시간대를 의미합니다. - ADX(빨간색 선)는 추세 강도를 측정하는 데 사용됩니다. ADX 값이 20 이상이고 상승 추세를 보이면 추세가 강하다는 것을 의미합니다. - +DMI(파란색 선)가 -DMI(녹색 선) 위에 있으면 가격이 상승하고 있으며, ADX는 상승 추세의 강도를 측정합니다. - -DMI(녹색 선)가 +DMI(파란색 선) 위에 있으면 가격이 하락하고 있으며, ADX는 하락 추세의 강도를 측정합니다. - ADX(빨간색 선)가 20 아래에 있으면 시장이 평탄하다는 것을 의미합니다. - 이 지표는 다중 시간대 추세 거래에 매우 유용합니다. 상위 시간대의 ADX를 현재 차트에 적용할 수 있습니다. Click here to see high quality Trading Robots and Indicators! MQL5 웹사이트에서만 제공되는 정

표준 지표들을 조합하여 복잡한 시스템을 구축하고 차트 이력에 적용하여 즉시 백테스팅하는 지표입니다. 9개의 시간 프레임에 걸쳐 16개의 지표로 구성된 매트릭스를 제공하며, 각 셀을 클릭하면 원하는 기간에 대한 조합에 지표가 추가됩니다. 조합 구성원들은 투표를 통해 최적의 조합을 결정하고, 설정된 투표 임계값에 따라 신호를 생성합니다. 조합 구성이 변경될 때마다 결과, 거래 횟수, 수익률, 수익률, 기대값, 최대 손실률 등의 통계가 자동으로 계산됩니다. 유전 알고리즘 최적화 도구가 최적의 조합을 자동으로 선택하며, 완성된 시스템은 키로 저장되어 원하는 차트에 적용할 수 있습니다.
( 사용자 설명서 )
지표 선택, 투표 임계값, 청산 규칙은 트레이더가 직접 설정할 수 있으며, 셀 계산, 백테스팅, 조합 검색은 지표가 자동으로 처리합니다.
주요 기능
이 지표는 세 가지 모드로 작동합니다. Matrix Lab은 매트릭스, 통계, 최적화 기능을 모두 제공하는 종합적인 분석 도구입니다

Stop Watching Trend Lines. Get Alerted. Trend Line Alert automatically monitors your diagonal trend lines and alerts you when price closes above, closes below, or touches the line . Go beyond a basic trend-line alert with candle and price-action confirmation designed to help you focus on higher-quality setups. KEY FEATURES Close Above Trend Line
Get alerted when a qualifying candle closes above your trend line. Close Below Trend Line
Detect bearish breaks when price closes below th

This one draws almost nothing most days, and I'd rather you knew that before you look at a screenshot and decide it's broken. Here's a number from my own machine. I ran it across four symbols and two timeframes, sixteen charts, looking at the last 300 bars of each. It drew a model on five of them. That's the trade the tool makes: a full chain of breaks, a structure shift that closes, and a pullback all the way back to the block at the root of the move. Three things, in that order, or nothing get

SIGNALX SESSION BREAKOUT MetaTrader 4 궁극의 기관 투자자용 프라이스 액션 및 레인지 매핑 지표 제품 개요 및 시장 우위 SignalX Session Breakout에 오신 것을 환영합니다 — MetaTrader 4에서 절대적인 수학적 정밀도를 요구하는 전문 트레이더, 알고리즘 개발자 및 프라이스 액션 전문가를 위해 특별히 설계된 엘리트급 기술 분석 솔루션입니다. 현대 금융 시장에서 초기 세션 통합(아시아 유동성 구간 또는 런던 전 축적 구간 등) 동안 기관 투자자의 흔적을 식별하는 것은 전체 거래일의 주요 방향성 모멘텀을 결정합니다. 개인 트레이더들은 종종 수동 차트 작도, 여러 브로커 간의 시간대 불일치, 중요한 실행 구간을 가리는 복잡한 차트로 인해 어려움을 겪습니다. SignalX Session Breakout은 이 워크플로우를 완벽하게 자동화합니다. 기관의 오프닝 세션 범위를 즉시 격리하고, 동적 브레이크아웃 오프셋 통로를 구축

화살표는 사라고만 말합니다. Obsidian Scalper Pro는 어디서 사는지, 손절이 어디로 가는지, 세 개의 목표가 어디인지, 당신의 리스크에 맞는 포지션 크기가 얼마인지, 그리고 그 셋업이 100점 만점에 몇 점인지까지 말합니다. 모든 시그널은 차트에 그려진 완성된 매매 플랜으로 도착하고, 내장된 통계 창이 최근 백 개의 정직한 결과를 신뢰구간이 붙은 승률까지 포함해 보여줍니다. 모든 결정은 마감된 봉에서 내려지므로, 지금 보고 있는 히스토리가 곧 당신이 실제로 거래했을 히스토리입니다. 이 지표는 금(XAUUSD) M30에서 가장 좋은 성능을 보이며, 다른 어떤 심볼과 타임프레임에서도 사용할 수 있습니다. 이 지표에 맞는 전략이 필요하신가요? 구매 후 MQL5에서 메시지를 보내주시면 보내드리겠습니다. 무엇을 하는가 Obsidian Scalper Pro는 확립된 추세 안의 되돌림 진입을 찾아 각각에 대해 완성된 플랜을 건네줍니다. Entry, SL, TP1, TP2와 선택형

Forex Minor — 30-Engine Confluence Trading Desk for MT4
MT5 Version: https://www.mql5.com/en/market/product/194414 A full trading dashboard on one chart — 30 indicators, one verdict, one entry plan. Product Description Stop switching between fifteen indicators. Let one desk do the reading for you. Forex Minor is not another line on your chart — it's a complete trading workstation built directly on top of MetaTrader 4. It replaces your cluttered chart with a clean, professional HUD (heads-up

아홉이나 열셋은 하나의 차트에서는 드물게 나타나며, 바로 그 때문에 관심 종목 목록이 차트를 계속 옮겨 다니는 것보다 낫습니다. Exhaustion Count Scanner는 취소와 재시작 규칙을 포함한 완전한 setup과 countdown 방법을 심볼 목록 전체에 걸쳐 최대 여덟 개의 타임프레임에서 동시에 실행하고, 진행 중인 모든 카운트를 그것이 향하는 숫자와 함께 표시하며, 타임프레임이 일치하는 행을 표시합니다. 출고 시 열다섯 개의 통화쌍을 스캔하며, 설정 하나로 이를 스물여덟까지 올릴 수 있습니다. 카운트는 바로 앞의 차트에도 그려지므로, 두 번째 인디케이터를 붙이지 않고도 테이블이 찾아낸 것에 따라 행동할 수 있습니다. 10개가 판매될 때마다 가격이 10달러씩 인상됩니다. 이 파일의 카운팅 블록은 단일 차트 제품에 있는 것과 한 글자도 다르지 않은 복사본입니다. 같은 차트의 인디케이터와 카운트가 어긋나는 스캐너는 두 번 다시 신뢰받지 못하는 스캐너이며, 두 파일을 일치시키

28종목, 네 개의 타임프레임, 하나의 화면, 그리고 그 아래 차트에는 이미 매매가 있습니다. Half Trend Scanner는 계단형 추세선을 관심 종목 전체에 돌리고, 가장 최근에 전환한 순서로 보드를 정렬하며, 종목마다 몇 개의 타임프레임이 같은 방향인지를 한 열로 알려줍니다. 측정할 수 없었던 셀은 비워 두는 대신 그 이유를 말로 설명하므로, 빈 보드가 수수께끼가 되는 일은 없습니다. 10개가 판매될 때마다 가격이 10달러씩 인상됩니다. 하나의 파일에 두 개의 제품이 들어 있습니다. 첫째는 지금 보고 있는 차트에 그려지는 Half Trend 자체입니다. 시장이 밀어낼 때까지 자기 수준을 지키는 계단형 추세선, 그 주위의 ATR 채널, 그리고 전환 화살표입니다. 둘째는 같은 계산을 여러 종목과 여러 타임프레임에 한 번에 돌리는 보드입니다. 보드는 어떤 통화쌍이 전환했는지, 그것이 얼마나 최근인지를 말하고, 아래 차트가 선과 채널을 보여주므로 표가 찾아낸 것에 대응하려고 두 번

평균회귀는 숫자 게임이며, 그 숫자는 당신이 지켜볼 수 있는 것보다 더 많은 차트에 살고 있습니다. Nadaraya Watson Envelope Scanner는 인과적이고 다시 그려지지 않는 커널 회귀 엔벨로프를 당신의 심볼 목록 전체에 걸쳐 최대 네 개의 타임프레임에서 동시에 실행하며, 각 재진입을 그 경과와 함께 출력하고 타임프레임들이 일치하는 행을 표시합니다. 기본값으로 열다섯 개의 페어를 스캔하며, 설정 하나로 스물여덟까지 올릴 수 있습니다. 엔벨로프 자체는 당신 앞의 차트에 그려지므로, 두 번째 지표를 붙이지 않고도 테이블이 찾아낸 것에 대해 행동할 수 있습니다. 10개가 판매될 때마다 가격이 10달러씩 인상됩니다. 차트 쪽은 Nadaraya Watson Envelope 그 자체입니다: 인과적인 Nadaraya-Watson 커널 회귀 중심선, 그 주위의 평균 절대 오차로 만들어진 엔벨로프, 그리고 가격이 밖에서 거래된 뒤 엔벨로프 안으로 다시 들어온 지점의 표시입니다. 보드

28종목을 네 개의 타임프레임에서 한 번에, 그리고 모멘텀이 확인되지 않았을 때는 그렇다고 인정하는 보드. QQE Mod Scanner는 서로 독립된 두 개의 QQE 블록을 관심 종목 전체의 RSI 위에서 돌리고, 각 셀에 모멘텀이 어느 쪽으로 돌아섰는지와 몇 봉 전인지를 찍으며, 두 블록이 일치하지 않는 자리에는 그래도 색을 칠하는 대신 flat을 씁니다. AGREE 열은 몇 개의 타임프레임이 같은 쪽에 서 있는지 알려주고, 오실레이터 자체는 표 아래 서브윈도우에 그려집니다. 그래서 보드가 무언가를 찾아낸 바로 그 순간, 당신은 이미 그것을 보고 있습니다. 10개가 판매될 때마다 가격이 10달러씩 인상됩니다. 하나의 파일에 두 개의 제품이 들어 있습니다. 첫째는 이 차트의 자체 서브윈도우에 그려지는 QQE Mod 오실레이터 자체입니다. RSI 위를 도는 서로 독립된 두 개의 QQE 블록을 히스토그램 하나로 묶은 것, 0 주위에 그려지는 추종선, 그리고 그 선에 얹은 볼린저 필터입니

스퀴즈 해제는 몇 개의 바 동안만 지속되며, 당신이 차트를 돌아다니길 기다려주지 않는다. Squeeze Momentum Scanner는 최대 네 개의 타임프레임에서 동시에 심볼 목록을 감시하며, 각 압축이 해제된 정확한 바와 모멘텀이 어느 쪽에 있었는지를 출력하고, 타임프레임이 일치하는 행을 표시한다. 기본값으로 열다섯 개의 통화쌍을 스캔하며, 설정 하나로 스물여덟까지 늘릴 수 있다. 오실레이터 자체는 이 차트의 서브윈도우에 그려지므로, 두 번째 지표를 붙이지 않고도 테이블이 찾아낸 것에 따라 행동할 수 있다. 10개가 판매될 때마다 가격이 10달러씩 인상됩니다. 스퀴즈 해제는 수명이 짧은 사건이며 서로 다른 종목에서 서로 다른 시점에 일어난다. 이는 정확히 보드가 필요한 상황이다. 테이블이 그것들을 찾아내고, 그 아래의 서브윈도우가 해제를 만들어낸 히스토그램 자체를 보여준다. 보드 심볼마다 한 행, 스캔되는 타임프레임마다 한 열이며, 최대 네 개의 열과 최대 스물여덟 개의 심볼까지

28종목을 네 개의 타임프레임에서 한 번에 지켜보고, 그 자리에서 차트 위의 매매까지 봅니다. UT Bot Scanner는 ATR 트레일링 스톱을 관심 종목 전체에 돌리고, 가장 최근에 전환한 순서로 보드를 정렬하며, 종목마다 몇 개의 타임프레임이 같은 방향인지 알려주고, 표 아래 차트에 지표 자체를 그립니다. 그래서 보드가 무언가를 찾아낸 바로 그 순간, 당신은 이미 그것을 보고 있습니다. 측정할 수 없었던 셀은 비워 두는 대신 그 이유를 말로 설명합니다. 10개가 판매될 때마다 가격이 10달러씩 인상됩니다. 하나의 파일에 두 개의 제품이 들어 있습니다. 첫째는 지금 보고 있는 차트에 그려지는 UT Bot MTF 자체입니다. 서 있는 쪽에 따라 색이 바뀌는 ATR 트레일링 스톱과 전환 화살표이며, 단일 차트 제품이 가진 것과 같은 선택적 필터를 그대로 갖추고 있습니다. 둘째는 같은 계산을 여러 종목과 여러 타임프레임에 한 번에 돌리는 보드입니다. 양쪽 절반이 같은 필터를 돌리므로,

28개의 차트 대신 한눈에. Wave Trend Oscillator Scanner는 여러분의 심볼 목록에 대해 Wave Trend 계산을 최대 네 개의 타임프레임에서 동시에 실행하고, 모든 신선한 크로스를 그 경과 시간과 등급과 함께 출력하며, 타임프레임들이 실제로 일치하는 행을 표시합니다. 기본값으로는 열다섯 개의 페어를 스캔하며, 설정 하나로 스물여덟 개까지 올릴 수 있습니다. 그리고 오실레이터 자체가 이 차트의 서브윈도우에 그려지므로, 두 번째 인디케이터를 붙이지 않고도 테이블이 찾아낸 것에 따라 행동할 수 있습니다. 10개가 판매될 때마다 가격이 10달러씩 인상됩니다. 이것은 Wave Trend 오실레이터가 시장이 구간에 얼마나 깊이 들어갔는지에 따라 자신의 크로스에 등급 1 또는 2를 부여하기 때문에, 등급이 실제로 보드에 나타나는 이 제품군의 두 제품 중 하나입니다. 보드 심볼당 한 행, 스캔되는 타임프레임당 한 열, 최대 네 개의 열과 최대 스물여덟 개의 심볼입니다. 기

Crypto Minior — 30-Engine Confluence Command Center for MetaTrader 4 MT4 Version : https://www.mql5.com/en/market/product/194336 A full trading dashboard built into a single chart indicator. Crypto Minior turns your MT4 chart into a 7-page command center that reads 30 technical engines across trend, momentum, and order-flow, distills them into one clear verdict, and lays out an entry/stop/target plan — all without a single extra window. Built with crypto pairs in mind, but works on any symb

HIZOA RSI Divergence Oscillator is a visual market-analysis tool designed to automatically detect and display regular bullish and bearish RSI divergences between price and momentum. Divergence can be an important indication that the relationship between price and momentum is changing. However, during active trading it is surprisingly easy to overlook — especially when monitoring multiple markets or timeframes. HIZOA RSI Divergence Oscillator continuously analyzes price structure and RSI behavi

30 Global Forex Radar — Multi-Page AI-Style Signal Dashboard for MT4 Turn your chart into a professional trading command center. 30 Global Forex Radar scans 30 major, minor, and exotic pairs (plus Gold and Silver) using a 30-indicator consensus engine, then presents everything through a sleek, website-style dashboard — right on your MT4 chart. No more flipping between charts or building your own watchlist spreadsheet. Why Traders Love It Most "multi-currency scanners" dump a wall of numbers on

The band on nearly every channel indicator you can download is sized by an ATR, while the line running down the middle of it comes from something else entirely. Two filters, two different lags, stapled together. The join is where the false signals live. This one runs the true range through the same Gaussian filter as the price, at the same pole count and the same period. The band and the centre line turn on the same delay, because they are the same filter fed different data. Where the usual vers

MT4용 Crypto_Forex 지표 "Engulfing_Bar 및 Consolidation_Bar" 패턴, 재도색 및 지연 없음. - "Engulfing Bar 및 Consolidation Bar" 패턴은 가격 움직임 거래에 매우 효과적입니다. - 이 지표는 차트에서 Engulfing Bar 및 Consolidation Bar를 감지합니다. - 상승 Engulfing Bar 패턴 - 차트에 녹색 화살표 신호. - 하락 Engulfing Bar 패턴 - 차트에 주황색 화살표 신호. - 상승 Consolidation Bar 패턴 - 차트에 파란색 화살표 신호. - 하락 Consolidation Bar 패턴 - 차트에 빨간색 화살표 신호. - Consolidation Bar 자체는 높은 R/R 비율(수익률/위험률)을 갖습니다. - PC, 모바일 및 이메일 알림 제공. - "Engulfing Bar 및 Consolidation Bar" 패턴은 지지/저항선과 결합하기 매우 좋습니다. Cl

this is part of Advanced Cycle Momentum Excess Oscillator MT4 u need all 2 to better understand
Advanced Non-Repainting Harmonic Cycle & Hurst Exponent Trading Engine Overview is a state-of-the-art institutional-grade indicator designed to decode market mechanics through mathematical rigor. Combining the Hurst Exponent for regime identification with Harmonic Cycle Analysis (via Autocorrelation Function - ACF), this tool identifies market turning points, cyclical phases, and high-probabi

this is part of Cyclic evolutive indicators oscillator
Advanced Cycle Momentum & Excess Oscillator MT4 PRODUCT DESCRIPTION: Advanced Cycle Momentum & Excess Oscillator is an advanced quantitative trading tool designed to solve the single biggest challenge faced by every trader: impeccable market timing . While standard retail indicators (like RSI or Stochastic) generate constant false signals during strong trends, this algorithm operates on a centered, cycle-based mathematical framework .

Crypto_Forex 지표 "RSI FLAT 감지기"는 트레이딩에 효율적인 보조 도구입니다! 리페인트 없이도 사용 가능합니다. MT4용 이 훌륭한 지표로 트레이딩 방식을 업그레이드해 보세요. - 이 지표는 차트에서 가격이 평평한 영역을 표시합니다. "플랫 민감도" 매개변수가 있어 플랫 감지를 담당합니다. - "RSI FLAT 감지기"는 가격 움직임 진입 확인 또는 다른 지표와 함께 사용할 수 있습니다. - 추세 추종 시스템에서 플랫 영역을 감지하고 해당 영역에서의 거래를 피할 수 있습니다. - 반전 스캘핑(평평한 경계에서 반전 거래)에도 사용할 수 있습니다. - 표준 RSI 오실레이터 대신 "RSI FLAT 감지기"를 사용할 수 있는 방법은 많습니다. - RSI 자체는 트레이딩에서 가장 널리 사용되는 오실레이터 중 하나이며, 다이버전스 감지에 매우 유용합니다. - 매수 과다 구간(70 이상)에서는 매도 거래를, 매도 과다 구간(30 미만)에서는 매수 거래를 하는 것이 좋습니다.

MT4용 Crypto_Forex 지표 "확률 및 2개 이동 평균", 리페인트 불필요 - 스토캐스틱 오실레이터는 시중 최고의 지표 중 하나로, 많은 트레이더에게 이상적인 도구입니다. PC/Mobile alerts! - "확률 및 2개 이동 평균" 지표를 사용하면 스토캐스틱 오실레이터의 빠른 이동 평균과 느린 이동 평균을 확인할 수 있습니다. - 과매수 구간 - 80 이상, 과매도 구간 - 20 미만 - 80 이상 구간에서는 매도 진입, 20 미만 구간에서는 매수 진입이 유리합니다. - 매수 및 매도 진입 조건은 그림에서 확인할 수 있습니다. - 매수 신호 조건을 고려하세요. (1) - 빠른 이동 평균선이 과매도 구간에서 느린 이동 평균선을 상향 교차하는 경우: 매수 포지션을 개시합니다. (2) - 스토캐스틱 값이 과매수 구간에 있고 빠른 이동 평균선이 하향 교차하는 경우: 매수 포지션을 청산합니다. (3) - 매도 포지션의 경우 그 반대의 경우(그림 참조). Click here

AW Supply Demand는 고전적인 방식으로 공급 존과 수요 존을 찾습니다: 몇 개의 작은 캔들로 이루어진 베이스와 그 뒤에 이어지는 가격의 강한 이탈입니다. 각 존은 여섯 개의 명시된 구성 요소로 이루어진 0에서 10까지의 공개 점수를 받고, 신선한 상태에서 돌파와 반전 상태까지 이어지는 생애 주기를 거치며, 패널은 존을 바탕으로 진입, 손절, 목표 수준을 갖춘 완성된 셋업을 구성합니다. 이 지표는 최대 세 개 상위 시간대의 존을 하나의 차트에 표시하고, 알림을 전송하며, 모든 데이터를 EA용 버퍼로 전달합니다. 존은 다시 그려지지 않습니다. 존은 베이스 이후 지정된 수의 종료된 바가 지나면 나타나고, 확정된 뒤에는 경계가 변하지 않으며, 이후에는 상태, 점수, 터치 횟수만 변합니다. 매뉴얼과 사용 설명 -> 여기 / MT5 버전 -> 여기 지표로 거래하는 방법: 1단계 - 존 선택 패널은 거래할 가치가 있는 존의 셋업과 그 점수에 따른 판정을 표시합니다. Limit orde

Tick Volume Dots — Uptick/Downtick Confirmation Indicator
"Read Real Order Flow, Not Just Candle Color" — shows a run of red dots quietly warning of a reversal before the candles confirm it, then the flip to green dots at the exact turn. "Confirm Scalp Entries in Seconds" — pairs the on-chart dots with the histogram subwindow, showing how a burst of green dots + a tall green bar = high-conviction entry, versus choppy mixed signals to skip. "Catch Exhaustion Before It Traps Your Trade" — a red do

HIZOA Clean Volume Flow provides a clear visual representation of directional volume pressure. No complicated dashboard and no unnecessary signals. The indicator presents the information in a clean and easy-to-read format: Green bars above zero indicate bullish volume pressure.
Red bars below zero indicate bearish volume pressure.
Bar height and color intensity reflect the strength of the current tick volume compared with its local average.
The status display shows the symbol, timeframe, volume

대화형 구조 대시보드 (Interactive Structure Dashboard): 최고의 멀티 타임프레임 스마트 머니 컨셉 (SMC) 지표
스마트 머니 컨셉 (Smart Money Concepts, SMC), 구조 파쇄 (Break of Structure, BOS), 공정 가치 갭 (Fair Value Gaps, FVG)은 현대 개인 및 기관 트레이더들이 시장 메커니즘을 바라보는 방식을 완전히 혁신했습니다. 단순한 소액 트레이더용 지지와 저항선에 의존하던 시대는 지났습니다. 현대 트레이딩의 핵심 우위는 은행의 흔적, 기관의 유동성, 그리고 구조적 변화를 추적하는 데 있습니다.
InteractiveStructureDashboard MQL4 지표는 수동으로 여러 타임프레임을 확인하는 번거로움과 완전 자동화된 기관 추적 시스템 간의 간극을 메워줍니다. MetaTrader 4 터미널 내부에서 올인원 커맨드 센터 역할을 하며, 승률 높은 세팅을 찾아 여러 자산과 타임프레임을 동시에 스

Hull Trend ATR Signals draws a Hull band, prints Buy and Sell labels, and hangs three take-profit lines off every signal. Before the screenshots, one input needs explaining, because it decides what you are looking at. It is called Signal source: daily close , and it ships on. With it on, the signal is computed from the daily close rather than the current bar's close. On a day that has already finished, every hourly bar of that day is fed the day's final close. So a Buy printed at 00:00 on a hist

Pair Quant Arbitrage is a statistical pair-trading indicator for MetaTrader 4 designed to identify temporary relative imbalances between two financial instruments. Instead of trying to predict the direction of one market in isolation, the indicator analyzes two instruments as a connected system. It evaluates the quality of their current relationship, measures their relative displacement, determines the potential direction of both pair legs, and displays a model-implied equilibrium reference dire

Most reversal arrows appear while the bar is still moving, then quietly vanish when the bar closes somewhere else. That one habit is why traders stop trusting arrow indicators, and it is the first thing I fixed here. Super Setup decides after the close and never on the forming bar, so a mark you can see is a mark that stayed. The second thing is how few marks there are. On the EURUSD H4 screenshot below, five weeks of price gets six marks. If you want an arrow on every swing, this is the wrong t

PowerTech Prop Trading System PRO Intraday mapping, multi-source macroeconomic filtering, high-timeframe structural liquidity, and account risk control architecture engineered natively for MetaTrader 4 (MT4). Built specifically for Prop Firm Traders, Funded Account Challengers, and Day Traders, PowerTech Prop Trading System PRO organizes your intraday workflow directly on the chart: Asian/Tokyo accumulation boxes, multi-tier breakout target expansions, live prop-firm exposure tracking, automate

30 Indicator Comment Center — Your Full Trading Desk on One Chart (MT4 Edition) 30 Indicator Comment Center turns your MetaTrader 4 chart into a complete confluence-trading workstation. Instead of stacking a dozen separate indicators and guessing how they agree, this tool runs 30 professional-grade technical engines simultaneously , blends them into a single live verdict, and presents everything through a clean, modern six-page interface — built right on your chart. No more switching windows. No

AI Super Commander — 20 Engines. One Verdict. One Command Center. AI Super Commander turns your MetaTrader 4 chart into a live confluence command center. Instead of juggling a dozen indicator windows and guessing how they agree, this tool evaluates 20 professional-grade technical engines in real time , fuses them into a single actionable verdict, and presents everything through a modern, six-page trading terminal — built directly onto your chart. No more switching windows. No more mental math. J

Volume Channel Flow Indicator MT4 Dynamic Channel Breakout Indicator for MetaTrader 4 Volume Channel Flow Indicator is a professional technical analysis indicator for MetaTrader 4 , designed to identify potential trend changes and breakout opportunities using a dynamic price channel calculated with ATR-based channel width . The indicator analyzes confirmed market candles and automatically builds a dynamic channel around price. When price closes beyond the channel, the indicator identifies a pote
Candle Pattern Engine 은 여러 시간 프레임에서 캔들 패턴을 인식하는 지표입니다. 여러 시간 프레임의 가격 움직임을 동시에 스캔하여 최대 41개의 클래식 캔들 패턴을 탐지하며, 선택 가능한 추세 지표를 사용해 신호를 필터링함으로써 추세에 역행하는 패턴으로 인해 발생하는 노이즈를 줄일 수 있습니다.
주요 기능 1. 멀티 타임프레임 패턴 스캔 쉼표로 구분된 여러 시간 프레임 목록(예: M5, M15, H1)을 하나의 인스턴스에서 스캔할 수 있습니다. 사용자가 설정할 수 있는 Lookback 기간을 통해 각 시간 프레임에서 분석할 캔들의 개수를 지정할 수 있습니다. 2. 4개 그룹으로 구성된 41가지 캔들 패턴 단일 캔들: Doji(도지), Hammer(망치형), Inverted Hammer(역망치형), Hanging Man(행잉맨), Shooting Star(유성형), Dragonfly Doji(잠자리형 도지, 고점/저점), Gravestone Doji(비석형 도지,

MT4용 TREND MACD 지표 - 훌륭하고 효율적인 거래 도구입니다! - 이 지표는 큰 가격 변동을 포착하는 데 집중하는 추세 트레이더에게 유용합니다. - TREND MACD는 3개의 선으로 구성됩니다. 녹색선은 주요 추세 방향을 나타내며, 파란색과 자홍색 선은 진입 및 청산을 나타냅니다. - 지표를 사용하면 수익을 극대화할 수 있습니다. 수익성 있는 거래에서 너무 일찍 청산하지 않도록 합니다. - 지표에는 모바일 및 PC 알림 기능이 내장되어 있습니다. 매수 거래에 지표를 사용하는 방법(그림 참조): 1) 파란색과 자홍색 선이 모두 녹색선 위에 있는지 확인합니다. 2) 파란색 선이 자홍색 선 위에 있으면 매수합니다. 3) 파란색 선이 자홍색 선 아래에 있으면 청산합니다. 4) 매도 거래의 경우 반대로 합니다. Click here to see high quality Trading Robots and Indicators! MQL5 웹사이트에서만 제공되는 정품 제품입니다.

EightForce Currency Strength 28
EightForce Currency Strength 28 is a multi-currency strength indicator for MetaTrader 4.
The indicator analyzes the 8 major currencies: AUD, CAD, CHF, EUR, GBP, JPY, NZD and USD.
It uses data from the 28 major Forex cross pairs and displays the relative strength of each currency in one separate indicator window.
Main features
- 8 currency strength lines - 28-pair market calculation - Market Momentum line - Dynamic Market Fib levels - Automatic highlighting o

DONCHIAN MARKET & TREND INTELLIGENCE ENGINE (MT4) Multi-Factor Volatility, Trend Structure & Institutional Breakout Validation Dashboard MOST BREAKOUT INDICATORS ARE TRAPPING YOU. They Tell You THAT Price Broke Out. They Never Tell You IF It Will Hold. You have lived this scenario dozens of times: Price spends days coiling inside a tight Donchian band on your MT4 chart. A massive candle punches above the 20-period high. You buy the breakout — expecting momentum. Three candles later, price colla

THE GOLDEN SWEEP — 세 개의 타임프레임으로 만드는 골드 시그널.
THE GOLDEN SWEEP은 골드(XAUUSD)를 위해 만들어졌으며 어떤 종목에서도 작동한다. 모든 시그널은 같은 순서를 따른다. 상위 타임프레임의 방향, 그 방향의 상위 타임프레임 order block, 그리고 차트의 확인 패턴이다. 방향 필터는 끌 수 있다.
셋업이 준비되면 차트에 점선으로 표시되어, 시그널보다 먼저 셋업이 형성되는 것을 볼 수 있다.
확인 패턴은 order block, fair value gap, 또는 연속된 두 개의 fair value gap(2FVG)이며, 각각 개별적으로 켜고 끌 수 있다. 시그널은 Buy 또는 Sell 라벨이 붙은 채워진 화살표로 표시되며, 크기·거리·색상을 조정할 수 있다.
모든 것은 마감된 캔들에서만 평가되므로, 히스토리에 보이는 내용은 지표가 실시간으로 보여 준 내용과 같다. 셋업은 매일 브로커 시간 자정에 초기화되며 세션 안에서만 그려진다.

S7SFX VHL Indicator Visible High & Low Indicator for MT4 S7SFX VHL is a clean and lightweight MT4 indicator designed to automatically identify the highest High and lowest Low within the visible area of your chart. The indicator dynamically updates the levels as you move, scroll, zoom, or resize the chart, helping traders quickly identify the current visible price range without manually searching for key levels. Key Features · Automatic Visible High & Low detection · Dynamic upd

TrendCross MTF Pro TrendCross MTF Pro is a professional multi-timeframe trading indicator designed to help traders identify high-quality directional opportunities while reducing unnecessary market noise. The indicator analyzes market conditions across multiple timeframes and displays clear BUY and SELL arrows directly on the chart when its internal conditions are confirmed. Unlike indicators that react to every short-term price movement, TrendCross MTF Pro uses a combination of proprietary trend

ANATRADEX SMC Detector — Smart Money Concepts & ICT Analysis for MT4 The ANATRADEX SMC Detector is a professional Smart Money Concepts (SMC) and ICT indicator for MetaTrader 4. It automatically detects the key structures institutional traders use: Order Blocks, Fair Value Gaps, Break of Structure, Change of Character, Sessions, and Higher Timeframe Bias — all on a single chart, on any instrument and any timeframe. Simple by default. Powerful when you need it. CORE FEATURES Order Blocks (OB) — De

BOLLINGER MARKET & TREND INTELLIGENCE MT4 Bollinger Breakout Analysis • Volatility Regimes • Trend Structure • Breakout Validation • Post-Breakout Analysis STOP GUESSING WHICH BREAKOUTS ARE REAL. You've been here before. Price closes outside the upper Bollinger Band. You see the breakout. You hesitate for a second — then enter. Three candles later, price is back inside the band. The breakout failed. Now you're wondering whether you entered too early, whether you should have waited for a retest,

Most EMA ribbon indicators call it a trend as soon as the fast line is above the slow one. That's two lines out of six doing all the work, and it's why a "trend" ribbon can look like a plate of noodles while still printing arrows. Stacked Ribbon Signals only calls a trend when all six averages sit in order, and it marks the one bar where that order completes. So it's quiet. On the EURUSD H1 screenshot below, three weeks of price get three marks. If you want an arrow on every swing, this is the w

Chart Sync — 다중 차트 크로스헤어, 점프 및 도형 동기화 도구 여러 차트 간 크로스헤어 이동, 클릭 점프 탐색, 그려진 객체를 실시간으로 동기화합니다 — 멀티 타임프레임 및 멀티 심볼 분석에 적합합니다. 주요 기능 연결된 모든 차트 간 실시간 크로스헤어 동기화 클릭 점프 탐색 — 클릭한 시점으로 연결된 모든 차트가 자동으로 중앙 정렬 실시간 도형 동기화(추세선, 수평/수직선, 사각형, 채널, 피보나치 — 사용자 지정 레벨 및 색상 포함) 그룹 기반 연결 — 여러 독립적인 동기화 그룹을 동시에 실행 가능 동일 심볼만 동기화하는 옵션(하나의 종목의 다른 타임프레임 비교에 유용) 메뉴 없이 차트에서 원클릭으로 전환 가능한 패널 가벼운 설계 — DLL 불필요, 외부 종속성 없음 이런 분들께 추천 하나의 차트에 표시한 내용을 다른 모든 차트에도 반영하고 싶은 멀티 타임프레임 트레이더 여러 심볼을 나란히 비교하는 트레이더 여러 차트 창에서 동일한 분석을 수동으로 반복하는 데 지친 사

HTF Filtered Momentum Band is a trend indicator with three layers that each answer one question. The background says which way the H4 trend points. The band says whether momentum on your own chart agrees. The arrows say when a short-term trend has just turned. And out of the box, the arrows stay quiet whenever they disagree with H4. That last part is why it exists. Most multi-timeframe tools paint the higher timeframe's colour on your chart and then print arrows that ignore it completely. So you

M1 Best One – All-in-One Trading Analysis Indicator for MT5 Launch Discount: For one purchase is just $35, Price is 200$. User Manual
*** Contact me to send you instruction and add you in "M1 Best one group" for sharing or seeing experiences with other users. Related Product: M1 Best One MT5 One Chart. Multiple Market Insights. M1 Best One is a powerful all-in-one technical analysis indicator for MetaTrader 4 , designed to help traders analyze market structure, trend direction, important

S7SFX Multi Timeframe Candle Range S7SFX Multi Timeframe Candle Range is a clean and lightweight MetaTrader 4 indicator designed to help traders monitor candle ranges across multiple timeframes from a single chart. Instead of switching between charts to check how much price has moved, the indicator provides a clear Multi-Timeframe overview of candle range information in one convenient dashboard. Key Features • Multi-Timeframe Candle Range
• Monitor multiple timeframes from one chart
• Current ca

ShowTradeHistory_V2 is a Custom Indicator for MetaTrader 4 (MT4). Its main purpose is to serve as a Trade History Visualizer , automatically mapping your past and current trades directly onto the price chart along with a performance summary panel. Key Features & Functionalities Trade Entry & Exit Mapping: Entry Marker: Places a text label ( BUY / SELL ) at the exact opening price, showing lot size, entry price, and execution time. Exit Connection Line: Draws a dashed trendline connecting the ent

MT4용 Crypto_Forex 지표 HTF OsMA 오실레이터 .......................................................... - HTF OsMA는 시장에서 가장 뛰어난 추세 지표 중 하나입니다. HTF는 Higher Time Frame(상위 시간대)을 의미합니다. - 이 지표는 가격 변동 진입 시점을 포함하거나 다른 지표와 함께 사용하는 다중 시간대 거래 시스템에 매우 적합합니다. - HTF OsMA 지표를 사용하면 상위 시간대의 OsMA를 현재 차트에 연결할 수 있습니다. --> 이는 전문적인 거래 방식입니다. - PC / Mobile alerts! Click here to see high quality Trading Robots and Indicators! MQL5 웹사이트에서만 제공되는 오리지널 제품입니다.

SignalGenerator_X1nBandas
SignalGenerator_X1nBandas is a technical analysis indicator for MetaTrader 4 designed to identify potential buy and sell signals using multiple technical conditions.
The indicator combines:
• EMA 10 and EMA 21 for trend and crossover analysis • EMA 50 as a trend filter • RSI 14 for momentum confirmation • ADX 14 for trend strength confirmation • Japanese candlestick direction for additional signal confirmation
Buy signals are generated when the necessary bullish co

8Wind – Multi-Oscillator Trend Alignment 8Wind is a visual trend and momentum indicator for MetaTrader 4 that combines eight market oscillators in a single normalized window . Instead of switching between multiple indicator windows, 8Wind allows you to observe how different oscillators move together. When several lines begin to rise, fall or align in the same direction, changes in market momentum and directional agreement become much easier to see. The indicator combines: CCI – Commodity Channel

WB Signal WB Signal is the Indicator that can help a Trader to S pot a Quality Entry. Automatic Historical Recalculation: Upon loading or changing assets, the script parses the entire available chart history via a dynamic loop array, mapping past setups so you can instantly back test its visual performance. Non-Repainting Signal Printing: The code evaluates price action strictly after a candle finishes. Once a buy or sell arrow prints on your chart, it will never change position

MQL5 블로그 = https://www.mql5.com/en/blogs/post/775942 MT4 버전 = https://www.mql5.com/en/market/product/196315 MT5 버전 = https://www.mql5.com/en/market/product/196316
'Reversal Probability(반전 확률)'는 과거의 시장 반전 지점(피벗)이 집중된 가격대를 식별하기 위해 설계된 고급 시장 분석 지표입니다.
이 지표는 단일 지지선이나 저항선에 의존하는 대신, 확정된 시장 피벗을 기반으로 동적인 반전 확률을 산출하고 이를 유의미한 가격대로 구성합니다. 이를 통해 트레이더는 과거에 반전 움직임이 집중되었던 구간과 현재 가격이 해당 구간 대비 어디에 위치해 있는지 파악할 수 있습니다.
이 지표는 피벗 분석, 가격 밀도 프로파일링, 동적 지지 및 저항, 클러스터 시각화, 그리고 전문가급 다중 심볼 대시보드를 하나의 트레이딩 작업 공간에 통합하여 제공

고급 맞춤형 Crypto_Forex 지표 "적응형 에너지 오실레이터" - MT4를 위한 효율적인 보조 거래 도구! - 이 지표는 차세대 오실레이터입니다. - "적응형 에너지 오실레이터"는 조정 가능한 적응형 과매수/과매수 영역을 제공합니다. - 추세 시장에서 매우 유용한 기술적 모멘텀 지표입니다. - 오실레이터는 과매도/과매수 영역에서 주요 추세 방향으로 정확한 진입 시점을 찾는 보조 도구입니다. - 적응형 과매도 영역: 녹색선 아래 - 적응형 과매수 영역: 빨간색선 위 - 일반 오실레이터보다 정확합니다. - 모든 시간대에서 사용할 수 있습니다. - PC 및 모바일 알림 기능이 내장되어 있습니다. Click here to see high quality Trading Robots and Indicators! MQL5 웹사이트에서만 제공되는 오리지널 제품입니다.

ContextAxis Supply Demand Trade Planner ContextAxis Supply Demand Trade Planner 는 차트에 존이 나타났다는 이유만으로 진입하는 것이 아니라, 공급과 수요 영역을 구조적으로 해석할 수 있도록 돕는 의사결정 지원 인디케이터입니다. 상위 타임프레임의 공급·수요 존, 멀티 타임프레임 컨텍스트, 형성 등급, 종가 확정 캔들 반응 확인, 기술적 목표, Risk:Reward 필터, 포지션 사이징 계획을 하나의 워크플로우에 통합합니다. 주요 기능 Supply & Demand Areas — 상위 타임프레임에서 기술적 Buy Area와 Sell Area를 식별합니다. Multi-Timeframe Context — 상위 타임프레임으로 존을 구성하고 더 높은 타임프레임으로 시장 컨텍스트를 확인합니다. FORM A / B / C / D — 존이 형성될 당시 존재했던 기술적 근거의 양을 보여줍니다. FORM은 승률 점수가 아니며 수익을 보장하지

MT4용 Crypto_Forex 지표 "스캘핑 채널 프로" - 스캘핑 채널 프로는 ATR 기반 변동성 경계를 제공합니다. - 스캘핑 거래에 유용합니다. - 중간선에서 약정 대기 지정가 주문을 통해 거래를 시작하세요. - 파란색 상승 채널이 안정적으로 형성되고 최소 1개의 캔들이 상단 경계선 위에서 마감될 경우 강세 진입으로 판단합니다(그림 참조). - 빨간색 하락 채널이 안정적으로 형성되고 최소 1개의 캔들이 하단 경계선 아래에서 마감될 경우 약세 진입으로 판단합니다(그림 참조). - 지표에는 정보 표시 기능이 있습니다. 지표가 부착된 외환 통화쌍의 현재 스프레드와 스왑을 표시합니다. - 계좌 잔액, 자본금, 증거금도 표시됩니다. - 정보 스프레드 스왑 표시는 차트의 어느 모서리에서나 찾을 수 있습니다. 여기를 클릭하여 고품질 트레이딩 로봇과 지표를 확인하세요! MQL5 웹사이트에서만 제공되는 정품 제품입니다.

TWR Gold Intelligence Pro is an XAUUSD chart-analysis indicator for traders who want a structured view of how the Gold trading day is developing.
The indicator combines daily-open context, Initial Extreme state tracking, structure and reclaim information, defence zones, delivery ladders, session timing and chart-based trade-action labels in one workspace.
The purpose of the product is analytical. It does not guarantee market direction or profitability, and it does not place trades automaticall

A lot of pivot indicators quietly redraw the levels you already traded. They build today's central pivot range from a bar that's still open, so the "support" you bought at 9am has moved by lunch and the screenshot you saved doesn't match the chart any more. CPR Trend Zones takes the range from the last closed day or week, and once a period has started its lines don't move. It also reads that range for you. At the start of each period it notes which side of the CPR price opened on, draws one leve

The ADX ALARM indicator by Omega Total Trading has been designed so that whenever the ADX crosses the "Right_Value_ADX" upwards, a blue upward arrow is drawn on the chart. Conversely, when the ADX crosses it downwards, a red downward arrow is displayed. Whenever an upward or downward crossover occurs, notifications are sent via email ("Send_Email"), audible alerts are triggered on the chart ("Audible_Alerts"), and push notifications are sent to the mobile phone ("Push_Notifications"). The indica

TrendMatrix MTF See the trend across multiple timeframes at a glance. TrendMatrix MTF is a visual multi-timeframe trend-strength indicator for MetaTrader 4. It brings up to 15 trend readings into one compact color matrix , helping you see when different timeframes agree — or when they are moving in opposite directions. Instead of constantly switching between M15, H1 and H4 charts, TrendMatrix MTF lets you monitor the broader trend structure from a single chart. 3 Timeframes × 5 Trend Measuremen

MT4용 Crypto_Forex 지표 "브레이크아웃 바 패턴", 리페인트 및 지연 없음. .......................................................................................... - "브레이크아웃 바 패턴" 지표는 가격 변동 거래에 매우 강력한 지표입니다. - 지표는 차트에서 브레이크아웃 바 패턴을 감지합니다. - 상승 브레이크아웃 바 패턴 - 차트에 파란색 화살표 신호(그림 참조). - 하락 브레이크아웃 바 패턴 - 차트에 빨간색 화살표 신호(그림 참조). - PC, 모바일 및 이메일 알림 기능 제공. - "브레이크아웃 바 패턴" 지표는 지지/저항 레벨과 결합하기 매우 좋습니다. Click here to see high quality Trading Robots and Indicators! MQL5 웹사이트에서만 제공되는 오리지널 상품입니다.

Advanced Non-Repainting and Live Join-Line Engine This enhanced indicator introduces several important improvements designed to make signal behavior more stable, predictable, and efficient while preserving the core calculation and trading logic. Non-Repaint / Bar-Freeze Mode The Non-Repaint / Bar-Freeze Mode locks confirmed historical values once a candle has been completed. After a signal or calculated state has been confirmed, the indicator prevents that historical information from being modif

Candlestick Confluence Detector Candlestick Confluence Detector scores candlestick confluence across your chart and up to three higher timeframes — without manually cross-checking each one. It detects 16 classic price-action patterns, grouped into three dedicated engines: Rejection
Continuation
Warning Each pattern receives a 0–100 confluence score. Every label is traceable to a documented, user-adjustable rule set. KEY FEATURES • 16 candlestick patterns across 3 purpose-built engines: Rejecti

Most crossover indicators print an arrow and leave the rest to you. Where's the stop? When is the trade over? You end up running half the system in your head, and two people looking at the same arrow end up with two different results. T3 SSL Trend Signals runs the whole plan on the chart. Two T3 moving averages give the entry, an SSL channel and an ADX filter decide whether that entry is allowed, and every trade carries a stop, a target and an exit rule you can see. Where the usual T3 and SSL to

XAUUSD VWAP M15 est un indicateur spécialement optimisé pour le Gold (XAUUSD) en M15. Il combine le VWAP avec le momentum, la force du mouvement, le volume, la structure du marché et la distance en ATR afin d'identifier plus clairement les phases achetées, vendeuses et les changements de tendance.
Le VWAP change automatiquement de couleur : vert = domination acheteuse, rouge = vendeurs, blanc = équilibre, bleu = prise de contrôle/changement de tendance, orange = risque de retour. Il intègre ég

ULTRA ACCURATE Oscillator for MT4. UA 오실레이터 - EMA와 같은 추세 지표와 함께 사용할 경우 약 80%의 정확도를 제공하는 고급 맞춤형 Crypto_Forex 지표입니다. - 새로운 고급 계산 방식을 사용합니다. UA 오실레이터는 표준 MT4 오실레이터보다 훨씬 빠르고 정확합니다. - 차세대 오실레이터 - EMA10과 함께 사용하는 방법을 보여주는 그림을 참조하세요. - 과매도: 0.03 미만 // 과매수: 0.97 이상 - 이 지표를 사용하면 표준 전략도 업그레이드할 수 있는 기회가 많습니다. - 지표 설정은 매우 간단합니다. 주요 매개변수: 민감도 - 권장 값 범위: 0.4~0.8 - 모바일 및 PC 알림 기능 내장 Click here to see high quality Trading Robots and Indicators! 본 제품은 MQL5 웹사이트에서만 제공되는 정품입니다.

Vortex Confluence Radar MT4 Vortex Confluence Radar는 MetaTrader 4를 위해 네이티브로 개발된 멀티 오실레이터 컨플루언스 스코어링 엔진입니다. Relative Vigor Index(RVI), Commodity Channel Index(CCI), Williams % Percent Range(WPR) 등 3가지 핵심 기술적 지표를 결합하여 평활 시그널 라인과 자동 크로스오버 알림을 지원하는 통합 모멘텀 히스토그램을 제공합니다. 지표 구조 및 시각 신호 안내 본 지표는 별도의 보조창에서 작동하며 다음과 같은 시각적 요소를 정밀하게 표시합니다: 통합 컨플루언스 히스토그램 정규화 스코어링: RVI, CCI, Williams %R 값을 개별적으로 [-100, +100] 범위로 정규화한 후 사용자 설정 가중치에 따라 가중 평균을 산출합니다. 상승 모멘텀(라임그린 막대): 종합 스코어가 0보다 큰 경우 표시되며 매수세 우위를 나타냅니다. 하락 모멘텀
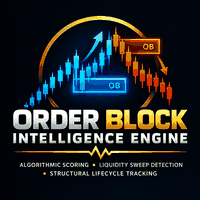
Order Block Intelligence Engine v1.02 Detects order block zones using confirmed swing structure, break-of-structure with displacement, and a multi-factor quality score. Tracks each zone through a five-state lifecycle and optionally projects a next target level. OVERVIEW The indicator identifies order block zones on the current chart timeframe. Each zone is defined by the origin candle (or base of consecutive candles) that preceded a break of structure, and by the swing point whose break confirme
MetaTrader 마켓은 개발자들이 거래 애플리케이션을 판매할 수 있는 간단하고 편리한 사이트이다.
제품을 게시하고 마켓용 제품 설명을 어떻게 준비하는가를 설명하는 데 도움이 됩니다. 마켓의 모든 애플리케이션은 암호화로 보호되며 구매자의 컴퓨터에서만 실행할 수 있습니다. 불법 복제는 불가능합니다.
