 MetaTrader 5
 Experts
 지표
 라이브러리
 유틸리티
 위젯
 규칙
MetaTrader 4용 기술 지표 - 175
 아래 나열된 기술 지표의 시그널은 MetaTrader 4 플랫폼의 거래를 열고 종료하는 데 중요한 역할을 합니다.
지표의 본질은 가격 변화를 예측하기 위한 금융 시그널 값의 수학적 변형입니다.

MT4용 Crypto_Forex 지표 "상대 손실률 Pro 디스플레이"는 유용한 거래 도구입니다. 그리드 트레이딩 시스템을 사용하는 트레이더라면 꼭 필요한 지표입니다!!! - 상대 손실률 Pro 디스플레이 지표는 현재 계좌의 상대적 손실률(DD) 또는 변동 이익을 %로 표시합니다. - PC 및 모바일 알림 기능이 내장되어 있으며, 트리거 레벨을 조정할 수 있습니다. - 해당 지표가 연결된 외환 통화쌍의 현재 스프레드와 스왑을 표시합니다. - 지표는 계좌 잔액, 자본금, 증거금도 표시합니다. - 차트의 어느 모서리에나 지표 값을 표시할 수 있습니다. - 색상 및 글꼴 크기도 설정할 수 있습니다. - 상대 손실률 디스플레이를 사용하면 더 이상 계산기가 필요하지 않습니다. Click here to see high quality Trading Robots and Indicators! 본 제품은 MQL5 웹사이트에서만 제공되는 정품입니다.

Obaforex Three Phase Map maps the master pattern (forex master pattern) market cycle on any chart similar to the Action Threshold Software (ATS): contraction (range), expansion and trend , the three phases every market repeats. It draws the contraction boxes, the average price (value) line, numbered expansion legs, liquidity lines and projected targets, with a higher-timeframe panel. It works on forex, gold, indices and crypto, on any timeframe, and does not repaint. It shows yo
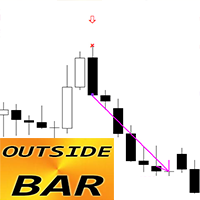
MT4용 Crypto_Forex 지표, 리페인트 및 지연 없음. .............................................................. - "OUTSIDE Bar" 지표는 가격 변동 거래에 매우 강력한 지표입니다. - 이 지표는 차트에서 OUTSIDE Bar 패턴을 감지합니다. - 상승 OUTSIDE Bar - 차트에 파란색 화살표 신호(그림 참조). - 하락 OUTSIDE Bar - 차트에 빨간색 화살표 신호(그림 참조). - PC, 모바일 및 이메일 알림 기능 제공. - "OUTSIDE Bar Pattern" 지표는 지지/저항 레벨과 함께 사용하기에 매우 좋습니다. Click here to see high quality Trading Robots and Indicators! 이 제품은 MQL5 웹사이트에서만 제공되는 오리지널 제품입니다.

The levels of higher timeframes, on the chart you are watching. LineTraderPro2 finds swing highs and lows with Dow Theory rules and draws horizontal lines at the levels the market watches, for any of 20 timeframes from M1 to W1. Each line is labeled with its timeframe (H1, D1 and so on) and the date of the swing, so you can see at a glance which timeframe a level belongs to without switching charts. What you see on the chart Horizontal lines: the swing highs above the price and the swing lows be

Stop Run은 MT4 및 MT5용 독립형 유동성 스윕·스톱런 지표입니다. 가격이 이전 스윙 고점 또는 저점을 꼬리로 돌파한 뒤 해당 스윕 레벨 안에서 마감한 봉을 표시합니다. 이러한 거부 움직임은 일반적으로 스톱 사냥 또는 유동성 회수라고 합니다.
이전 스윙 저점을 스윕한 후 레벨을 회복하면 강세 SR, 이전 스윙 고점을 스윕한 후 레벨을 회복하면 약세 SR 신호가 표시됩니다. 꼬리 거부 기준은 조정할 수 있으며 기본값은 봉 전체 범위의 약 25%입니다.
화살표, SR 텍스트 라벨 및 정보 패널을 표시할 수 있습니다. 새로 마감된 봉의 신호에 대해 Alert, Push, Sound 알림을 켤 수 있습니다. 스윙 강도, 조회 기간, 히스토리 깊이, 최대 마커 수, 꼬리 비율, 색상, 표시 및 알림 옵션을 제공합니다.
모든 종목과 시간 프레임에서 사용할 수 있습니다. DLL과 인터넷이 필요하지 않습니다. Stop Run은 거래하지 않으며 주문을 발주, 수정 또는 청산하지 않습

【Product Overview】 METATRADER 4 · INDICATOR Trend Contrarian How far has the current move already extended
within the broader trend?
An MT4 indicator that divides price movement into blocks of a fixed width and automatically records how many consecutive blocks have confirmed in the same direction.
It does not trade automatically. Placing orders is always down to you.
Auto-Adaptive Block width adjusts
to market conditions Continuous Tallying Shows streak-length
frequency instantly No Order

ReversalZones Pro — 동적 일일 변동성 및 반전 존 분석 지표 ReversalZones Pro 는 MetaTrader 4용으로 개발된 기관급 일중 변동성 및 피벗 예측 지표입니다. 이동평균선이나 오실레이터와 같은 기존의 후행성 지표와 달리, ReversalZones는 통계적 일일 변동 폭과 피보나치 비율을 기반으로 매일 장 개장 시 공급, 수요 및 평균 회귀 구역을 사전에 정확히 계산하여 표시합니다. 극단적인 과매수/과매도 구간에서 평균 회귀(역추세) 매매 를 선호하는 트레이더든, 돌파 후 추세 추종(순추세) 매매 를 선호하는 트레이더든, ReversalZones는 기관급 캔들 꼬리(Rejection) 필터링을 통해 리페인팅 없는 정확한 진입 신호를 제공합니다. 주요 기능 및 특징 지연 없는 예측형 존 매핑: 시장 개장 시 이전 일봉 변동 폭( $High_{D1} - Low_{D1}$ )과 피보나치 비율(38.2%, 61.8%, 100%)을 사용하여 당일의 핵심 레벨을

MQL5 블로그 : https://www.mql5.com/en/blogs/post/776450 MT4 버전 : https://www.mql5.com/en/market/product/198190 MT5 버전 : https://www.mql5.com/en/market/product/198191
MARKET DIRECTION [tambangEA]는 추세 방향, 모멘텀, 다중 시간대(multi-timeframe) 확인, 수급(Supply & Demand) 구간, 시장 구조, 리스크 관리 레벨, 거래 세션, 경제 뉴스 상황, 다중 심볼 모니터링 등을 하나의 통합 대시보드에 결합한 다층적 시장 분석 지표입니다. 이 지표는 체계적인 의사결정 지원 환경을 제공하도록 설계되었습니다. 단일 신호에 의존하는 대신, MARKET DIRECTION은 다양한 정보 계층을 제시하여 트레이더가 하나의 차트에서 시장 방향, 확인 사항, 상황 및 리스크를 종합적으로 평가할 수 있게 합니다. 외환(Forex),

Session Liquidity Confluence Pro Session Liquidity Confluence Pro is an MT4 chart-window indicator designed to map important Daily, Weekly, Monthly and trading-session High/Low levels in one place. The indicator combines multiple liquidity reference levels, merges levels that occur at the exact same price, classifies their confluence strength, and provides configurable alerts when price approaches or touches important confluence zones. This is not a trade signal generator . It is a liquidity and

CME Nexus Prime - Auction Market Theory & Volume Profile
CME Nexus Prime is an advanced analytical indicator for MetaTrader 4 combining Auction Market Theory, session volume profiling, structural reference levels, and volume participation analysis into a single interactive decision-support panel.
Note: This is an analysis tool only and does not execute trades automatically.
NEXUS RAIL INTERFACE The indicator features an interactive chart panel divided into four working sections: - LIVE: Sum

Automatic Fibonacci swing tool with one-click TP targets. Detects the main swing, inner swing and local swing, and projects TP1-TP4 from the current correction (50 / 61.8 / 75 / 100%). Auto Fibo Swing Target is an automatic Fibonacci tool that measures market swings for you and projects clear Take Profit targets from the current correction. No more dragging Fibonacci lines by hand - one click and the levels are on the chart, updated in real time as price develops.
HOW IT WORKS
The indicator fi

Ultimate Institutional Liquidity & Order Block Suite for MetaTrader 4 번역: MetaTrader 4용 궁극의 기관용 유동성 및 오더블록 수트) OB Finder 를 통해 당신의 트레이딩을 기관 투자자 수준으로 끌어올리세요. OB Finder는 실시간으로 진짜 기관 오더블록(Order Blocks / OB)과 공정가치 갭(Fair Value Gaps / FVG)을 정확히 찾아내도록 설계된 다중 타임프레임 Smart Money Concepts (SMC) 지표입니다. 수학적 디스플레이스먼트(Displacement) 계산, 기관 모멘텀 알고리즘, 상위 타임프레임 중첩 감지 기술을 통해 시장의 노이즈를 걸러내고, 승률 높은 공급 및 수요 구간을 차트에 직접 표시합니다. 모든 트레이더에게 이 도구가 필요한 이유 1. 자동 다중 종목 전환기 (인터랙티브 GUI 패널) 작업 공간 탭을 계속 전환하거나 여러 차트 창으로 화면을 어지럽힐 필요

AE SMC Zones Signal Pro marks the footprints of big money on your chart: Fair Value Gaps , Order Blocks and Breaker Blocks . It shows an arrow only when price actually reacts to a zone with a false breakout, a pin bar or a pivot reversal. FVG + Order Block + Breaker in one tool Arrows on closed candles Higher-TF zones on your working chart D1 trend filter Alert / Push / Email Signals for EAs All my products · Message me after purchase for setup help and a ready template Built on S
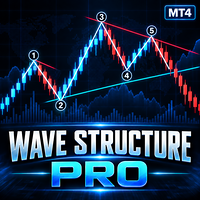
Wave Structure Pro is a technical analysis indicator for MetaTrader 4 designed to help traders identify market swings, wave structures, trend direction, dynamic trendlines and potential target levels directly on the chart. The indicator automatically analyzes price movement and presents the market structure in a clear visual format. It can be used on Forex, Gold, Indices, Commodities and other symbols available in MetaTrader 4. MAIN FEATURES • Automatic wave structure detection
• Automatic wave

AMD Nexus Prime - Market Structure & Liquidity Indicator
AMD Nexus Prime is a professional market structure indicator for MetaTrader designed to identify and visualize Accumulation, Manipulation, and Distribution (AMD) sequences directly on the chart.
The indicator processes confirmed bars, tracks range development, detects liquidity sweeps, and builds a reference trade model when a Distribution phase is confirmed.
Note: This is an analysis tool only. It does not open, modify, or close trad

MQL5 블로그: https://www.mql5.com/en/blogs/post/776607 MT4 버전: https://www.mql5.com/en/market/product/198437 MT5 버전: https://www.mql5.com/en/market/product/198438
GRAVITY MAGNET [tambangEA]는 트레이더가 가격이 다음에 어디로 끌릴 수 있는지, 그리고 매수 및 매도 유동성 세력 간의 힘이 얼마나 강한지 파악할 수 있도록 돕는 고급 시장 구조 및 유동성 인력(attraction) 지표입니다. 단일 추세 신호에 의존하는 대신, Gravity Magnet은 다수의 구조적 유동성 원천을 분석하여 강도, 거리, 최신성, 시장 상황(regime), 추세 맥락에 따라 순위를 매긴 뒤, 그 결과를 이해하기 쉬운 '시장 중력(Market Gravity)' 프레임워크로 변환합니다. 이 지표는 미래 가격 움직임을 예측하는 엔진이 아니라 의사 결정을 지원하는 도

WaveForce Mark is a panel indicator for manual chart markup and quick access to trading rules inside MetaTrader. Purpose
When market structure is already clear, you still need clean lines, labels, and a short checklist of rules. Mark keeps markup tools and text cards in one panel so you do not leave the chart. What you get Markup tab
Tools for drawing lines on the chart in a consistent panel style. Cleanup actions help you remove objects and keep the chart readable. Wave logic tab
Labels and hel

Ichi Nexus Prime - Adaptive Ichimoku Analysis for MT4
Ichi Nexus Prime is an advanced analytical indicator that combines the traditional Ichimoku framework with adaptive market calculations, multi-timeframe context, and structured risk visualization in one clean workspace.
Note: This is an analysis-only indicator and does not trade automatically.
CORE ENGINE The indicator operates in two calculation modes: - Classic Mode: Uses traditional, fixed Ichimoku periods. - Adaptive Mode: Dynamically

Nasdaq Signal Pro with Auto TP SL — MT4 진입, 익절 목표, 손절 기준을 하나의 나스닥 차트에서 확인하세요. Nasdaq Signal Pro는 MT4에서 나스닥100 현금지수 CFD의 재량 매매를 돕는 지표입니다. M5와 M15 차트에 BUY/SELL 후보 신호, 참고 진입가, 익절 목표(TP), 손절 기준(SL)을 표시합니다. 파란 패널에 신호, 시장 상태, 참고 가격을 모아 주문 전 확인할 정보를 정리합니다. 이 페이지는 MT4 버전입니다. MT5 버전은 별도 상품입니다. 지표가 자동으로 주문하거나 청산하거나 주문을 수정하지 않습니다. MT5 버전 보기 영구 라이선스 구매자 전용 증정 혜택 영구 라이선스 구매자에게 AI Zone Radar(MT5 버전)를 무료로 제공합니다. 별도의 지표로, 지지·저항 구간과 참고 강도 점수를 표시하여 주변 가격 구간을 살펴볼 수 있습니다. 구매 후 MQL5 메시지로 작성자에게 “AI Zone Radar bonus”

Hull Structure Pulse - Momentum & Market Structure System
Hull Structure Pulse is an analytical trading system that combines momentum (Hull Moving Average) with market structure (BOS and CHoCH). It provides 100% non-repainting signals, a multi-layered qualification engine, and an on-chart control panel.
SYSTEM OVERVIEW The indicator evaluates structural breakouts through a Qualification Engine. Signals are confirmed only when price meets strict criteria for momentum, volume, and targets. Mark

MT4용 Crypto_Forex 지표 "동적 과매수/과매수 구간을 포함하는 CCI" (재도색 불필요) - 상품 채널 지수(CCI)는 추세 방향으로의 모멘텀 트레이딩에 매우 유용합니다. - 동적인 과매수 구간에서 매도 진입을, 동적인 과매도 구간에서 매수 진입을 주요 추세 방향으로 유도하는 데 매우 유용합니다. - 이 지표는 가격 움직임 진입과도 결합하면 매우 유용합니다. - 동적인 과매수 구간 - 노란색 선 위. - 동적인 과매도 구간 - 파란색 선 아래. - CCI 오실레이터는 현재 가격과 과거 평균 가격의 차이를 측정합니다. - PC 및 모바일 알림 기능 제공. Click here to see high quality Trading Robots and Indicators! MQL5 웹사이트에서만 제공되는 오리지널 상품입니다.

MT4용 Crypto_Forex 지표 "TREND 히스토그램", 리페인트 불필요 - TREND 히스토그램 지표는 표준 이동 평균 교차 분석보다 훨씬 민감하고 효율적입니다. - 지표는 두 가지 색상으로 제공됩니다. 약세 추세는 노란색(금색), 강세 추세는 녹색(색상은 설정에서 변경 가능). - TREND 히스토그램에는 모바일 및 PC 알림 기능이 내장되어 있습니다. - 이 지표를 다른 거래 방식(가격 변동, VSA, 기타 지표)과 함께 사용하면 더욱 효과적입니다. .......................................................................... Click here to see high quality Trading Robots and Indicators! MQL5 웹사이트에서만 제공되는 오리지널 제품입니다.

TradeInfo Heatmap Edition es una herramienta profesional de análisis visual para MetaTrader 4, diseñada para transformar el seguimiento de tu rendimiento en una experiencia clara, rápida e intuitiva.
A diferencia de los informes tradicionales, este indicador consolida todo tu historial de trading en un panel gráfico dinámico directamente en tu gráfico, eliminando la necesidad de exportar datos a Excel o plataformas externas.
Funcionalidades Principales: • Matriz de Rendimiento Anual y Mensual

MT4를 위한 완전한 Smart Money Concepts 작업 공간: 시장 구조(BoS/CHoCH), 컨플루언스 점수를 갖춘 Liquidity Engine, FVG/Order Blocks, 볼륨 프로파일, 멀티 타임프레임 맥락, 그리고 차트 위 요약 - 모든 종목에서. SMC Master Structure는 원시 가격을 시장 구조와 유동성에 대한 깔끔하고 규칙 기반의 해석으로 바꿔줍니다. Smart Money Concepts 트레이더가 주시하는 스윙, 돌파, 불균형을 표시하고, 각 셋업을 컨플루언스로 점수화하며, 전체 그림을 하나의 차트에 정리해 둡니다 - 그리는 데가 아니라 판단하는 데 시간을 쓰도록. 주요 기능 시장 구조를 자동으로. 고점 상승 / 저점 상승, Break of Structure(BoS), Change of Character(CHoCH)를 봉 마감 시 감지하고 라벨링하며, 활성 구조 레벨을 항상 표시합니다. 컨플루언스 점수를 갖춘 Liquidity Engine(

ELLIOT NEXUS PRIME - Professional Multi-Degree Elliott Wave Analysis for MT4
Elliot Nexus Prime is an advanced Elliott Wave analytical indicator for MetaTrader 4, developed to transform complex wave structure into a clear, structured and actionable market map.
The indicator combines multi-degree Elliott Wave inference, structural analysis, Fibonacci projections, Primary/Alternate scenarios, market structure and two independent analytical signal frameworks inside one professional chart interfa

MT4용 Crypto_Forex 지표 "망치형 및 유성 패턴", 리페인트 및 지연 없음. ......................................................................................... - "망치형 및 유성 패턴" 지표는 가격 변동 거래에 매우 강력한 지표입니다. - 이 지표는 차트에서 강세 망치형 및 약세 유성 패턴을 감지합니다. - 강세 망치형 - 차트에 파란색 화살표 신호(그림 참조). - 약세 유성형 - 차트에 빨간색 화살표 신호(그림 참조). - PC, 모바일 및 이메일 알림 기능 제공. - "망치형 및 유성 패턴" 지표는 지지/저항선과 결합하기 매우 좋습니다. Click here to see high quality Trading Robots and Indicators! 이 제품은 MQL5 웹사이트에서만 제공되는 오리지널 상품입니다.

Gann Pulse는 MetaTrader 4용 리페인트 없는 추세 신호 지표입니다. 봉이 마감되면 명확한 매수(BUY) 또는 매도(SELL) 화살표를 표시하고, 진입 가격, 손절(Stop Loss), 세 개의 익절(Take Profit) 레벨을 즉시 그립니다. 이론 지식은 필요 없습니다. 차트에 적용하고 신호를 따르기만 하면 됩니다.
아이디어 W. D. 갠의 고전적인 규칙 중 두 가지는 "절대 추세에 역행하지 말라"와 "항상 손절로 거래를 보호하라"입니다. Gann Pulse는 두 가지를 모두 따릅니다. 독자적인 모멘텀 엔진이 시장의 맥박이 새로운 방향으로 바뀌는 순간을 포착하며, 모든 신호에는 완전한 거래 계획이 함께 제공됩니다.
주요 기능 - 매수·매도 화살표는 봉 마감 시 고정됩니다. 다시 그려지거나 이동하거나 사라지지 않습니다. - 현재 신호의 진입, 손절, TP1, TP2, TP3 라인. 도달한 레벨은 차트에 표시됩니다. - 히스토리 박스: 과거의 모든 신호가 pips

**Know exactly where your grid or martingale basket blows up – before you trade it.**
Grid and Martingale Risk Simulator is a visual what-if tool for traders who use grids, martingale, averaging or hedged baskets. Place virtual BUY and SELL orders directly on the chart, drag them to any price, and the indicator recalculates your simulated account in real time: Balance, Equity, Margin, Free Margin, Margin Level, the Margin Call price and the Stop Out price.
The indicator never opens, modifies

Gaps는 상위 타임프레임이 남긴 레벨을 거래하는 어느 차트에든 그려 줍니다. 맵은 브로커의 일봉에서 만들어지므로 1분 차트와 4시간 차트에 같은 레벨이 같은 위치에 표시됩니다. 월봉, 주봉, 일봉 기반의 4가지 레벨 유형 페어 밸류 갭, 윅 존, 임밸런스, 오버랩을 각각 차트 위의 존으로 그립니다. 레벨은 마감된 캔들에서만 만들어집니다. 과거로 거슬러 다시 그려지지 않습니다. 월봉, 주봉, 일봉 레벨은 명확한 계층을 유지해 차트를 읽기 쉽게 해 줍니다. 보고 싶은 가장 작은 존의 크기를 설정할 수 있습니다. 존의 동작 방식 존은 가격이 그 존을 분명하게 통과할 때까지 맵에 남아 있으며, 그 후 차트에서 모양이 바뀌고 나중에 맵에서 사라집니다. 같은 자리에 더 강한 존이 생기면 그 존에 자리를 내줄 수도 있습니다. 표시되는 동안 그 가격은 절대 움직이지 않습니다. 존이 겹치는 곳에서는 더 중요한 존이 표시됩니다. 다른 존은 사라지는 것이 아니라 잠시 보류되며, 자리가 비면 원래 가격

BBMA REENTRY — SNR + DOTLINE + FIBO MUSANG 1. Tentukan Arah Trend Pastikan setup Reentry yang dicari searah dengan Trend Filter pada Panel . Utamakan BUY saat trend bullish dan SELL saat trend bearish . Hindari Reentry yang berlawanan dengan trend utama. 2. Cari Reentry pada Time Frame Besar Cari titik BBMA Reentry ketika candle masuk atau menyentuh area MA5/10 High atau MA5/10 Low . Time Frame besar menjadi acuan utama untuk menentukan area Reentry. 3. Gunakan Time Frame Konfirmasi yang Lebi

MT4 켈리 기준 리스크 관리 패널
켈리 기준에 기반한 포지션 사이징 및 리스크 감사 도구입니다. 현재 심볼의 청산된 거래 내역을 읽어 실제 승률과 손익비를 계산하고, 이를 세 가지 실행 가능한 숫자로 변환합니다: 최대 몇 랏까지 열 수 있는지, 손절을 얼마나 넓게 둘 수 있는지, 현재 얼마의 리스크를 지고 있는지. 표시 전용이며 주문하지 않습니다.
패널 표시 내용
【역사적 거래 통계】 현재 승률, 현재 패률(승/패 횟수 포함) 손익비(평균 이익 ÷ 평균 손실) 통계 표본, 표본 신뢰도(부족/낮음/중간/높음)
【손절 설정】 계산 방식(과거 평균 / 고정 설정) 과거 평균 손실 거리(가격 + 포인트 두 단위) 과거 평균 손익비(평균 이익/평균 손실 금액 포함) 적용 손절 거리, 익절 목표 배수
【계좌 리스크 정보】 계좌 잔고, 계좌 자산(equity) 켈리 리스크

MT4용 Crypto_Forex 지표 MACD 시그널 미터. - 매우 유용한 MACD 시그널 미터 지표는 7개 시간대의 현재 MACD 값(시그널 라인 위/아래)을 동시에 보여줍니다. - 녹색 사각형 - MACD가 시그널 라인 위에 있습니다. - 빨간색 사각형 - MACD가 시그널 라인 아래에 있습니다. - 외환 지표 MACD 시그널 미터는 다중 시간대 거래 시스템의 거래 진입 필터로 사용할 수 있습니다. ............................................................................. Click here to see high quality Trading Robots and Indicators! 이 제품은 MQL5 웹사이트에서만 제공되는 정품 제품입니다.

SMC Scanner – User Guide
Overview
SMC Scanner is a multi-symbol, multi-timeframe dashboard for MetaTrader 5. Every cell shows the key Smart Money Concepts state of one symbol on one timeframe. You can scan the whole market at a glance instead of opening every chart.
The SMC engine inside the scanner uses the same calculation logic as the Smart Market Structure Concepts chart indicator. With the same settings, each cell shows what the chart indicator would show on that symbol and timeframe.

See the market's fear level on the chart you trade. VixChecker shows the VIX (the volatility index often called the fear index) in a sub-window as one bar per day, colored by level: normal (blue), caution (yellow, 20 or above by default) and fear (red, 30 or above). The current value, the change from the previous close and the time of the value are shown in a small panel, and the value can also be shown on the main chart. Where the VIX values come from (please read before buying) The indicator d

MQL5 블로그 : https://www.mql5.com/en/blogs/post/776740 MT4 버전 : https://www.mql5.com/en/market/product/199000 MT5 버전 : https://www.mql5.com/en/market/product/199001
SUPPORT RESISTANCE PROFILE [tambangEA]는 가격 구조, 거래량 프로파일(Volume Profile) 분석, 변동성, 가격 거부(rejection) 움직임 및 레벨 간 상호작용 통계를 결합하여 동적 지지 및 저항 수준을 식별, 평가 및 순위화하도록 설계된 고급 시장 구조 지표입니다. 단순히 스윙 고점과 저점에만 의존하는 기존의 지지/저항 지표와 달리, SUPPORT RESISTANCE PROFILE은 프로파일 기반의 검증 단계를 추가하여 일반적인 피벗(pivot) 지점과 시장 반응이 나타날 가능성이 더 높은 핵심 구역을 구별할 수 있게 해줍니다. 이 지표는 시장 상황

Round numbers on your chart, and a notice when the price gets close. RoundNumberAlert draws horizontal lines at round numbers (150.000, 150.500 ...) and watches them for you. When the price enters the touch range, only that line blinks and you get one notification. Major round numbers stand out in gold, and a small panel shows how many pips are left to the next round number above and below. Features Round-number lines: the step starts at 10 pips (for example 50 pips: 150.000, 150.500 ...). Major

Entry signals as finger marks: yellow for trend-following, pink for counter-trend. SignRAMB combines RSI, ATR, MACD, a moving average, Dow theory and the candles, and marks the places where the price may turn up or down, based on past chart patterns. A finger pointing up is a buy, pointing down is a sell. Signals are decided on closed bars and never repaint. Signals are not always right. Use them as one indicator, together with your own reading of the chart. They are meant for the move right aft

Welcome Please note that I am currently uploading all my precious indicators. (It takes time with all the files, names, pics etc.) Feel free to ask questions.
This indicator works on all TFs and instruments, from AUDCAD to Gold (Any vehicle).
When price runs into one of these lines, then we would assume a reversal might happen. For Binary Options:
Imagine there is 2min 23 sec remaining of the chart candle, price hit the S/R line, then trade the remainder time.this chart is an M5 chart when pr

MT4 용 Crypto_Forex 지표 'Acceleration Bar Pro ' - 강력한 추세 포착 가능. - 'Acceleration Bar Pro' 지표는 추세 매매에 매우 강력한 도구로, 횡보장(flat market)의 영향을 최소화합니다. - 강세 가속 바(Bullish Acceleration Bar, 파란색): 차트상의 바(bar) 중 최고가(Max)가 이전 5개 바의 최고가보다 높고, 최저가(Min)가 다음 5개 바의 최저가보다 낮은 바를 의미합니다. - 약세 가속 바(Bearish Acceleration Bar, 빨간색): 차트상의 바(bar) 중 최저가(Min)가 이전 5개 바의 최저가보다 낮고, 최고가(Max)가 다음 5개 바의 최고가보다 높은 바를 의미합니다. - PC 및 모바일 알림 기능 제공. - 정보 표시(Info Display) 기능: 지표가 적용된 외환(Forex) 쌍의 현재 스프레드(Spread)와 스왑(Swap) 정보를 표시합니다. - 정보 표시창

MarketFlow Indies MarketFlow Indies is a clean MT5 chart indicator designed to help traders read directional flow, confirmed Buy/Sell signals, market structure, reaction zones, and spread information in one simple visual workspace. The indicator focuses on chart clarity. Signals are displayed directly on the main chart with compact Buy and Sell labels, colored flow lines, optional structure marks, and a small dashboard for quick signal review. Expert Version MT5 : https://www.mql5.com/en/market

Which currency is strong right now — in one panel. CurrencyStrength takes the RSI of the 28 pairs of USD, EUR, JPY, GBP, AUD, CHF, CAD and NZD, turns it into a score from −100 to +100 for each currency, and shows them as bars, strongest first. Features Strength ranking: strong currencies in green, weak ones in red, scored from −100 to +100. Automatic symbol detection: the pairs are found from each symbol's base and profit currency, so suffixes and prefixes (EURUSD#, EURUSD.pro, m.EURUSD, EURUSDm

OHLC Timeframes Osw
OHLC Timeframes Osw는 현재 차트에 직접 최대 4개의 상위 타임프레임의 시가(Open), 고가(High), 저가(Low), 종가(Close) 주요 레벨을 명확하고 정확하게 투영하도록 설계된 필수 멀티 타임프레임 지표입니다. Price Action 및 ICT 트레이더가 유동성 포인트, 기관 지지 및 저항을 완벽한 시각적 제어와 즉각적인 보기 전환을 위한 통합 인터랙티브 버튼을 통해 식별할 수 있게 해줍니다.
매개변수 가이드 (입력 메뉴) 타임프레임 설정 (Timeframe 1 ~ 4) - Timeframe: 분석할 상위 타임프레임 선택 (예: 월간, 주간, 일간, H4). - Read Backwards: 현재 레벨과 비교하기 위해 그래프로 표시할 과거 기간 수. - Extend Lines: 차트 미래로의 레벨 라인 연장 길이. - Show Open / High / Low / Close: 각 레벨의 가시성 제어 (숨기기, 현재만,

Liquidity Hunter is a liquidity and market structure indicator for MT4 and MT5 that only keeps the levels nobody has taken yet. A swing high stops being drawn on the bar that trades through it. Yesterday's high disappears the moment price clears it. What's left on the chart is the stops that are still sitting there. That matters more than it sounds. On GBPUSD H1 from January 2020 to September 2026, 97.8% of daily highs and lows were taken out, and half of them within about 14 hours of the new da

Volume Divergence Pro shows whether volume confirms the trend and marks regular and hidden divergences on price and indicator. Volume Divergence Pro measures the direction of price with linear regression over a fast and a slow window, and checks whether trading volume is supporting that move or fading away from it. Swings in the indicator are compared with swings in price to find divergences, which are drawn both in the indicator window and directly on the candles. How it works
The fast regressi

CISD - Change in State of Delivery indicator for MetaTrader 4. In Smart Money Concepts (SMC) and ICT methodology, a Change in State of Delivery (CISD) marks the moment price stops delivering in one direction and starts delivering in the other. It is often the first confirmation of a market structure shift (MSS) or change of character (CHoCH), and it usually appears before a classic break of structure (BOS) forms. This indicator detects CISD objectively on any symbol and timeframe, and shows the

SMT Divergence Multi Pair compares the swing highs and swing lows of the chart symbol with up to two correlated symbols and marks the places where they disagree. This is the Smart Money Technique (SMT) divergence used in ICT and Smart Money Concepts analysis: one market moves beyond a previous high or low while its correlated market does not confirm the move. How it works The indicator finds confirmed swing highs and swing lows on the chart symbol and compares each new swing with the previous on

Wave Markers: 적응형 웨이브 맵과 멀티 타임프레임 대시보드 노이즈가 아닌 시장의 진짜 구조를 보세요. 확정된 스윙 고점과 저점, 이를 잇는 추세선, 그리고 M1부터 W1까지 모든 시간대의 상황을 하나의 패널에서 확인할 수 있습니다. 이 인디케이터는 무엇인가요 Wave Markers는 MetaTrader 5용 차트 구조 인디케이터입니다. 가격의 전환점(스윙 고점과 스윙 저점)을 찾아 깔끔한 화살표로 표시하고, 그 주변에 실용적인 도구를 제공합니다. 추세선, 전체 시간대 표, 그리고 실시간 스프레드와 스왑 표시입니다. "매수"나 "매도" 지시는 내리지 않으며, 어떤 결과도 약속하지 않습니다. 한 가지 일을 꼼꼼하게 합니다. 시장이 실제로 어디에서 반전했는지 보여 주어, 구조를 더 빠르고 일관되게 읽을 수 있도록 돕습니다. MT5-version: https://www.mql5.com/en/market/product/199158 흔한 ZigZag와 다른 이유 전통적인 ZigZa

Auction Flow Pro — 시장 상황을 명확하게 Auction Flow Pro는 볼륨 프로파일, 시장 활동 히트맵, 유동성 구역, VWAP를 깔끔한 MetaTrader 5 작업 화면에 통합합니다. 시장 상황을 평가하고, 잠재적인 기회를 검토하며, 중요한 가격 구역을 명확하게 확인하려는 트레이더를 위한 제품입니다. 정보를 정리한 차트와 크기 및 위치를 조절할 수 있는 소형 대시보드를 제공합니다. 필요한 정보를 확인하면서 표시 설정을 자신의 작업 방식에 맞게 조정할 수 있습니다. 가격 움직임의 배경 확인 가격 움직임은 주변 시장 상황과 함께 볼 때 평가하기 쉽습니다. Auction Flow Pro는 서로 보완하는 여러 관점을 한 화면에 표시하여 활동이 집중되는 위치, 기준 수준 대비 가격의 위치, 주목할 만한 인접 구역을 살펴볼 수 있도록 돕습니다. 차트 분석, 거래 세션 준비, 형성 중인 셋업 검토에 활용할 수 있습니다. 유용한 정보를 정리하여 신중한 판단을 지원하는 것이 목적

MQL5 블로그 = https://www.mql5.com/en/blogs/post/776873 MT4 버전 = https://www.mql5.com/en/market/product/199357 MT5 버전 = https://www.mql5.com/en/market/product/199358
Pressure Breakout [tambangEA]는 가격 압력(price-pressure) 패턴을 식별하고, 해당 패턴 내의 방향성 우위를 평가하며, 캔들 윗꼬리/아랫꼬리(wick) 움직임, 변동성, 거래량 지표(volume proxy), 가격 확장 등을 체계적으로 조합하여 돌파(breakout)를 확인하도록 설계된 전문 MetaTrader 지표입니다. 단일 캔들에 반응하는 대신, 이 지표는 설정 가능한 기간(window) 내에서 조건에 부합하는 꼬리(wick) 형성 캔들의 연속성을 파악하고, 압력 구간(pressure zone)을 생성 및 모니터링한 뒤, 우세한 압력 방향과 일치하는 돌파

RSI Panel Pro is a multi-timeframe RSI indicator for MetaTrader 4 that combines the traditional RSI, RSI EMA Signal, Momentum, an EMA trend filter, and an MTF summary panel. Its goal is to provide a quick overview of momentum, RSI levels, multi-timeframe trends, and the latest signals without the need to constantly switch between timeframes.
This indicator is best suited as a tool for signal confirmation and market context filtering; a single RSI signal should not be used as the sole basis for

Headline. One Entry. No Guesswork.
Subheadline
Three EMAs confirm the trend. MACD filters the noise. The steepness arrow fires your entry. That arrow is the only signal you'll ever act on.
THE PROBLEM
You've been here before.
You see a trend forming. You enter. It reverses.
You wait for confirmation. The move is already gone.
You pile on indicators. You get more signals. You get more confusion. You get more losses.
The problem isn't you. The problem is you have too many signals and none o

### Vertex Pulse MT4: Precision HYBRID Indicator
**Vertex Pulse** is an institutional-grade hybrid indicator engineered specifically for MetaTrader MT4. A volatility-adapted hybrid indicator for MetaTrader MT4 (Vertex Pulse) that pairs Average True Range (ATR) volatility expansion bands paired with tick volume surge filters to signal high-probability swing and momentum entries with real-time multi-bar execution signals and on-chart signal markers and terminal alerts.
---
### Key Capabilities

Confluence Meter: 26개 지표를 하나의 종합 레이팅으로 Confluence Meter 는 인기 있는 26개 지표의 신호를 계산해 "매도 / 중립 / 매수"라는 간단한 레이팅으로 종합해 줍니다. 수십 개의 창을 열어 수치를 직접 비교할 필요가 없습니다. 패널을 한 번만 보면 선택한 시간대에서 시장이 어느 쪽으로 기울어 있는지 알 수 있습니다. MT5-version: https://www.mql5.com/en/market/product/199466
Our products: https://www.mql5.com/en/users/trendhunter/seller 차트에 표시되는 내용 Oscillators 게이지. 11개 오실레이터의 레이팅입니다. RSI, Stochastic, CCI, ADX, Awesome Oscillator, Momentum, MACD, Stochastic RSI, Williams %R, Bulls/Bears Power, Ultimate Oscillat

Similar to the Sieera chart, the channel indicator is quite good. It can be applied to foreign exchange, gold, silver, and stock index futures. Using a 30-day SMA cycle, the outer track is 1.8 and the inner track is 1.4. Similar to the Sieera chart, the channel indicator is quite good. It can be applied to foreign exchange, gold, silver, and stock index futures. Using a 30-day SMA cycle, the outer track is 1.8 and the inner track is 1.4.

1. Descripción general
OTT Awesome Oscillator Alarm es un indicador para MetaTrader 4 (MT4) diseñado para detectar y alertar sobre
señales alcistas y bajistas basadas en el Awesome Oscillator (AO). El indicador incorpora tres estrategias
clásicas: Zero Line Crossover, Saucer y Twin Peaks.
Además de las señales visuales mediante flechas, el indicador puede generar avisos mediante ventana
emergente, sonido y notificación Push. El sistema está pensado para trabajar con la última vela cerrada y

Welcome Please note that I am currently uploading all my precious indicators. (It takes time with all the files, names, pics etc.) Feel free to ask questions.
Smart Volatility Matrix is an advanced multi-preset technical indicator designed for MetaTrader 4, engineered to map out market volatility dynamics across 9 distinct parameter blocks simultaneously in a clean separate window.
Overview Navigating changing market conditions requires more than a single moving average or standard band. The

Trend Consensus는 10개의 이동평균선을 두 개의 타임프레임에서 추세 방향에 대한 하나의 명확한 투표로 바꿉니다. 두 타임프레임이 일치하면 리페인트 없는 진입점을 표시하고 ATR 기반의 TP1, TP2, TP3 및 스톱을 설정하며, 차트의 과거 신호가 각각 어떻게 끝났는지 기록합니다. 내장 기능: 히스토리 통계, 멀티 심볼 스캐너, 푸시 및 이메일 알림, 그리고 EA에서 바로 사용할 수 있는 버퍼. 작동 방식 Trend Consensus는 매 바마다 10개의 단순 이동평균선(기간 5~14)에 하나의 질문을 합니다. 상승 중인가, 하락 중인가? 상승하는 이동평균선의 비율이 추세 합의(콘센서스)이며, 퍼센트와 10칸 막대로 표시됩니다. 투표는 두 타임프레임에서 동시에 진행됩니다. 로컬 타임프레임 : 사용자의 작업 차트로, 진입 타이밍을 정합니다. 글로벌 타임프레임 : 한 단계 위의 타임프레임으로, 방향을 확인합니다. 자동 선택: M5 → H1, M15 → H4, M30 → H

My Trading Checklist helps you bring structure to one of trading’s most demanding tasks: following your own rules consistently when money and emotions are involved. Trading involves probabilities. There is no “holy grail” system that can guarantee a 100% win rate. Even a carefully researched strategy can produce losing trades and uncomfortable losing sequences. The aim is to combine a strategy with positive expected value after trading costs with disciplined money and risk management, then apply

하루 또는 세션마다 볼륨 프로파일을 그려 거래량이 어느 가격에서 발생했는지를 하루하루 보여 주며, 각 프로파일의 POC, 밸류 에어리어 고점과 밸류 에어리어 저점 , 그리고 시장이 아직 다시 찾아가지 않은 네이키드 POC 를 날짜와 가격과 함께 오른쪽 끝까지 표시합니다. 모든 타임프레임에서 일분봉으로 계산하므로 M5에서도 H4에서도 레벨이 같고, 끝난 날의 레벨은 움직이지 않습니다. 그리는 내용 일별 프로파일 , 또는 거래 세션별 프로파일을 기본값으로 최근 10개 그립니다 ("Profiles drawn on the chart"): 가격별 거래량은 캔들 뒤의 히스토그램으로, 밸류 에어리어는 불씨 색으로, 나머지는 차분한 회색으로 표시합니다. POC (포인트 오브 컨트롤, 거래량이 가장 많이 발생한 가격)는 실선으로, 밸류 에어리어 고점과 저점 은 점선으로 그립니다. 네이키드 POC : 끝난 날의 POC 중 이후 어느 봉도 터치하지 않은 것은 날짜와 가격과 함께 오른쪽 끝까지 계속 그려

ALMA Trend Target is an ALMA-based trend identification system that combines slope-normalized momentum confirmation with standard deviation band validation to determine trend state, and automatically generates a complete position planning framework on each trend flip including a structure-derived stop loss, R-multiple take profit targets with proximity highlighting, and a risk zone visualization that tracks target hits and stop events throughout the position's active lifecycle. How It Works ALM

Welcome Please note that I am currently uploading all my precious indicators. (It takes time with all the files, names, pics etc.) Feel free to ask questions.
FX777 Markov Heatmap V35 is an institutional-grade analytical indicator designed for MetaTrader 4, built around advanced multi-factor quantitative modeling and Markov state transition matrices to map out market regime shifts in real time[cite: 12].
Core Logic & Strategy: How to Use It Professional price action and Smart Money traders k

Welcome Please note that I am currently uploading all my precious indicators. (It takes time with all the files, names, pics etc.) Feel free to ask questions.
FX777 QUANTUM RSI: Sovereign Quantum Stability v8.0 Overview Step into the next tier of institutional-grade technical analysis with FX777 Quantum RSI (v8.0) . Moving far beyond traditional, lagging indicator models, this subwindow masterpiece integrates dynamic volatility-based gates with an advanced Persistence Engine , filtering out f

Welcome Please note that I am currently uploading all my precious indicators. (It takes time with all the files, names, pics etc.) Feel free to ask questions.
FX777 Iceberg Reversal V3 – Sales Description Overview The FX777 Iceberg Reversal V3 is an advanced MetaTrader 4 indicator built upon the FX777 Master Trading Protocol . Designed for elite precision, it identifies institutional order flow absorption, liquidity traps, and dynamic mean reversion extremes to deliver high-probability revers

Momentum Intelligence — MT4 Is the move gaining strength or running out of momentum? Momentum Intelligence brings market momentum and local structure onto one chart. A smooth price-linked gauge shows the current state, a histogram shows how it develops, and BUY/SELL arrows mark confirmed local structure changes. Use it to follow the move and identify when price confirmation appears. What you see on the chart A gauge anchored to a historical candle and the current price makes direction and changi

Reversal Intelligence — MT4 Spotting a potential reversal and knowing when it is confirmed are two different tasks. Reversal Intelligence puts both on your chart: a preparation zone, BUY/SELL confirmation and the LOW/HIGH extreme boundary. Choose a more active search, classic selection or an additional embedded trained-model filter through three operating modes. What you see on the chart Preparation zones help you notice a developing reversal setup. BUY/SELL confirmation follows a candle close b

Market Projection Pro — MT4 Want to visualize how the price cycles in your chosen chart section could extend? Market Projection Pro analyzes a historical window you select, extracts cycle components and draws a composite projection to its right. You control the source window and forward horizon to compare the scenario with price structure and potential turning zones. What you see on the chart Interactive boundaries let you select a historical analysis window directly on the chart. Cycle componen

Reversal Edge System은 MetaTrader 4已推出。 잠재적인 추세 반전 구역을 감지하고 명확한 거래 신호를 생성하며, 다중 타임프레임 추세 분석으로 신호를 필터링해 实例 인디케매수 강세 매도 약세 매수 성향 약세 매도 성향 매수매도 의견 충돌 请注意,请注意以下事项: 인디케ք에 내장된 신호 백테스팅 기능은 핵심 지표인 승률과 총 신호 수를 계산하며, 트레더는 차트에서 직접 과거 성과를 시각적으로 확인할 수 있습니다。 주요 기능: 고점저점 반전 신호 다중 타임프레임(MTF) 추세 확인 필터 실시간 시장 심리 라벨 모든 신호에 방익실현 및 손절 포함 신호 백테스팅 시뮬레션 승률 및 총 신호 수 통계 외환, 암호화폐, 지수, 상품 지원 재그리기 없는 알림 검증된 반전 세팅과 내장 위험 통제로 더 스마트하게 거래하고 거래 우위를 확보하세요。

Institutional Checklist You know your rules. The difficult part is following them when you want the trade. The market starts moving. One indicator looks convincing. Another disagrees. You feel the pressure to act—and suddenly, the conditions you carefully defined yesterday become negotiable today. Institutional Checklist brings your attention back to your process. This interactive indicator for MetaTrader 4 guides you through your own analysis, one component at a time, then combines your answers

Trendlines drawn for you — and a good shape kept as your basis. TrendLineSnap finds the swing highs and swing lows on your chart, joins them and draws one high trendline and one low trendline. Triangles, channels, wedges and horizontal levels used in line trading show up as lines. Automatic trendlines are redrawn whenever a new swing forms. When you see a shape you want to trade, save it. The saved line does not move. When the price comes near it again, show the saved line next to the current li

Where is the price inside the range — in one panel. BoxRangeSnap looks for price zones where the highs and lows touched the same top and bottom again and again, and draws them as a big box and a small box. The panel keeps showing the distance from the price to the top and bottom of the current box. Features Automatic range boxes: a big box and a small box, newest first. The current box is highlighted and extends to the last closed bar. Adjustable detection: minimum touches on the top and bottom,
MetaTrader 마켓은 개발자들이 거래 애플리케이션을 판매할 수 있는 간단하고 편리한 사이트이다.
제품을 게시하고 마켓용 제품 설명을 어떻게 준비하는가를 설명하는 데 도움이 됩니다. 마켓의 모든 애플리케이션은 암호화로 보호되며 구매자의 컴퓨터에서만 실행할 수 있습니다. 불법 복제는 불가능합니다.
