MetaTrader 4용 기술 지표 - 123

The Hero Line Trend indicator was developed to help you determine the trend direction by drawing channels on the graphical screen. It draws all channels that can be trending autonomously. It helps you determine the direction of your trend. This indicator makes it easy for you to implement your strategies. The indicator has Down trend lines and Up trend lines. You can determine the price direction according to the multiplicity of the trend lines. For example , if the Down trend lines start to

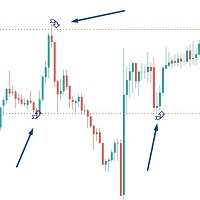
The technical indicator "Reversal patterns" is a mathematical interpretation of the classic reversal patterns: Pin Bar, Harami and Engulfing. That is, the "reversal bar", "Harami" and "Absorption". This indicator allows you to determine the moment of reversal of quotes based on market dynamics and the winner between the "bulls" and "bears".
The indicator displays the moment of reversal at the local highs and lows of the chart of any timeframe, which allows you to increase the accuracy of the s
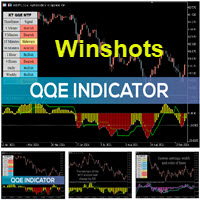
The Qualitative Quantitative Estimation (QQE) indicator is a technical analysis tool developed for the MetaTrader 4 (MT4) trading platform. It is designed to help traders identify potential trend reversals and to determine the strength of a current trend. The QQE indicator is calculated based on the Relative Strength Index (RSI) and Moving Average (MA) indicators. The RSI is used to determine the momentum of price movements, while the MA is used to smooth out the price data and identify trends.
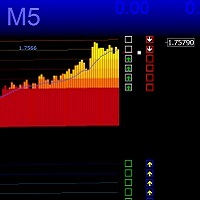
Канал TMA формирует расчёт зеркальным методом, что позволяет плавно компенсировать пробойные удары и точнее определять разворот, канал имеет дополнительную защиту от сужения, канал имеет ускоритель направляющей с заданными настройками, сигналы появляются на возврате направляющей линии, Версия MTF 2023 позволяет индивидуально настраивать канал на другие временные рамки и разные инструменты, возможны доработки, рекомендуется Gold M1 M5
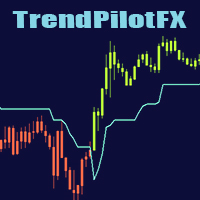
This Mql4 indicator smooths the trend by changing candle colors without altering their size, allowing for better price action reading. It also includes a trend line for trade entry and exit points. Smooth out market trends and improve your price action reading with this powerful Mql4 indicator. Unlike Heikin Ashi, this indicator changes candle colors without altering their size, providing you with a clearer picture of market movements. In addition, it includes a trend line that traders can rely

The product Divergence Macd Obv Rvi Ao Rsi is designed to find the differences between indicators and price. It allows you to open orders or set trends using these differences. The indicator has 4 different divergence features. To View Our Other Products Go to the link: Other Products
Divergence types Class A Divergence Class B Divergence Class C Divergence Hidden Divergence
Product Features and Rec ommendations There are 5 indicators on the indicator Indicators = Macd Obv Rvi Ao Rsi 4 diffe
Ultimate Harmonic Patterns 인식 표시기에 오신 것을 환영합니다. Gartley 패턴, Bat 패턴 및 Cypher 패턴은 트레이더가 시장에서 잠재적 반전 지점을 식별하는 데 사용하는 인기 있는 기술 분석 도구입니다.
Ultimate Harmonic Patterns recognition Indicator는 고급 알고리즘을 사용하여 시장을 스캔하고 이러한 패턴을 실시간으로 식별하는 강력한 도구입니다.
Ultimate Harmonic Patterns 인식 지표를 사용하면 이러한 인기 패턴을 기반으로 잠재적인 거래 기회를 빠르고 쉽게 식별할 수 있습니다.
*구매 후 저에게 연락하시면 지침 및 단계 안내를 보내드립니다.
MT5 버전 : Ultimate Harmonic Patterns MT5 이 지표는 주요 피보나치 되돌림 수준과 함께 차트의 패턴을 표시하여 잠재적인 진입점과 퇴장점을 쉽게 식별할 수 있도록 합니다.
또한 지표에는 다양한 사용자 지정 옵션이
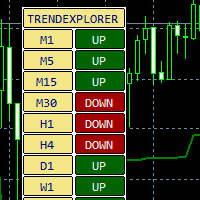
An indicator of the trend direction of a trading instrument on different timeframes. The author's method of calculating the trend is used.
You can enable and disable different timeframes.
Suitable for working with currency pairs, stocks, futures, cryptocurrencies.
Settings:
ATR Multiplier - ATR multiplier; ATR Period - ATR indicator period; ATR Max Bars (Max 10.000) - Number of bars to calculate; Candle shift to Calculate - Report start bar; On/Off Timeframe M1 - Enable different t

WARNING: PRICE IS SUBJECT TO RISE AT ANY TIME. GET YOUR COPY TODAY TO AVOID MORE COST! Dear Traders I am so glad to introduce to you my other tool called the Forex Sniper Entries Indicator. This tool is designed to help serious traders and investors capture big moves in the currency price movements. The philosophy behind this tool is all about winning big and riding the price movement from its beginning until the maximum point. We want to capture those big moves in both down and up markets as mu
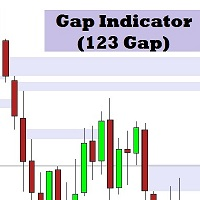
갭 지표 (123 갭): 잠재적 가격 목표를 식별하는 정밀 도구 갭 지표 (123 갭)는 시장 구조를 기반으로 높은 확률의 가격 목표를 식별하도록 설계된 강력한 도구입니다. 연속된 3개의 캔들 세트를 분석하여 이 지표는 종종 가격 움직임의 자석 역할을 하는 중요한 갭을 찾아냅니다. 작동 방식 지속적 분석 : 차트의 모든 연속 3개 캔들 세트를 스캔합니다. 갭 식별 : 각 세트의 첫 번째와 세 번째 캔들 사이의 갭을 계산합니다. 시각적 표현 : 식별된 갭은 쉽게 해석할 수 있도록 색상 코드화되어 차트에 표시됩니다. 주요 이점 잠재적 반전 예측 : 트렌드 반전 후 가격이 돌아올 수 있는 영역을 강조 표시합니다. 리트레이스먼트 목표 식별 : 리트레이스먼트 중 가격이 일시 정지할 수 있는 수준을 지적합니다. 거래 진입 및 퇴출 개선 : 갭 수준을 사용하여 진입 및 퇴출 지점을 정교화합니다. 실제 예시 하락 트렌드 시나리오에서: 첫 번째 캔들의 저가: 1.0000 세 번째 캔들의 고가: 0.

"Price reversal arrows" Forex indicator, which shows price reversal points on an hourly chart (PERIOD_H1) with arrows, is one of the most popular tools for traders in the Forex market. This indicator is used to identify the most likely price reversal points, which can help traders make better trading decisions. The "Price reversal arrows" indicator works on the basis of various mathematical algorithms and formulas that analyze data on previous price movements in the market. At the same time, th

This Indicator will notified you when time to entry into the market, build with double william percent range strategy. --> Buy Notification will flag with the blue arrow --> Sell Notification will flag with the red arrow After Flag Appear, the market usually explode but carefully you must performs double check because weakness of this indicator when in the end of the trend
This Indicator will notified you when market going to trend reversal, build with candlestick pattern strategy
--> Sell Reversal Notification will flag with the Yellow arrow
--> Buy Reversal Notification will flag with the Pink arrow
After Flag Appear, the market usually reverse but carefully you must performs double check because weakness of this indicator when market in the middle of the trend
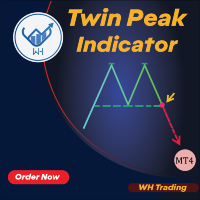
Twin Peak Indicator MT4에 오신 것을 환영합니다 --(Double Top/Bottom)-- Double Top and Bottom Indicator는 시장에서 잠재적인 반전 패턴을 식별하도록 설계된 기술 분석 도구입니다.
가격이 거의 같은 높이의 연속적인 고점 또는 저점을 만든 다음 반대 방향으로 가격이 움직이는 영역을 식별합니다.
이 패턴은 시장이 모멘텀을 잃고 있으며 추세 반전에 대비할 수 있음을 나타냅니다.
특징:
자동 차트 주석: 표시기는 차트에서 이중 상단 및 하단 패턴을 자동으로 표시합니다. 사용하기 쉬움: 지표는 사용자 친화적이며 MT5 플랫폼의 모든 차트에 쉽게 적용할 수 있습니다. 사용자 지정 가능: 표시기에는 사용자 지정 가능한 설정이 있습니다. 경고 시스템. 모든 악기에서 작동합니다. 이 지표는 다른 기술 분석 도구와 함께 사용하여 추세의 방향과 반전 패턴의 잠재적 강도를 확인할 수 있습니다. 전반적으로 Double Top and Bo

매우 간단하지만 효과적인 지표입니다.
Ichimoku 지표의 KijunSen 라인과 이 라인의 평균 MA를 기반으로 합니다. 매수 또는 매도 신호: 이것은 두 선의 교차점입니다!!!
나는 종종 Ichimoku 지표의 KijunSen 라인을 거래에 사용합니다. 가격이 높으면 판매만 낮으면 구매만 고려합니다.
그리고 기준선을 평균화하여 기준선 MA선을 형성한 후 두 선의 교차점이 나타나 매매 신호가 증폭된 것으로 해석할 수 있다.
지표의 MT5 버전 링크:
https://www.mql5.com/ru/market/product/96160
지표 매개변수:
기준센 - 기준센의 계산 기간입니다.
KijunSen_MA - KijunSen MA의 계산 기간입니다.
MethodMA - KijunSen MA의 가격을 계산하는 방법입니다.
Expert Advisors와의 통신을 위한 표시기 버퍼.
버퍼 번호에서. 0은 지표의 KijunSen 라인입니다.
버퍼 #1에는 지표의

M1 GPT Scalping is a turnkey trading tool for scalping strategy in the financial markets. This indicator is used to detect entry and exit points of positions on charts with a period of M1 (one minute).
M1 GPT Scalping works based on the analysis of price data and technical analysis indicators. The indicator displays arrows on the chart showing the points of entry and exit from positions. The accuracy of the indicator is 85-90%.
The scalping strategy using M1 GPT Scalper is to open an order fo

Real Pro Signal indicator is designed for signal trading. This indicator generates trend signals.
It uses many algorithms and indicators to generate this signal. It tries to generate a signal from the points with the highest trend potential.
This indicator is a complete trading product. This indicator does not need any additional indicators.
The indicator certainly does not repaint. The point at which the signal is given does not change.
Features and Suggestions Time Frame: H1 Works
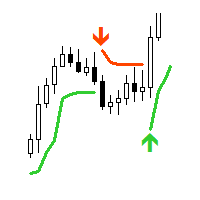
"AV SuperTrend" is an indicator for MetaTrader 4. The supertrend indicator is popular for determining the trend and positioning stops or as trailing support. I use this indicator in several expert advisors for trend analysis.
Supertrend indicator signals can be selected in the form of entry arrows and notifications, as well as various sounds.
Settings :
- Period
- Multiplier
- Alert buy signal: arrow color
- Alert sell signal: arrow color
- Alert yes/no
- Sound: choice or no
- Email yes/no

Binary Options Trading Indicator: A Reliable Tool for Your Trades This indicator is specifically designed for binary options trading and has proven its high quality, reliability, and adequate accuracy, depending on the dynamics of the chart. Key Points: Signal Interpretation: When a blue cross signal appears, it indicates a potential entry into a trade, though it is considered a weak signal on its own. However, if the blue cross is accompanied by an arrow, it is considered a more reliable buy s

Short-Term Trading Indicator: The Foundation of Your Successful Strategy This tool is designed for pips and scalping in the financial markets. It can serve as an excellent starting point for creating your own trading strategy. Features: No Repainting Signals: The indicator provides reliable signals that do not change after they are generated. Signals appear on the next candle after the event that triggered them. Excellent Signals in High Volatility Conditions: When there is good volatility on t

Simple supply and demand indicator which should help identify and visualize S&D zones. Settings:
Color for supply zones, color for demand zones - default colors are set for dark (black) background.
Number of how much zones should be created above and below current price - value "3" means there will be 3 zones above current price and 3 zones below current price. Principle:
When price creates "V", reversal zone is registered. Rectangle filled based on zone type (supply / demand) is drawn if price
Indicator for Binary Options Without Repainting: A Reliable Tool for Traders This indicator serves as a powerful tool for traders, providing reliable signals that do not change after they are generated. Features: No Repainting Signals: The indicator guarantees stable and trustworthy signals that remain unchanged after formation. Expiration Time: Signals appear at the opening of a candle and expire within one candle of the current timeframe. Overlapping Method: In the event of a losing trade, it

Perfect Cross Arrows indicator is designed for signal trading. This indicator generates trend signals.
It uses many algorithms and indicators to generate this signal. It tries to generate a signal from the points with the highest trend potential.
This indicator is a complete trading product. This indicator does not need any additional indicators.
The indicator certainly does not repaint. The point at which the signal is given does not change. Signals are sent at the beginning of new candle
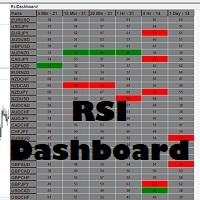
Never miss when a pair is being oversold or overbought again!! This RSI dashboard allows you to monitor RSI levels on 6 different time frames for up to 30 different currency pairs. This dashboard is packed with features including: 1. Monitoring of 6 customizable time frames (M1, M5, M15, M30, H1, H4, D1, W1, M1) 2. You can set the overbought/oversold levels you want for EACH time frame and they will be highlighted in the dashboard when a pair gets to that level
3. You can also set the RSI period

이 지표는 하루 중 거래 활동이 가장 많은 시간을 결정하도록 설계되었습니다. 이 계산 후 지표는 가장 중요한 거래 수준을 구축합니다. 이러한 수준을 실제 가격 움직임과 비교하면 시장 추세의 강도와 방향에 대한 정보를 얻을 수 있습니다.
지표의 특징 기간은 D1 미만이어야 합니다. 권장 기간: M15, M30 및 H1. H1 이상의 시간대는 매우 대략적인 그림을 제공할 수 있습니다. 그리고 M15 미만의 기간을 사용하면 짧은 거래 폭증으로 이어질 수 있습니다. 지표는 과거 데이터에 민감합니다. 따라서 차트 창에 최소 50,000개 이상의 막대를 설정하는 것이 좋습니다.
표시기 매개변수 Base - 거래 활동을 계산하기 위한 기준 기간을 설정합니다. day - 거래 활동은 시간을 고려하여 계산됩니다. week – 거래 활동은 시간과 요일을 고려하여 계산됩니다.
Width - 선 너비. ClrMean, ClrUp 및 ClrDn은 중간, 상위 및 하위 거래 수준의 색상입니다. Sty
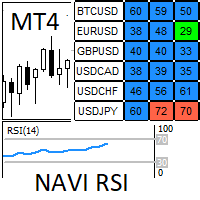
Navi RSI: 각 기호와 해당 시간 프레임에서 상대 강도 지수의 신호를 과매수 또는 과매도로 검색합니다. 우리는 차트를 매우 편안하게 탐색하며 많은 시간을 절약합니다. 시각적 신호 및 경보는 RSI가 과매수 및 과매도 구역에 있을 때 발생합니다. 시각적 신호 및 경보는 심볼 및 타임프레임 모두에서 독립적이며, 우리가 자리에 있지 않을 때 모바일 경보를 관리하는 데 매우 유용합니다. 입력 매개 변수: 스케일 및 위치: 1.1) 코너 선택 - 패널을 위치시킬 화면 모서리 선택. 1.2) 위치 X - 모서리에서의 X 거리. 1.3) 위치 Y - 모서리에서의 Y 거리. 1.4) 열 너비 - 열의 너비. 1.5) 행 높이 - 행의 높이. 1.6) 글꼴 크기 - 텍스트 크기. 스캔 시간: 2.1) 모드 (onTick/onTime) - 각 새 틱에서 데이터를 업데이트하거나 초 단위 시간 주기로 데이터를 업데이트합니다. 2.2) Refresh onTime (seconds) - 모드가 onTi
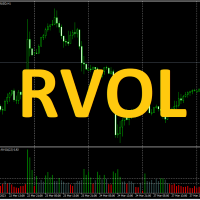
What is the RVOL Indicator?
It is well established that volume (including tick volume) is a valuable indicator of trader commitment to a price movement. The challenge with using volume for intraday trading is that there is a general cycle of increasing and decreasing volume associated with the different regional trading sessions. The Relative Volume, or RVOL, indicator helps to overcome this by comparing the current volume with the average volume for that time of day, calculated over a period o

Use my recommended broker: https://icmarkets.com/?camp=61478 You have most likely heard about the term "Less is more". I can tell you one thing that's also the case with the Monkey RSI on Bollinger indicator! One indicator will give you the best of both worlds, easy to determine trend, the strength of the trend and overbought and oversold levels. This indicator is very simple to follow: Green line uptrend Red line downtrend Above band overbought Below band oversold With this indicator you cou

Introducing Daily Hedge - Your Advanced Custom Hedge System for Forex Trading Unleash the Power of Daily Hedge - Your Ultimate Trading Companion Experience the next level of trading sophistication with Daily Hedge, an advanced custom hedge system designed to revolutionize your Forex trading experience. With its cutting-edge features and intelligent algorithms, Daily Hedge empowers you to make informed decisions and seize profitable opportunities like never before. Unlocking Advanced Trading Str

Great Strong System indicator is designed for signal trading. This indicator generates trend signals.
It uses many algorithms and indicators to generate this signal. It tries to generate a signal from the points with the highest trend potential.
This indicator is a complete trading product. This indicator does not need any additional indicators.
The indicator certainly does not repaint. The point at which the signal is given does not change.
Features and Suggestions Time Frame: H1 Wo

This Indicator is use the ZigZag to calculate the Upper and Lower Bound and the uptrend and the downtrned. Red for downtrend, Green for uptrend and Yellow is for the horizontal trend this horizontal trend also bookmarked the upper limited and the lower limited the the price swings. Or in simple the Support and the Resistance level. However, You may use the Heikin Ashi to confirm the trend of the buy sell signal above. I cannot guarantee the win rate, Nevertheless, you must study well the timef
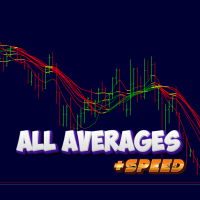
Perhaps you have previously read in technical analysis books about such a concept as "market slope", or "trend slope". Metatrader has such a tool as "trend line by angle". But when working on auto-scaled charts, this tool becomes completely abstract, and as a consequence, useless. The idea of this new parameter, included in the AllAverages_Speed indicator, is to give such a concept as "trend slope" specific numerical values, as well as the further use of the new parameter in work.
Modifica

uGenesys AI - 90% Accurate Daytrading Indicator
Introducing the ultimate forex trading indicator system, uGenesys AI, powered by cutting-edge AI technology and advanced analytical techniques, including Time-Series Analysis and Genetic Algorithms. Our AI-powered trading system leverages the power of time-series analysis to identify trends and patterns in historical price data, allowing traders to make informed predictions about future market movements. By analyzing vast amounts of data, our syst

How to trade with this indicator: when it draws a red arrow - we open deals for sale. when it draws a blue arrow, we open buy deals.
Master Trend Pro - predicts the future direction of the price using regression smoothing of the standard moving average. The indicator with an arrow shows where the price will move with a high probability. This indicator is suitable for trading with a scalping strategy on M1 and M5 timeframes. If the indicator drew a blue arrow and then started drawing a red arro
This is a simple arrow system based on MACD indicators Main/Base line and MACD Levels. It gives you alerts when MACD's Main Line crosses above/below certain level. Which type of alerts available? 1. It paints on chart Up/Down Arrows. 2. Popup message and sound alert in trading terminal window. 3. Push notification or Alert on your android and ios mobile phones (requires MT4 or MT5 app installed!)

This is a simple arrow system based on Engulfing Candlestick Pattern. It gives you alerts on your smartphone when there is an engulfing candlestick pattern happens. Which type of alerts available? 1. It paints on chart Up/Down Arrows. 2. Popup message and sound alert in trading terminal window. 3. Push notification or Alert on your Android and IOS mobile phones (requires MT4 or MT5 app installed!) *Note: Use it on higher timeframes like H4 (4 hours), D1 (1 Day) then find trade opportunities on s
Amazing Pro Signal indicator is designed for signal trading. This indicator generates trend signals.
It uses many algorithms and indicators to generate this signal. It tries to generate a signal from the points with the highest trend potential.
This indicator is a complete trading product. This indicator does not need any additional indicators.
The indicator certainly does not repaint. The point at which the signal is given does not change.
Features and Suggestions Time Frame: H1 Wor

Netsrac "Supply and Demand Easy" is a small but highly specialized tool for quickly finding supply & demand zones without frills. It shows the next supply and demand zone in the current timeframe. Highly efficient and fast. Works perfectly with the Netsrac "Supply and Demand Dashboard" (https://www.mql5.com/en/market/product/96511 ) Controls
Variable Description (SD01) Supply color Set your color for supply zones (default is LightCoral) (SD02) Demand color Set your color for demand zones (defau
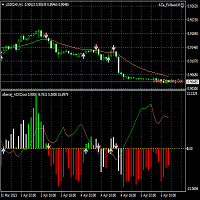
Indicador basado en ADX que permite apreciar fácilmente las señales de entrada y salida (cruces de D+ y D-) y si se producen en tendencia o sin ella. Además informa del spread actual y del tiempo de barra restante, en la ventana principal del gráfico Los inputs, time-frames, etc y la configuración es sencilla para el usuario. Muy útil por su aspecto y colorido, diferente al habitual de este indicador.

This is a very useful Oscillator based on ADX Crosses plus Double Keltner Channels Crosses too (evolution from my own indicators/oscillator ACE ADXCrosses and ACE ADXCrossOnChart). Features Colored histogram shows D+/D- crosses on trend (green up/salmon down or without trend (white) based on ADX main (over ADXon level -ie. 24-). Signals (arrows) shows high probability orders (long/short) based on D+/D- crosses. Color line (green/salmon) shows ADX main less ADXon level (ie: ADX main - 24) for tr
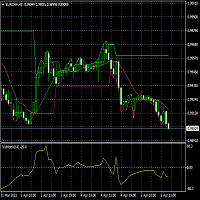
Background : Indicator On Chart based on my own oscillator ACe_Vector2016. As you can appreciate, this indicator draws two bands on the chart in order to identify long and short opportunities. When the momentum vector oscillator (ACe_Vector2016) crosses the zero line, the indicator On Chart draws a long/short signal (green/red arrow). Also you can identify the trend line on chart (MA): green colour if trend is moving up, and red colour if trend is moving down. This indicator draw up and down non

Real Strong Entry indicator is designed for signal trading. This indicator generates trend signals.
It uses many algorithms and indicators to generate this signal. It tries to generate a signal from the points with the highest trend potential.
This indicator is a complete trading product. This indicator does not need any additional indicators.
The indicator certainly does not repaint. The point at which the signal is given does not change.
Features and Suggestions Time Frame: H1 Work

Contact me after payment to send you the User-Manual PDF File.
Double Top/Bottom Pattern
Double top and bottom patterns are chart patterns that occur when the underlying investment moves in a similar pattern to the letter "W" (double bottom) or "M" (double top). Double top and bottom analysis are used in technical analysis to explain movements in a security or other investment, and can be used as part of a trading strategy to exploit recurring patterns. Searching for this pattern among the cha
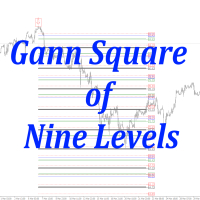
The only one of its kind square 9 indicator that corresponds to the real situation on Gannzilla! The indicator calculates price levels by Square 9 and dates by Square 9. All price and time levels are 100% consistent with the location on Square 9 (Gannzila). This tool will be a great solution for determining the price and time levels using the methods of the legendary trader William Delbert Gann.

Indicator ICT Implied Fair Value Gap (IFVG) is an important part of the Smart Money Concepts (SMC) system. It looks for and shows on the chart a modern pattern - the Fair Value Gap ( FVG ). This pattern is a three candlestick imbalance formation based on the discovery of a mismatch between supply and demand. This happens when the price moves quickly in one direction without encountering resistance. The result is a "gap", which can be filled in later. The indicator finds this pattern using the up

This indicator is based the principle of breakout candle. Every candle that breaks out from the cluster may not lead to a rally. There are various factors that determine how a breakout candle will behave. This indicator calculates all those factors to suggest BUY/SELL signal once a breakout happens. This is a universal indicator that can work for all kind of instruments eg stock, currency, oil, crypto etc. This also works in every timeframe. PARAMETERS ================= move = 20 strongCandle =
The Volume com indicator is an indicator in which the price movement control mode is organized using tick volumes. Volume com indicator gives signals that can be filtered and get a good result The main advantage of the signals of this indicator is that they appear both at the end of the trend and along its course. The indicator works on all timeframe. The first indicator in the series .

The Volume Str indicator is an indicator based on tick volumes. The very name of the indicator "Volume Street" indicates the use and sorting of volumes. according to a certain algorithm, which leads to a good result at the output. Look at the screenshots and you will see what signals it gives. The indicator does not redraw and you can use its signals after the first bar closes.
The Symphonie Sentiment Indicator is a technical analysis tool used in MetaTrader 4 (MT4) trading platform that helps traders identify market sentiment based on a combination of different indicators. The indicator is designed to provide a comprehensive view of the market by analyzing multiple timeframes and displaying the results in an easy-to-read format. It combines a variety of technical indicators, such as moving averages, oscillators, and trendlines, to generate trading signals that can hel
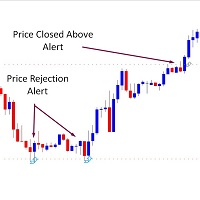
*** Introductory Offer! *** Ends soon - do not miss it! The Price Alerts 3 in 1 Indicator is part of my suite of Price and Trendline Alerts Indicators. I'm excited to introduce the Price Alerts 3 in 1 Indicator – part of my new suite of Price and Trendline Alert Indicators – fantastic tools designed to: … alerts you when 1. candles close above or below significant prices 2. price breaks above or below significant prices 3. price rejects significant prices in the markets you trade. With t
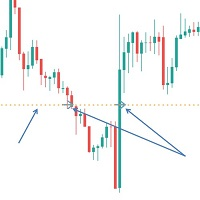
*** Introductory Offer! *** Ends soon - do not miss it! The Price Break Alerts Indicator is part of my suite of Price and Trendline Alerts Indicators .
I'm excited to introduce the Price Break Alerts Indicator – part of my new suite of Price and Trendline Alert Indicators – fantastic tools designed to alert you of any significant prices in the markets you trade. With this indicator, you can set up to 4 price alerts on any asset, allowing you to quickly spot any significant price breakouts, w

Volume mag indicator is another indicator that is used to calculate entry points tick volume. The indicator rarely gives a signal, but this can be said to be its advantage. The indicator's signals are not redrawn and do not lag, but are issued after the close of the current candle. The indicator does not overload the terminal and calculates entry points within the BarsCount value, which is set in the menu, by default 500 bar.
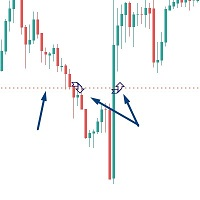
*** Introductory Offer! *** Ends soon - do not miss it! The Close Above or Below Price Indicator is part of my suite of Price and Trendline Alerts Indicators. I'm excited to introduce the Close Above or Below Price Indicator – part of my new suite of Price and Trendline Alert Indicators – fantastic tools designed to alert you when candles close above or below significant prices in the markets you trade. With this indicator, you can set up to 4 price alerts on any asset, allowing you to quic
*** Introductory Offer! *** Ends soon - do not miss it! The Price Rejection Alerts Indicator is part of my suite of Price and Trendline Alerts Indicators. I'm excited to introduce the Price Rejection Alerts Indicator – part of my new suite of Price and Trendline Alert Indicators – fantastic tools designed to alert you when candles close above or below significant prices in the markets you trade. With this indicator, you can set up to 4 price alerts on any asset, allowing you to quickly spo
The Volume New indicator is the main indicator for calculating direction of price movement by tick volumes. The indicator generates the maximum number of signals that it is possible to filter according to your strategies. The indicator does not redraw or lag and generates a signal according to the settings SIGNALBAR values, default 1 - after the close of the current candle. The number of history bars for calculation is set in the indicator menu by the value BarsCount, default is 500 bars.
거래 전략을 강화하세요 Nadaraya Watson Envelope Alert MT4 는 비모수 커널 회귀를 활용한 최첨단 지표로, 부드럽고 적응형 트렌드 분석을 제공합니다. Nadaraya-Watson 추정기에서 영감을 받은 이 도구는 가격 데이터에 가우시안 커널 평활화를 적용하여 시장 변동성에 적응하는 동적 엔벨로프를 생성하지만, 전통적인 이동 평균의 과도한 지연은 없습니다. TradingView와 같은 플랫폼에서 널리 인정받고 전 세계 트레이더로부터 반전 발견의 정확성으로 찬사를 받는 Nadaraya Watson Envelope는 2022년 이후 인기가 급증하며 Bollinger Bands의 우수한 대안으로 자리 잡았습니다. 비재도장 모드는 실시간 신뢰할 수 있는 신호를 보장하며, 재도장 옵션은 깊이 있는 분석을 위한 울트라 부드러운 시각을 제공합니다. 트레이더들은 Nadaraya Watson Envelope를 트렌드 강도, 과매수/과매도 조건, 잠재적 반전 포인트를 놀라운

Master Precision Trading with Wamek Trend Consult Stop guessing and start trading with confidence. Wamek Trend Consult is your advanced toolkit for pinpointing high-probability market entries and minimizing false signals —no matter your strategy. Why Traders Choose Wamek Trend Consult Laser-Sharp Trend Detection Our proprietary algorithms identify early reversals and continuation trends with surgical precision, filtering out market noise to deliver actionable signals. Tailored to Your Stra

거래 정밀도를 높이세요. Candlestick Pattern Alert MT4 지표는 주요 캔들 패턴을 신속히 감지하고 실시간 알림을 제공하는 강력한 도구로, 높은 확률의 설정에 트레이더가 대응할 수 있도록 합니다. 1990년대 스티브 니슨에 의해 대중화된 일본 캔들 차트 원리에 기반한 이 지표는 해머, 도지, 엔굴핑 같은 패턴을 통해 시장 심리를 해독하는 능력으로 외환, 암호화폐, 주식 트레이더들에게 사랑받습니다. 수동 분석을 간소화하여 시간을 절약하고, 정확성을 높이며, 기회 손실을 줄입니다—EURUSD, BTCUSD, XAUUSD 같은 변동성 시장에서 트렌드 반전이나 지속을 활용하려는 스캘퍼, 데이 트레이더, 스윙 트레이더에게 완벽합니다. Candlestick Pattern Alert MT4는 즉각적인 패턴 인식을 위해 차트에 녹색(매수)과 적색(매도) 화살표를 오버레이하며, 명확성을 위해 사용자 정의 텍스트 레이블(기본 크기 7, 오프셋 20%)을 제공합니다. 14가지 주요
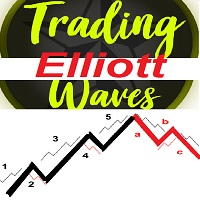
A simple Approach to Elliot waves patterns Signal generated on trend continuation when breaking the "5" level or on corrective direction after 1-5 waves detected 1-5 labeled points arrows used for signal UP/DOWN direction Chaotic patterns in Blue are drawn all times until a 1-5 Elliot wave pattern detected 1-5 Red pattern in Bull Market : UP arrow in BULL trend continuation OR DOWN arrow as a reversal DOWN direction as pattern correction 1-5 Green pattern in Bear Market :DOWN arrow in BEAR tr
Check My Product Contact me to discover all my services
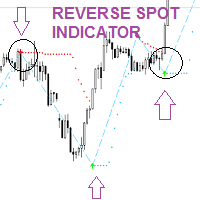
Reverse Spot is an indicator that can help you find and identify possible price reverse zones. This indicator can be used both as a trend continuation signal after a small period of consolidation or retracement and as a trend change signal.
Reverse spot is a very easy to use indicator and thanks to the signals it sends with the arrows it is easy for the trader to identify moments in which to evaluate his own operations.
Reverse Spot
This is a modern MACD indicator based on regular MACD indicator. It also has alert system included. This indicator gives you alerts when base line of MACD indicator crosses above or below Zero level so you can look for Buy or Sell opportunity. Available Alerts: 1. Audible Alerts on Chart / Trading Terminal window. 2. Alerts on your email. 3. Alerts on your mobile phone. Type of Alerts Explained: 1. Audible_Chart_Alerts - Audible alerts and Popup message on your compu

after getting indic ator cont act me for Bonus E a. Non Repaint TMA channel with special conditioned arrows on price cross of channel lines plus market Volatility factor, which makes product much more accurate than any usual tma channel indicators. It is proven to be profitable with Ea built based on it which you will get as a BONUS in case of indicator purchase. Good luck.
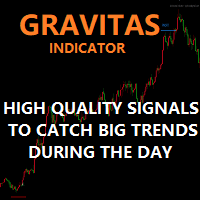
Gravitas indicator – High quality / Non-repainting Signals for day trading
If you are sick and tired of not being profitable each month or you simply want a safe earning while you are studying the markets or while you practice and master your strategy give this indicator a try. I called this indicator “Gravitas” as indication of seriousness and importance that trading is for me and respect for the market and the other traders involved in it. I developed it last
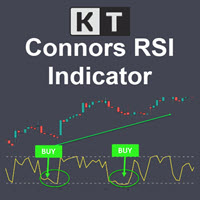
KT Connors RSI is a modified and more advanced version of the original Connors RSI developed by Larry Connors. It was designed to help traders generate trade signals based on short-term price movements.
The Connors combine the standard RSI calculation with two additional elements: a short-term RSI, ROC, and a moving average.
Features Provides more transparent and more actionable buy and sell signals using the overbought/oversold zones. Incorporates short-term RSI and moving average, providing

You can change the time period of the chart at the touch of a button. You can also change multiple charts at the touch of a button. You can also change multiple charts at the touch of a button, saving you the trouble of changing time periods.
We are live-streaming the actual operation of the system. https://www.youtube.com/@ganesha_forex
We do not guarantee your investment results. Investments should be made at your own risk. We sharll not be liable for any disadvantage or damage caused by th
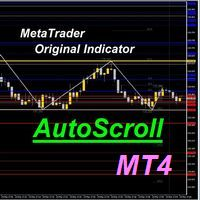
AutoScroll automatically scrolls the chart by the set width (pips). You can see the next milestone without having to operate the chart yourself. You can concentrate on trading.
We are live-streaming the actual operation of the system. Please check for yourself if it is usable. Please check it out for yourself. https://www.youtube.com/@ganesha_forex
We do not guarantee your investment results. Investments should be made at your own risk. We sharll not be liable for any disadvantage or damage c
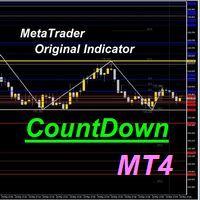
The time until the end of the bar is counted down. Therefore, you can time your order while watching the chart. You can concentrate on your trading.
We are live-streaming the actual operation of the system. Please check for yourself if it is usable. Please check it out for yourself. https://www.youtube.com/@ganesha_forex
We do not guarantee your investment results. Investments should be made at your own risk. We sharll not be liable for any disadvantage or damage caused by the use of the info

Fibonacci automatically draws Fibonacci retracement, Because Fibonacci automatically draws Fibonacci retracement, you can know at a glance the price to buy at a push or sell back. Therefore, you can trade in favorable conditions in a trending market.
We are live-streaming the actual operation of the system. Please check for yourself if it is usable. Please check it out for yourself. https://www.youtube.com/@ganesha_forex
We do not guarantee your investment results. Investments should be made

The chart pattern is automatically drawn. It also automatically tells you the price at which you are most likely to buy or sell according to the pattern. Therefore, there is no need to memorize patterns or draw lines by yourself.
We are live-streaming the actual operation of the system. Please check for yourself if it is usable. Please check it out for yourself. https://www.youtube.com/@ganesha_forex
We do not guarantee your investment results. Investments should be made at your own risk. We

The system automatically draws resistance and support lines, The system automatically draws resistance and support lines, so you can see at a glance the price range where you are most likely to encounter resistance. Therefore, you can trade in price zones where you are less likely to encounter resistance.
We are live-streaming the actual operation of the system. Please check for yourself if it is usable. Please check it out for yourself. https://www.youtube.com/@ganesha_forex
We do not guaran
MetaTrader 마켓 - 거래자를 위한 로봇 및 기술 지표는 거래 터미널에서 바로 사용할 수 있습니다.
The MQL5.community 결제 시스템은 MQL5.com 사이트의 모든 등록된 사용자가 MetaTrader 서비스에서 트랜잭션을 수행할 수 있습니다. 여러분께서는 WebMoney, 페이팔, 또는 은행 카드를 통해 자금을 예치하거나 인출하실 수 있습니다.
트레이딩 기회를 놓치고 있어요:
- 무료 트레이딩 앱
- 복사용 8,000 이상의 시그널
- 금융 시장 개척을 위한 경제 뉴스
등록
로그인
계정이 없으시면, 가입하십시오
MQL5.com 웹사이트에 로그인을 하기 위해 쿠키를 허용하십시오.
브라우저에서 필요한 설정을 활성화하시지 않으면, 로그인할 수 없습니다.