MetaTrader 4용 기술 지표 - 10
거래량 분해 지수 (VDI) VDI 는 거래량을 매수와 매도로 분해하여 가격 움직임의 강도와 방향을 식별하기 위해 개발된 독자적인 거래량 분석 지표입니다. 이 지표는 캔들스틱의 가격 데이터를 거래량에 투영하여 매수와 매도의 비율을 시각화합니다. 이를 통해 트레이더는 시장 활동에 대해 더 포괄적으로 이해할 수 있으며, 매수와 매도에 의한 거래량이 각각 얼마인지 파악할 수 있습니다. 계산은 거래소에서 제공하는 모든 가능한 데이터를 기반으로 수행되어, 분석적 완성도가 높고 시장 추세를 깊이 있게 평가할 수 있습니다. 거래량에 대한 지식은 시장 가격 움직임을 이해하는 데 있어 핵심 요소입니다. 이 지표는 바로 그 정보를 제공합니다.
주요 특징 조정 가능한 단일 매개변수 — period (기본값 = 18), 몇 개의 봉을 기준으로 매수 및 매도 거래량을 계산할지 설정합니다. 주요 계산 공식:
매수 거래량 / 매도 거래량
선택한 구간 내에서 매수와 매도 중 어느 쪽이 우세한지 평가할 수 있
FREE

Did You Have A Profitable Trade But Suddenly Reversed? In a solid strategy, exiting a trade is equally important as entering.
Exit EDGE helps maximize your current trade profit and avoid turning winning trades to losers.
Never Miss An Exit Signal Again
Monitor all pairs and timeframes in just 1 chart www.mql5.com/en/blogs/post/726558
How To Trade You can close your open trades as soon as you receive a signal
Close your Buy orders if you receive an Exit Buy Signal. Close your Sell orders if

This indicator finds Three Drives patterns. The Three Drives pattern is a 6-point reversal pattern characterised by a series of higher highs or lower lows that complete at a 127% or 161.8% Fibonacci extension. It signals that the market is exhausted and a reversal can happen. [ Installation Guide | Update Guide | Troubleshooting | FAQ | All Products ] Customizable pattern sizes
Customizable colors and sizes
Customizable breakout periods Customizable 1-2-3 and 0-A-B ratios
It implements visual/s
FREE

UR 감마 (머신 러닝 시스템에서 발견되는 유사한 계산으로 구동됨)
UR Gamma는 기존 WaveTrend 지표에 새롭고 향상된 기능을 제공하는 최첨단 재무 분석 도구입니다. 고급 디지털 신호 처리 기술을 통합함으로써 UR 감마는 기존 WaveTrend 알고리즘의 일부 제한 사항을 해결하고 가격 움직임의 추세를 식별하고 측정하기 위한 보다 정확하고 강력하며 역동적인 접근 방식을 제공합니다.
UR 감마 사용의 이점:
최소한의 설정 모든 데이터는 백그라운드에서 계산되고 있으며 사용자를 위한 출력은 단 1개로 명확하고 깔끔합니다. 피로를 암시하는 배경 수준 모든 종류의 자산에 맞게 조정됩니다. 도구 업데이트를 최신 상태로 유지하고 빠진 것이 있다고 생각되면 요청을 보낼 수 있는 특별한 텔레그램 채팅이 있습니다!
왜 UR 감마인가?
목표는 확률 분포가 -1과 1 사이에서 진동하도록 하고 0을 중간 지점으로 하는 것입니다. 이를 달성하기 위해 활성화 함수라고 하는 기계 학습의
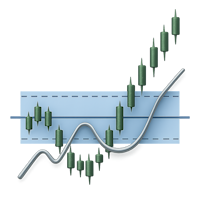
PriceDensity – Professional Price Density Indicator for Accurate Market Level Detection PriceDensity is a smart, non-volume-based indicator that analyzes historical price action to determine key price levels with the highest frequency of occurrence . It automatically detects where the market has spent the most time – revealing hidden areas of support and resistance based on actual market behavior, not subjective drawing. This tool is ideal for traders using price action, support/resistance conce
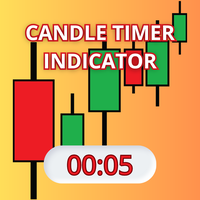
Candle Timer Indicator is a custom tool designed for the MetaTrader 4 (MQL4) trading platform. Its primary purpose is to display a moving timer on the chart, indicating the remaining time before the current candle closes. This feature is particularly useful for traders who need precise tracking of candle closing times for their technical analysis strategies. My indicators for free. I onl
FREE
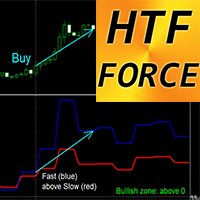
MT4용 Crypto_Forex 지표 HTF 포스 오실레이터
- HTF 포스(Force)는 다중 시간 프레임(Multi-Time Frame) 거래에 강력한 지표입니다. HTF는 상위 시간 프레임(Higher Time Frame)을 의미합니다. - 포스 지수(Force Index)는 가격과 거래량 데이터를 단일 값으로 결합하는 최고의 지표 중 하나입니다. - 상위 시간 프레임의 값은 추세 방향(하락세 - 0 미만, 상승세 - 0 이상)을 보여줍니다. - 빠른 포스 지표 - 파란색 선, 느린 포스 지표 - 빨간색 선 - 매수 신호 - 빠른 선과 느린 선이 상승 교차하고, 둘 다 0 이상(그림 참조) - 매도 신호 - 빠른 선과 느린 선이 하락 교차하고, 둘 다 0 미만(그림 참조) - 지표에는 모바일 및 PC 알림 기능이 내장되어 있습니다.
여기를 클릭하여 고품질 트레이딩 로봇과 지표를 확인하세요! MQL5 웹사이트에서만 제공되는 오리지널 제품입니다.

''A professional trader is a greedy trader: he buys at lows and sells at highs with minimal risks and high returns,,
Neuro Scalper is developed exactly for such trading approach . It's a universal indicator for tracking reversals and uses price action patterns, discrepancy of custom indicators and a multi-layered formula for identifying reversal structures. The indicator is very easy to use; it only shows arrows where is recommended to buy or sell. The indicator is universal and suitable f
FREE

지진계 Marketquake Detector. Description in English :
https://www.mql5.com/en/market/product/113869?source=Site+Market+Product+Page#description How to use the Seismograph :
https://www.mql5.com/en/market/product/113869#!tab=comments&page=2&comment=52806941
Create an EA :
https://www.mql5.com/en/market/product/113869#!tab=comments&page=3&comment=52816509
어떤 방식으로 거래하든 유동성이 낮은 시장에 진입하는 것을 피하고 싶을 것입니다.- 지진계는 시장 랠리 전에 시장에 진입할 수 있는 적절한 시기를 도와줄 것입니다. 그러나 바쁠 시장 시간에 진입을 확인했음에도 불구하고 많은 사람들이 유동성이 부족한 시
HTF Candles MT4 is a mt4 indicator which plots the outline of the higher time-frame candles on the lower candle, including any MT5 higher time-frame chosen. The indicator gives you the option to choose whether or not to view live current HTF candle, with no lag or repainting. Features MT5 Period Candles: This indicator plots any mt5 time-frame candle e.g m3, m5, m12, m15, m20... and so on, on the lower time-frame. Heiken Ashi Options: You have the option to view the HTF Heiken ashi instead of

Detect strength for uptrends and downtrends by tracking Buy Power and Sell Power. Stay on the right side of the market by being able to determine whether the market is in a bull or bear trend and how strong the trend is.
Free download for a limited time! We hope you enjoy, with our very best wishes during this pandemic!
Trend Trigger Factor aims to ride out sideways movement, while positioning the trader in the correct side of the market to capture big trends when they occur. It was origin
FREE

Objective: To notify/alert traders if price touched or closed above/below the moving average. Features/Settings: Moving average method supported: Simple, Exponential, Smoothed and Linear Weighted Works on all currency pairs. Set the Moving Average Period/Shift value Timeframe supported: 1m, 5m 15m, 30m, 1H, 4H, 1D, 1WK, 1Mo Set the Applied Price: Close, Open, High, Low, Price, etc. Set the Candle Size Type: Full Length or Body Length Set the Candle Size to Trigger an Alert Alert type: Popup, Se

The ZUP is based on two ideas. Idea 1 - combine a variety of methods for identifying extremums (minimums and maximums) on the market price charts in a single indicator. Idea 2 - make it possible to easily bind various graphical tools, which allow to analyze the market behavior, to the identified extremums. To implement the first idea , the following has been made in the indicator. Included multiple ZigZag algorithms. Standard ZIGZAG algorithm. The basis of this algorithm is taken from the ZigZag
FREE
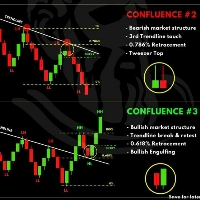
TRADING FLOW WITH AUTO TREND LINE FREE 1. Identify Market Structure Automatically Watch for key price action structures: BOS (Break of Structure) CHoCH (Change of Character) EQH / EQL (Equal High / Low)
These help you understand the current market phase (reversal or continuation) based on Smart Money Concept. 2. Use Auto Trend Line Trendlines are automatically drawn based on valid structure. Breakout of a trendline → potential trend change Rejection from a trendline → possib
FREE

This is a Multi pair and Multi time frame dashboard. The founder of the system is Mr. Oma Ally, which is a system based from Bollinger Band and Moving Average(BBMA). BBMA consists of the use of 2 indicators: Moving Averages Bollinger Bands BBMA consists of 3 types of entries: Extreme MHV Re-Entry Rejection EMA50 This Dashboard Help you to scan current Extreme, Reentry setup, Rejection EMA50 and also MHV How to read signals:
find the same color in 3 different timeframes in succession
For exampl
FREE

This is the free version of the Supply&Demand + Trendline + Trend tool. This version works only with EURCHF! You find the full version here: https://www.mql5.com/en/market/product/67274
PAAIOS stands for Price Action All In One Solution. And that is the purpose of the Indicator. It should give you a tool to improve your trading decisively because you get the crucial information at a glance. The indicator simplifies the search for strong signals. It shows trend lines, demand and su
FREE

Pipfinite creates unique, high quality and affordable trading tools. Our tools may or may not work for you, so we strongly suggest to try the Demo Version for MT4 first. Please test the indicator prior to purchasing to determine if it works for you. We want your good reviews, so hurry up and test it for free...we hope you will find it useful.
Combo Razor Scalper with Trend Laser Strategy: Scalp in the direction of the trend Watch Video: (Click Here)
Features Scalping indicator using a confirme

가격 행동을 기반으로 구조 돌파(BOS)와 유동성 스윕을 시각화하는 시장 구조 지표입니다. 분석 목적 전용입니다. BOS Liquidity Sweep – 시장 구조 지표 (MT4) 이 지표는 순수한 가격 행동과 시장 구조 분석을 사용하여 구조 돌파(BOS)와 유동성 스윕을 차트에 직접 시각화합니다. 시각적 분석 도구로 설계되었으며 자동으로 거래를 실행하지 않습니다. 개념 금융 시장은 보다 명확한 방향성이 형성되기 전에 종종 높은 유동성 영역으로 이동합니다.
이 지표는 다음 요소를 결합하여 이러한 움직임을 시각화합니다: • 시장 구조(HH, HL, LH, LL)
• 유동성 스윕
• 구조 돌파(BOS)를 통한 구조적 확인 목적은 시장 행동을 설명하는 것이며, 강제적인 신호를 생성하는 것이 아닙니다. 작동 방식 1️ 시장 구조 감지
지표는 가격 움직임을 지속적으로 분석하고 다음을 식별합니다: • Higher High (HH)
• Higher Low (HL)
• Lower Hi
FREE

Auto Fibonacci Retracement Indicator — Flexible and Reliable This is not just another Auto Fibonacci Retracement indicator — it’s one of the most flexible and dependable tools available . If you find it useful, please leave a review or comment to support the project. Check out my other helpful tools below: Timeframes Trend Scanner - Scan the trend of assets in difference timeframes with multiple indicators
Market Trend Scanner - Scan the trend of multiple-assets in with multiple indicators
FREE
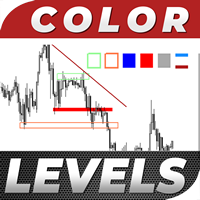
Color Levels is a convenient tool for traders using a Trendline and a Rectangle in their technical analysis. It allows setting two empty rectangles, three filled ones, and two tredlines. The indicator parameters are very simple and divided into numbered blocks: The ones beginning with 1 and 2 - empty rectangle (frame) parameters; 3, 4, and 5 - filled rectangle parameters; 6 and 7 - trendline parameters. Simply click a desired object and it will appear in the upper left corner. Main Adjustable Pa
FREE
Keltner Signals Pro: Trade Smarter, Earn More! Keltner Signals Pro Now available in EA format. Download Now. Boost your trading accuracy and eliminate false signals with Keltner Signals Pro – the advanced yet intuitive indicator designed for serious traders seeking consistent profits! Tired of misleading trading signals? Keltner Signals Pro masterfully combines the power of Keltner Channels for identifying crucial price breakouts with an unbeatable EMA200 Trend Filter . The result? More accurate
FREE

This Indicator is a affordable trading tool because with the help of Popular Developers & Support of M Q L Platform I have programmed this strategy. I tried to combine logic of Moving Averages, Parabolic Stop And Reverse, Trend Strength, Oversold, Overbought . Furthermore, I have also care about Support Resistance that Trader can easily get in touch with market by selecting one indicator only. What is in for Trader?
Trading Modes: This selection is for activate whole strategy "Power Average" Sp
FREE
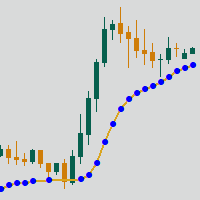
Adaptive Moving Average (AMA) is a trend indicator using moving average and market noise filter. Indicator feature are blue and red points, showing the power of trend. Recommendations for trading: Auxiliary Indicator Detecting trend Detecting power of trend Detecting potential reversal points Main indicator Shows entry points for swing trading Serves as dynamic support and resistance Recommendations for use: Any instrument Any timeframe Input parameters: Period - AMA period Fast Period - fast
FREE

하모닉 패턴은 시장 반전점을 예측하는 데 가장 적합합니다. 이러한 패턴은 높은 승률과 하루 동안 다양한 거래 기회를 제공합니다. 저희 인디케이터는 하모닉 트레이딩 문헌에 기반하여 가장 인기 있는 하모닉 패턴을 식별합니다. 중요 사항: 이 인디케이터는 다시 그리지 않으며 (D 지점에서 패턴을 감지함), 따라잡지 않습니다 (패턴이 유효하거나 취소됨). 사용 방법: MT5 차트에 인디케이터를 끌어다 놓으세요. 패턴 감지를 TRUE로 설정하세요 (ABCD; Gartley). 원하는대로 편차를 조정하세요 (높은 편차는 더 많은 패턴, 낮은 편차는 더 적은 패턴). 색상을 원하는 대로 사용자 정의하세요. 필요에 따라 ENTRY POINT, TP 및 SL에 대한 경고를 활성화하거나 비활성화하세요. 패턴 감지 시: 알고리즘은 D 지점에서 패턴을 감지합니다. 경고가 활성화되어 있으면 패턴 감지에 대한 알림을 보냅니다. 패턴이 무효화되면 "패턴 취소"라는 메시지가 포함된 경고가 트리거됩니다. 성공적인
FREE

Наш индикатор RSI оснащен мощной мультитаймфреймовой (MTF) функцией , которая позволяет вам отображать значения RSI с других таймфреймов (например, H1, H4, D1) прямо на вашем текущем рабочем графике (например, M15). Преимущества MTF RSI: Контекст Старшего Таймфрейма: Понимайте глобальный тренд и уровни перекупленности/перепроданности со старших таймфреймов, не переключая графики. Это помогает фильтровать сигналы на младших ТФ и входить в сделки по направлению основного движения. Раннее Обнаружен
FREE
Special offer : ALL TOOLS , just $35 each! New tools will be $30 for the first week or the first 3 purchases ! Trading Tools Channel on MQL5 : Join my MQL5 channel to update the latest news from me 최근 변동성이 큰 금융 트레이딩 환경에서 지지선과 저항선을 정확하게 파악하는 것은 트레이더가 올바른 의사결정을 내리는 데 매우 중요합니다. Predictive Ranges Scanner Multi-TF 는 여러 통화쌍과 시간 프레임에 걸쳐 미래의 매매 구간을 스캔 및 예측하도록 설계된 고급 도구로, 효과적이고 정밀한 시장 추세 파악을 지원합니다. See more MT5 version at: Predictive Ranges MT5 Scanner Multi TF See more products at: All
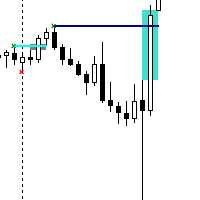
The Contraction/Expansion Breakout Indicator for MetaTrader 4 (MT4) is a powerful tool crafted to identify and signal the breakout of bullish and bearish contraction or expansion formations within financial markets. Utilizing advanced algorithmic calculations, this indicator assists traders in recognizing significant price movements that frequently accompany these formations, providing valuable insights for strategic trading decisions. Key Features: Contraction and Expansion Identification: The
FREE

Dies ist ein durchschnittlicher Index basierend auf einem benutzerdefinierten Algorithmus. Je nach Band können Uplink und Downlink farblich identifiziert werden. Das Pop-up-Feld kann ein- oder ausgeschaltet werden, um anzuzeigen, dass der aktuelle Kauf- oder Verkaufsauftrag platziert werden soll.
Beschreibung der Parameterliste:
Extern int price = 0; / /anfänglicher Durchschnittspreis des Indikators
Externe int length = 20; / / der Indikator berechnet den Durchschnittszeitraum, der dem Du
FREE

Price Action Dashboard Pro - Professional Market Structure & Price Action for MT4 Concept: Ending the Search for the "Holy Grail" Many traders find themselves lost in a labyrinth of complex algorithms, eventually losing sight of the only truth that matters: "Price is King." Price Action Dashboard Pro is designed to lead you out of the endless cycle of searching for a "magic indicator" and bring you back to the core principles of the market— Dow Theory and Price Action . This is not a temporar

Necessary for traders: tools and indicators Waves automatically calculate indicators, channel trend trading Perfect trend-wave automatic calculation channel calculation , MT4 Perfect trend-wave automatic calculation channel calculation , MT5 Local Trading copying Easy And Fast Copy , MT4 Easy And Fast Copy , MT5 Local Trading copying For DEMO Easy And Fast Copy , MT4 DEMO Easy And Fast Copy , MT5 DEMO 砖图Renko PRO->>>
The display of the brick map on the main map.
The Renko chart ideally remove
FREE

Индикатор MQLTA Supertrend Multi Timeframe сочетает в себе значения Supertrend, найденные на нескольких таймфреймах, чтобы подтвердить тренд пары. Для работы утилиты необходим бесплатный индикатор MQLTA Supertrend Line - https://www.mql5.com/en/market/product/25951.
Как он работает? Индикатор проверяет состояние Supertrend на всех выбранных таймфреймах и отображает результат в виде легко читаемой таблицы.
Как торговать с помощью индикатора Supertrend Multi Timeframe Покупку следует совершать,
FREE

핍스 헌터 프로는 수년에 걸쳐 개발되었으며 이전 버전보다 개선된 버전입니다. 이 강력한 지표는 시장과 가격 이력을 분석하여 매수 및 매도 항목을 생성합니다. 이러한 항목의 계산을 위해 함께 작동하는 다양한 지표와 덜 유리한 항목을 필터링하고 제거하는 복잡한 통계 로그를 사용합니다 / MT5 버전 .
특징 다시 칠하지 않음
이 인디케이터는 새 데이터가 도착해도 값이 변경되지 않습니다
지연 없음 이 표시기는 지연되지 않습니다 거래 쌍
모든 외환 쌍 (가급적 EURGBP)
타임프레임
모든 차트주기
매개변수 ===== 표시 =====
화살표 거리 // 신호(화살표)와 캔들스틱 사이의 거리
===== 알림 =====
팝업 알림 // MT4 터미널용 알림
푸시 알림 알림 // 휴대폰용 알림
이메일 알림 // 이메일 알림
===== 차트 설정 =====
차트에서 캔들 스틱의 색상을 변경하는 옵션
경고 저는 MQL5.com에서만 제품을 판매합니다. 누군가 내
FREE

DONCHIAN CHANNEL DC It is a trend indicator developed by “Richard Donchian”, consisting of 3 layers, the upper channel, the lower channel and the middle channel. It is created on the Donchian Channel by plotting the highest and lowest prices reached in the past period on the price chart. It is also used to measure the volatility of the market, as it is an expanding/contracting channel according to the increase/decrease of price volatility. Method 0; Donchian channel indicator drawing. BUY/SELL S
FREE

Trade History for MT4 This indicator is specially developed for that traders want to display his trades on the charts. Shows history and current deals on the chart. Trades show on the chart with a dotted line, and profit will show realtime. Buy trades are displayed in bull color, Sell trades in bear color.
Tip: The historical order displayed by the indicator is associated with the "Account History", so please set the historical order display in the "Account History" of MT software.
If you a
FREE

We provide indicators tailored to better meet your trading requirements. >> MT Magical <<
MT Supply Demand :
It is an indicator created to find supply and demand, which will be important support and resistance levels for the price. Supply Zone is a zone where the price has reached, it is often resisted. In other words, when the price reaches this zone, there will be more selling power to push the price back down.
Demand Zone is a zone where the price has reached, it is ofte
FREE

이 스캐너는 우리 인디케이터 ACB Breakout Arrows 를 위한 멀티 심볼, 멀티 타임프레임 스캐너입니다. 기본 설정으로 28개 통화쌍과 9개 시간 프레임 을 동시에 스캔하여 매수 및 매도 신호를 감지할 수 있습니다.
특징
단일 차트에서 252* 개의 심볼과 시간 프레임 조합을 스캔할 수 있습니다. 단 한 번의 클릭으로 사전 설정된 템플릿이 적용된 신호 차트를 바로 엽니다. 패널을 차트 위 원하는 위치로 쉽게 드래그 앤 드롭할 수 있습니다. 실시간 팝업, 소리, 푸시 알림 및 이메일 알림을 지원합니다.
입력 파라미터 ACB Breakout Arrows 의 신호 민감도 설정. 스캔할 심볼을 입력하세요. 히스토리 갱신: 데이터가 손상되었거나 누락된 경우 다운로드하여 새로 고칠 수 있습니다. 스캔할 시간 프레임을 선택하세요. 알림 설정
패널 색상 및 글꼴 크기 설정 가능.

CyberZingFx Volume Indicator is designed to help traders find market reversals with ease. This powerful tool uses a unique strategy that combines both volume and historical price to provide accurate signals for potential market reversals. The indicator displays volume BUY and SELL power values on the right side of the chart for both BUY and SELL. With customizable settings, you can set alerts at different levels to suit your trading style. The most recent alert value is displayed as Alert High,
FREE

The Supreme HmaSignal indicator is an indicator for trend trading , its main character is the hull moving average colored line , and secondary is buy and sell arrows , arrows are fair but the main focus is on the colored hma , this indicator does not repaint or back paint or delay its signals. if you like this indicator please check my Supreme Trendhisto: here , and my Supreme Diamond indicator : here
Parameters: HMA Period HMA Smoothing HMA Price (close/open) Signal Period (Arrows)
FREE
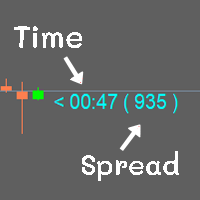
Show the time of candlesticks and spread. All data will be displayed in a rod. Can change color Can fix the size as needed
MT4 : Link https://www.mql5.com/en/market/product/102742 MT5 : Link https://www.mql5.com/en/market/product/102834
Most free code on various websites I didn't write it myself. I only do a little bit.
If you like it, please give 5 stars with it. Thank you.
FREE
A personal implementation of the famous Bollinger bands indicator as a trend following mechanism, which uses a moving average and the standard deviation to define what a trend is and when it changes. Bollinger bands are usually used as an oversold/overbought indicator only, but in my opinion, the trading approach is more complete using the trend variant as an exit strategy. [ Installation Guide | Update Guide | Troubleshooting | FAQ | All Products ] Easy to trade Customizable colors and sizes It
FREE

An imbalance bar or candle, also called a fair value gap (FVG) or inefficiency, shows strong buying or selling in the market or weak buying or selling that causes prices to move quickly with high momentum. This is why it's an important part of price action analysis. Our indicator offers three main benefits: Clear Design: The imbalance bar is built into the candle with a simple, clean look that makes it easy for traders to spot while keeping the chart tidy. Easy to Use: A hotkey lets traders quic
FREE
Special offer : ALL TOOLS , just $35 each! New tools will be $30 for the first week or the first 3 purchases ! Trading Tools Channel on MQL5 : Join my MQL5 channel to update the latest news from me MetaTrader 4 (MT4) 용의 혁신적인 거래 도구인 SuperTrend AI Clustering with Scanner 로 AI의 힘을 발견하세요. 이 지표는 K-means 클러스터링과 널리 알려진 SuperTrend 지표를 결합하여 시장 분석을 재정의하고, 거래자가 트렌드와 신호를 탐색할 때 유리한 위치를 차지할 수 있도록 합니다. See more MT5 version at: SuperTrend AI Clustering MT5 with Scanner See more products at: ht

SMC Venom Model BPR 지표는 Smart Money(SMC) 개념 내에서 일하는 트레이더를 위한 전문 도구입니다. 가격 차트에서 두 가지 주요 패턴을 자동으로 식별합니다. FVG (공정 가치 갭)는 3개의 캔들의 조합으로, 첫 번째와 세 번째 캔들 사이에 갭이 있습니다. 이는 볼륨 지원이 없는 레벨 사이에 구역을 형성하여 종종 가격 수정으로 이어집니다. BPR (균형 가격 범위)은 두 개의 FVG 패턴의 조합으로, "브리지"를 형성합니다. 이는 가격이 낮은 볼륨 활동으로 움직일 때 브레이크아웃과 레벨로의 복귀 구역으로, 캔들 사이에 갭을 생성합니다.
이러한 패턴은 거래자가 차트에서 거래량과 가격 역학을 분석하여 주요 지지/저항 수준, 돌파 구역 및 진입 지점을 식별하는 데 도움이 되며, 여기서 대형 시장 참여자와 일반 참여자 간의 상호 작용이 발생합니다. 이 지표는 사각형과 화살표 형태로 패턴을 시각화하며 유연한 경고 설정도 지원합니다.
주요 특징:
패턴 표시 모드:
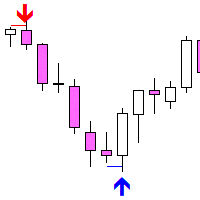
Fakey Detector — False Breakout (Fakey) Indicator Fakey Detector is an indicator that automatically detects the classic Fakey pattern (false breakout of an inside bar) from Price Action and displays it on the chart using an arrow and breakout level. How it works: The Fakey pattern consists of three candles: Mother Bar — the largest by range Inside Bar — fully contained within the Mother Bar's range Fakey Candle — breaks out (up or down), but then closes back inside the range The indicator
FREE

The Penta-O is a 6-point retracement harmonacci pattern which usually precedes big market movements. Penta-O patterns can expand and repaint quite a bit. To make things easier this indicator implements a twist: it waits for a donchian breakout in the right direction before signaling the trade. The end result is an otherwise repainting indicator with a very reliable trading signal. The donchian breakout period is entered as an input. [ Installation Guide | Update Guide | Troubleshooting | FAQ | A
FREE
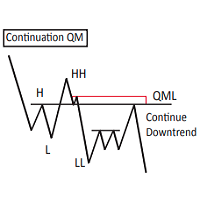
This Custom Mapping Tool is an innovative MT4 indicator that simplifies the process of marking and mapping charts. With this tool, you no longer have to waste time rewriting repetitive words, rectangles, and trendline colors every time. New Feature V5.60:
Draw path - Same as the TV Path drawing mode, which is very useful for naked chart trader. You can draw zigzag, draw your patterns manually. Change style in indicator setting. Crop function disabled by default. Can be enabled and show button c
FREE

[NEW RELEASE] Horse All in Signal – WinWiFi Robot Series ต้อนรับปีใหม่ 2026 ด้วยความมั่งคั่งและพลังที่คึกคักเหมือนม้าศึก! สัมผัสประสบการณ์การเทรดเหนือระดับกับอินดิเคเตอร์ตัวล่าสุดจาก WinWiFi Robot Series ในชื่อ "Horse All in Signal" เครื่องมือที่จะเปลี่ยนกราฟของคุณให้กลายเป็นสนามทำกำไร ด้วยระบบ AI อัจฉริยะที่สแกน Price Action ในทุกช่วงเวลา คุณสมบัติเด่น (Key Features): AI Price Action Engine: วิเคราะห์พฤติกรรมราคาแบบ Real-time แม่นยำทั้งในช่วงตลาดมีเทรนด์ (Trend) และช่วงพักตัว (Sideway)
FREE

Polynomial Trend - A tool that allows you to determine the direction and strength of a trend. Unlike most indicators, Polynomial Trend finds longer-term trends and gives fewer false signals. This indicator allows you to find the most likely trend reversal points b allows you to identify the current market phase (uptrend, downtrend).
This indicator displays arrows of different colors depending on the current state of the market and thus signals the user about a change in trend. It is easy to us

MP Squeeze Momentum is a volatility and momentum indicator derivated of "TTM Squeeze" volatility indicator introduced by John Carter. It capitalizes on the tendency for price to break out strongly after consolidating in a tight range. Introduction: The volatility component of MP Squeeze Momentum measures price compression using Bollinger Bands and Keltner Channels. If the Bollinger Bands are completely enclosed within the Keltner Channels, that indicates a period of very low volatility. This st
FREE

Long-Term Supply Demand Indicator – Description
The Long-Term Supply Demand Indicator is a professional MT4 tool designed for traders who want to track higher-timeframe support and resistance zones on lower timeframes. It identifies supply and demand areas formed on the H4 timeframe and displays them clearly on M15, M5, and M1 charts, giving traders a precise view of key market zones across multiple timeframes.
The indicator provides alerts when a new supply or demand zone is formed, allowing
FREE

Reversal Pattern AI is a groundbreaking advancement in indicator development, combining artificial intelligence algorithms, multi-level market analysis, and classical technical analysis methods. It not only detects reversal patterns but also evaluates market inefficiencies, generating highly accurate trading signals.Thanks to its hybrid model, which utilizes price action analysis, volume, volatility, VWAP, and Volume AVG %, the indicator easily adapts to any market conditions. Reversal Pattern A

Overview
RenkoVP is a professional tool for price structure analysis that runs fully online on the main chart. Unlike many other Renko indicators, it requires no offline charts. The indicator combines Renko bricks, volume profile, dynamic Fibonacci levels, and automatic pattern recognition to help traders identify trends, key zones, and precise entry/exit points. Renko Bricks Configuration
The indicator offers both manual and automatic brick configuration: No offline chart required - runs direc

Calculation of Lot Size for many traders is a big challenge.
A case that is very important in money management. What many traders ignore.
Choosing an appropriate Lot Size in trades can improve results and it will ultimately lead to success.
This indicator calculates the authorized Lot Size for your trades.
The indicator uses the following values to get the appropriate Lot Size for positioning:
The distance of Stop Loss.
The Pip Value.
The amount of Risk Allowed For Each Trade.
The amoun
FREE
How To Trade
Execute your trades in 3 Easy Steps!
Step 1: Trade Setup Entry Buy in Signal price and TP1 in price indicator, You can use trailing stop in TP1. Entry Sell in Signal price and TP1 in price indicator, You can use trailing stop in TP1. Success Rate ≥ 75% 100:25 Step 2: Set Stop Loss Stop loss BUY ----> You can set stop loss on Line Order SELL. Stop loss SELL ----> You can set stop loss on Line Order BUY. Step 3: Set Take Profit Option 1: Take profit on TP1. Option 2: Partial take pr
FREE

Peak Trough Analysis is the great tool to detect peaks and troughs in your chart. Peak Trough Analysis tool can use three different peaks and troughs detection algorithm. The three algorithm include the orignal Fractals Indicator by Bill Williams, the Modified Fractals indicator and ZigZag indicator. You can use this peak and trough analysis tool to detect the price pattern made up from Equilibrium Fractal-Wave process. For further usage, there are good guide line on how to use this peak trough
FREE

UR 최고점 및 최저점
UR Highs&Lows는 가격 움직임과 변동성에 대한 심층 분석을 수행하고 가격이 움직이는 채널을 생성합니다. 이 채널은 이제 오실레이터로 움직이며 잠재적인 소진 및 반전 가능성을 알리기 위해 가격 편차로 오버레이됩니다.
UR Highs&Lows 사용의 장점 :
매개변수 없음 가격 움직임을 설명하는 3개의 선이 있습니다. 가격의 평균인 흰색 선과 극단인 파란색 선입니다. 히스토그램은 가격 맥락에서 최대 편차를 시각화한 것입니다. 인터페이스는 양 극단(빨간색 상단 및 파란색 하단 영역)에서 어느 한 라인의 소진을 보여줍니다. 최고의 장점: 쉽고 모든 자산에 맞게 조정됩니다. 도구 업데이트를 최신 상태로 유지하고 빠진 것이 있다고 생각되면 요청을 보낼 수 있는 특별한 텔레그램 채팅이 있습니다!
왜 UR Highs&Lows인가?
이 표시기는 독립 실행형, 진입 또는 종료 표시기로 사용할 수 있습니다. 가격에 의존하기 때문에 모든 차트에 적용할 수
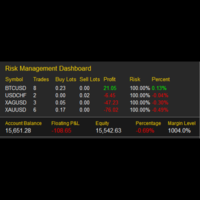
My Risk Management The Risk Management Dashboard is a visual tool designed to help traders monitor risk exposure in real time. With a clear and compact layout, it provides an instant overview of trading activity, enabling more disciplined and informed decision-making. Key Features Active Symbol Summary
Displays all traded symbols with the number of trades, total buy/sell lots, and current profit/loss. Per-Symbol Risk Analysis
Calculates and shows the risk percentage of each symbol relative to
FREE

고릴라 채널은 장기 관측에 기초하여 수정 된 채널 표시이다.
신호 거래 표시기는 추세 채널을 표시하는 표시기와 입력 신호 소스 중 하나로 사용할 수 있으며 추가 필터링이 적용됩니다. 올바른 접근 방식으로,성공적인 거래의 적어도 80%.
고릴라 채널의 주요 특징: 분석 기능
모든 통화 쌍 및 시간 프레임에서 사용할 수 있습니다; 표시기가 다시 그려지지 않습니다; 그것은 다른 지표에 큰 도움이됩니다; 그래픽 기능
차트의 최소 위치 수를 차지합니다; 유연한 팅크; 쉽게 배울 수; 주요 특징
온/오프 경고를 설정하는 기능; 메시지 및 모바일 알림의 형태로 이메일 알림; 고릴라 채널 시작: 표시기를 시작하고 최적의 팅크를 조정하십시오.
고릴라 채널 설정:
전시
체크 바-채널 표시기 크기(최적 값:150-200); 유연성-신호 튜닝(최적의 값:5-20); 편차-채널 폭(최적 값:1.618-3); 중앙선-중앙 점선 참|거짓 표시; -신호 수(권장 홀로 터치); 알림
FREE

Modified oscillator MACD. A classic indicator that combines a trend indicator with an oscillator to detect entry points. Has a multi-timeframe panel and 3 types of notifications
Benefits:
Works on all instruments and timeseries Trend indicator with oscillator for inputs Multi-period panel on all timeframes Pluggable arrows when signals appear Three types of notifications: push, email, alert
MT5 version -> HERE / Our news -> HERE
How the indicator works:
AW Classic MACD - Indicator of
FREE

YOU CAN NOW DOWNLOAD FREE VERSIONS OF OUR PAID INDICATORS . IT'S OUR WAY OF GIVING BACK TO THE COMMUNITY ! >>> GO HERE TO DOWNLOAD
The Volatility Ratio was developed by Jack D. Schwager to identify trading range and signal potential breakouts. The volatility ratio is defined as the current day's true range divided by the true range over a certain number of days N (i.e. N periods). The following formula is used to calculate the volatility ratio: Volatility Ratio (VR) = Today's True Range/Tru
FREE
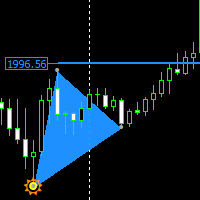
Non-repaint price action pattern based indicator works on all timeframe the indicator is based on a 123 Triangle pattern that happens everyday on the market the indicator will point out the pattern for you and you can turn on Fib level to see your take profit. Blue triangle is a buy signal Red triangle is a sell signal horizonal blue and red lines is an indication to place your trail stop loss one price has reached that area only entry when the triangle has fully formed

외환 거래자로서 기술 분석에서 피보나치 거래 전략의 가치를 이해합니다. 그러나 수동으로 피보나치 수준을 그리고 조정하는 것은 시간이 많이 걸릴 수 있습니다. 여기에서 Fibonacci Of Yesterday Ultimate 지표가 등장합니다. 전일의 가격 조치를 기반으로 하는 피보나치 전략을 사용하는 트레이더를 위해 특별히 설계되어 시간과 노력을 절약할 수 있습니다. 이 혁신적인 지표는 피보나치 수준을 기반으로 진입, 손실 중지 및 이익 실현 수준을 자동으로 식별합니다. 또한 기본 설정에 맞게 쉽게 사용자 지정할 수 있는 사용자 친화적인 피보나치 도구가 포함되어 있습니다. 이를 차별화하는 것은 차트에서 실제 추세 채널을 식별하는 기능으로 반전, 되돌림 및 추세 기회를 쉽게 찾을 수 있도록 도와줍니다. Fibonacci Of Yesterday Ultimate 지표를 사용하는 것은 간단합니다. 주요 보도 자료를 기다렸다가 추세를 파악하고 그에 따라 피보나치 수준을 그립니다

BREAKOUT-SESSION-BOX LONDON EU US ASIA Open
watch the expectation of a volatile movement above or under the opening range We take the high of the range as Entry for a long trade and SL will be the low of the range and vice versa the low of the range as Entry for a short trade and the high for SL The size of the range is the distance to the TP (Take Profit) The range of the opening hours should not be larger than about 1/3 of the average daily range 4 breakout examples are already predefined: A
FREE
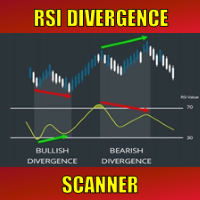
Special offer : ALL TOOLS , just $35 each! New tools will be $30 for the first week or the first 3 purchases ! Trading Tools Channel on MQL5 : Join my MQL5 channel to update the latest news from me 역동적인 금융 시장에서 추세 반전 신호를 식별하는 것은 효과적인 거래에 필수적입니다. RSI Divergence Scanner는 다양한 통화 쌍과 시간대에서 RSI 다이버전스 신호를 정확하고 효율적으로 감지하도록 설계되었습니다. MT5 버전 자세히 보기: RSI Divergence MT5 Scanner 더 많은 제품 보기: 모든 제품 1. RSI 다이버전스 이해하기 RSI (상대 강도 지수) 는 가격 모멘텀을 측정하는 기술 지표로, 트레이더들 사이에서 널리 사용됩니다. RSI 다이버전스는 가격 움직임과
FREE

GT Trend는 M1 및 M5 차트에서 거래하도록 특별히 설계된 추세 표시기입니다. 이 지표는 일중 거래를 선호하는 거래자에게 이상적입니다. 이 지표를 거래 시스템의 기초로 사용하거나 독립형 거래 솔루션으로 사용할 수 있습니다. 표시기는 사용하기 쉽습니다. 신호를 따라가기만 하면 됩니다. 또한 이 표시기의 모든 사용자에게 무료로 추가 표시기를 제공하여 이 방법을 가능한 한 효율적으로 사용하는 데 도움이 됩니다. 이 거래 지표는 다양한 통화 쌍뿐만 아니라 금속, 지수, 원자재, 주식 및 기타 금융 상품을 거래하는 데 사용할 수 있습니다. 표시기는 조정할 필요가 없습니다. 사용하는 일정에 따라 자동으로 조정됩니다. 구매 후 더 많은 지표를 위해 저에게 연락하십시오. 당신을 기다리고있는 큰 보너스도 있습니다!

Are you ready to get Alert,aim,shot and take profit? well nice to meet you im Martin del NEGRO from Argentina, let me introduce you about your new indicator, this one have the knowledge to find pivot points in the chart ,more specifically when the price its starting a new strong trend (buy)bullish or bearish(sell) ,and when "Victory Ravage Days.ex4" indicator find this one pivot point, he will immediately get in touch with you send you a notification to take advantage of this fresh and new oport

Χ15 indicator is a MetaTrader 4 tool that allows you to BUILD & BACKTEST ON REAL TIME your own strategies quickly, easily and efficiently. It contains 15 of the most popular technical analysis indicators that you can use, each one in a different way. Choose the indicators that you want to use, select how you will use them and you will see on the chart BUY (green) and SELL (red) arrows implementing your strategy. Choose Take Profit and Stop Loss and you will see the results of your strategy with
FREE

Metatrader 4 서버에서 동부 표준시(뉴욕 현지 시간)를 쉽게 식별할 수 있도록 Metatrader 4용으로 디자인한 이 사용자 지정 표시기입니다. 그러나 드롭다운 메뉴에서 시간대를 변경하여 현지 시간을 식별하는 데 사용할 수 있습니다. 선택한 시간대의 특정 시간에 모든 색상의 수직선을 추가할 수 있습니다. 선택한 시간대 또는 실제 서버 시간을 기준으로 수평 자동 계산 시가, 고가, 저가 및 종가 라인을 추가할 수 있습니다. 빠른 참고: 뉴욕 동부 표준시를 사용하는 경우 일광 절약 시간 동안 항상 일광 절약 시간이 켜져 있는지 확인하십시오. English: This custom indicator I designed for Metatrader 4 to be able to easily identify Eastern Standard Time (New York Local Time) from any metatrader 4 server. But, you can use this to id
FREE

This indicator is a multifunctional technical analysis tool based on the combination of an adaptive exponential moving average and volatility filters calculated through the Average True Range (ATR). It is designed to accurately identify the current price direction, highlight key trend reversal areas, and visualize potential turning zones. The algorithm is built upon the dynamic construction of a trend ribbon using two levels of volatility — outer and inner ranges. The outer boundaries serve as i

SuperTrend 지표는 시장의 추세 전환을 시각적으로 쉽게 파악할 수 있게 해주는 추세 추종형 기술적 도구입니다. 가격 변동에 따라 선의 색상과 위치가 자동으로 바뀌어 진입 및 청산 판단에 도움을 줍니다. 간단한 구조로 수동 트레이딩과 자동매매 등 다양한 트레이딩 스타일에 활용할 수 있습니다. 주요 특징 추세 전환점 명확하게 표시
상승 추세에서는 선이 캔들 아래쪽에, 하락 추세에서는 위쪽에 그려집니다. 이를 통해 추세 방향과 전환 시점을 직관적으로 파악할 수 있습니다. 박스권에서 추세로의 전환 용이하게 식별
새로운 추세의 시작이나 박스권 돌파 타이밍을 쉽게 확인할 수 있습니다. 유연한 파라미터 조정
ATR 기간과 배수(Multiplier)를 조정하여 다양한 통화쌍, CFD, 시간대에 최적화할 수 있습니다. 다양한 활용 방법
수동 매매뿐만 아니라 자동매매에도 활용 가능하며, 명확한 신호로 거래 판단을 보조합니다. 계산 로직 지정한 기간의 ATR(Average True Ran
FREE
트레이딩 전략과 기술 지표를 판매하기에 가장 좋은 장소가 왜 MetaTrader 마켓인지 알고 계십니까? 광고나 소프트웨어 보호가 필요 없고, 지불 문제도 없습니다. 모든 것이 MetaTrader 마켓에서 제공됩니다.
트레이딩 기회를 놓치고 있어요:
- 무료 트레이딩 앱
- 복사용 8,000 이상의 시그널
- 금융 시장 개척을 위한 경제 뉴스
등록
로그인
계정이 없으시면, 가입하십시오
MQL5.com 웹사이트에 로그인을 하기 위해 쿠키를 허용하십시오.
브라우저에서 필요한 설정을 활성화하시지 않으면, 로그인할 수 없습니다.