MetaTrader 4용 기술 지표 - 2
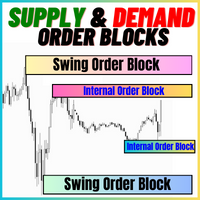
공급 및 수요 주문 블록:
"공급 및 수요 주문 블록" 인디케이터는 외환 기술 분석에 중요한 스마트 머니 개념을 기반으로 한 정교한 도구입니다. 이는 공급 및 수요 영역을 식별하고, 기관 트레이더가 중요한 흔적을 남기는 핵심 영역을 집중 조명합니다. 판매 주문을 나타내는 공급 영역과 구매 주문을 나타내는 수요 영역은 트레이더가 가격 움직임의 잠재적인 반전이나 둔화를 예상하는 데 도움을 줍니다. 이 인디케이터는 브레이크아웃 오브 스트럭처 (BoS)와 페어 밸류 갭 (FVG) 구성 요소를 결합한 똑똑한 알고리즘을 사용합니다. BoS는 시장 교란을 감지하고, 잠재적인 주문 블록을 지적하는 반면, FVG는 정확성을 향상시키기 위해 공정 가치 갭을 고려합니다. 이 도구는 이러한 조건을 시각적으로 나타내어 트레이더가 결정을 내리는 데 도움을 줌으로써 잠재적인 주문 블록을 강조하고 시장 역학 및 전환점에 대한 통찰력을 제공합니다. 사용자 친화적인 디자인으로 다양한 기술 지식 수준의 트레이더에
FREE
Advanced Indicator Scanner is a multi-symbol multi-timeframe scanner that works with hundreds of custom indicators available across the web including mql5 website market and codebase indicators.
Advanced Indicator Scanner features:
Scans your indicator in 28 customizable instruments and 9 timeframes. Monitors up to 2 lines(buffers) of an indicator. Showing of indicator value on buttons. You can choose between 3 alert modes: Single symbol and timeframe Multiple timeframes of a symbol Multiple
Scalping Explorer is a complete trading system. Our traders have tested and optimized its work for maximum effect. Trading with Scalping Explorer is easy. Open in Metatrader4 windows with currency pairs: EURUSD, GBPJPY, GBPUSD, AUDUSD, USDCHF. We include D1 timeframe on all currency pairs. Add the Scalping Explorer indicator to each window with a currency pair. In the indicator settings, we find the "Signal" parameter and set it to TRUE. Now, as soon as a signal appears on any of the currency p

The indicator very accurately determines the levels of the possible end of the trend and profit fixing. The method of determining levels is based on the ideas of W.D.Gann, using an algorithm developed by his follower Kirill Borovsky. Extremely high reliability of reaching levels (according to K. Borovsky - 80-90%) Indispensable for any trading strategy – every trader needs to determine the exit point from the market! Precisely determines targets on any timeframes and any instruments (forex, met

Product Name: Quantum Regime Indicator
Short Description: A multi-engine structural regime and volatility filter. Description: Quantum Regime Indicator (QRI) is a sophisticated technical analysis algorithm designed to identify market structure shifts and volatility regimes. Unlike standard indicators that rely on immediate price action, QRI utilizes a hierarchical logic architecture to filter market noise and identify statistical extremes. The indicator is built on the philosophy of "Market

매트릭스 화살표 표시기 MT4 는 외환, 상품, 암호 화폐, 지수, 주식과 같은 모든 기호/도구에 사용할 수 있는 100% 다시 칠하지 않는 다중 기간 표시기를 따르는 고유한 10 in 1 추세입니다. Matrix Arrow Indicator MT4 는 다음과 같은 최대 10개의 표준 지표에서 정보와 데이터를 수집하여 초기 단계에서 현재 추세를 결정합니다. 평균 방향 이동 지수(ADX) 상품 채널 지수(CCI) 클래식 하이켄 아시 캔들 이동 평균 이동 평균 수렴 발산(MACD) 상대 활력 지수(RVI) 상대 강도 지수(RSI) 포물선 SAR 스토캐스틱 오실레이터 윌리엄스의 백분율 범위 모든 지표가 유효한 매수 또는 매도 신호를 제공하면 강력한 상승/하락 추세를 나타내는 다음 캔들/막대가 시작될 때 해당 화살표가 차트에 인쇄됩니다. 사용자는 사용할 표시기를 선택하고 각 표시기의 매개변수를 개별적으로 조정할 수 있습니다. 매트릭스 화살표 표시기 MT4는 선택한 표시기에서만 정보를 수

우선적으로, 이 거래 도구는 전문적인 거래에 이상적인 비-다시 그리기 및 지연되지 않는 지표입니다. 온라인 강좌, 사용자 매뉴얼 및 데모. 스마트 가격 액션 컨셉트 인디케이터는 신규 및 경험 많은 트레이더 모두에게 매우 강력한 도구입니다. Inner Circle Trader Analysis 및 Smart Money Concepts Trading Strategies와 같은 고급 거래 아이디어를 결합하여 20가지 이상의 유용한 지표를 하나로 결합합니다. 이 인디케이터는 스마트 머니 컨셉트에 중점을 두어 대형 기관의 거래 방식을 제공하고 이동을 예측하는 데 도움을 줍니다.
특히 유동성 분석에 뛰어나 기관이 어떻게 거래하는지 이해하는 데 도움을 줍니다. 시장 트렌드를 예측하고 가격 변동을 신중하게 분석하는 데 탁월합니다. 귀하의 거래를 기관 전략에 맞추어 시장의 동향에 대해 더 정확한 예측을 할 수 있습니다. 이 인디케이터는 시장 구조를 분석하고 중요한 주문 블록을 식별하고 다양한

현재 20% 할인!
초보자 또는 전문가 트레이더를 위한 최고의 솔루션!
이 표시기는 Exotic Pairs Commodities, Indexes 또는 Futures와 같은 기호에 대한 통화 강도를 표시하는 데 특화되어 있습니다. 금, 은, 석유, DAX, US30, MXN, TRY, CNH 등의 진정한 통화 강도를 보여주기 위해 9번째 줄에 모든 기호를 추가할 수 있습니다. 이것은 독특하고 고품질이며 저렴한 거래 도구입니다. 우리는 많은 독점 기능과 새로운 공식을 통합했습니다. 새로운 추세 또는 스캘핑 기회의 정확한 트리거 포인트를 정확히 찾아낼 수 있기 때문에 거래가 어떻게 개선될지 상상해 보십시오.
사용 설명서: 여기를 클릭 https://www.mql5.com/en/blogs/post/708876
모든 시간대에 작동합니다. TREND를 빠르게 확인할 수 있습니다! 새로운 기본 알고리즘을 기반으로 설계되어 잠재적인 거래를 더욱 쉽게 식별하고 확인할 수 있습니다. 8개의
Pipfinite creates unique, high quality and affordable trading tools. Our tools may or may not work for you, so we strongly suggest to try the Demo Version for MT4 first. Please test the indicator prior to purchasing to determine if it works for you. We want your good reviews, so hurry up and test it for free...we hope you will find it useful.
Attention This trading tool is specifically designed to help grid, martingale, averaging, recovery and hedging strategies. If you are not familiar with th

Contact me for instruction, any questions! Introduction Chart patterns are an essential tool traders and investors use to analyze the future price movements of securities. One such pattern is the triple bottom or the triple top pattern, which can provide valuable insights into potential price reversals. This pattern forms when a security reaches a low price level three times before reversing upward or reaches a high price level three times before reversing downward.
Triple Top Bottom P

Crystal Volume Profile Auto POC (MT4) — 자동 POC 볼륨 프로파일 개요
Crystal Volume Profile Auto POC 는 MetaTrader 4용으로 설계된 가볍고 최적화된 인디케이터입니다. 가격대별 거래량 분포를 시각화하며, 가장 많은 거래량이 발생한 가격 수준인 POC(Point of Control)를 자동으로 표시합니다. 이를 통해 숨겨진 지지/저항 구역, 누적/분배 구간 및 기관 투자자의 활동을 쉽게 식별할 수 있습니다. MetaTrader 5 버전도 제공됩니다: Crystal Volume Profile Auto POC (MT5) . 주요 기능 자동 POC 탐지 동적 볼륨 프로파일 (차트 가시 영역 또는 사용자 정의 범위) 고정 프로파일 옵션 (세부 영역 분석) 히스토그램 크기, 색상 및 라인 스타일 완전 사용자 정의 가능 각 캔들마다 실시간 자동 업데이트 Reset VP, Hide VP 버튼 내장 라이트/다크 차트 테마 지원 사
FREE

TopBottom Checker 는 가격의 바닥과 상단을 결정하는 지표입니다. 표시기는 모든 통화 쌍과 함께 사용할 수 있습니다. 표시기는 M1에서 D1까지의 모든 시간 프레임에서 작동합니다. 이 지표는 절대적으로 모든 전략에 매우 중요한 시장 측면과 함께 작동하므로 지표는 독립형 거래 시스템으로 또는 사용하는 거래 시스템의 일부로 사용할 수 있습니다. 지표 신호는 추세와 함께 진입하거나 추세에 반대하여 반전으로, 그리고 열린 포지션의 폐쇄 가능성, 즉 시장을 종료할 가능성을 나타내는 데 모두 사용할 수 있습니다. 표시기는 사용하기가 매우 쉽습니다. 차트에 지표를 추가하고 필요에 따라 해당 신호를 따르기만 하면 됩니다. 이 도구는 외환 거래 및 바이너리 옵션 거래에 사용할 수 있습니다. 기본적으로 지표는 가격 반전을 예측하기 위해 분석이 수행되어 그러한 조건 형성의 가장 빠른 징후를 찾으려고 시도하기 때문에 신호를 약간 다시 그릴 수 있습니다. 다시 그리기는 사소하지만 가능합니다.
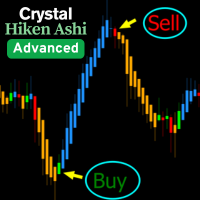
Crystal Heikin Ashi – 고급 시각화 Heikin Ashi (MT4 버전) 개요 Crystal Heikin Ashi for MetaTrader 4 는 전문적인 Heikin Ashi 지표로, 차트 시각화를 개선하고 프라이스 액션 트레이더, 스캘퍼, 분석가에게 명확성을 제공합니다.
이 MT4 버전은 순수한 Heikin Ashi 캔들에 중점을 두며, 가볍고 최적화된 성능을 제공합니다. 참고: 추세 기반 색상 및 고급 모멘텀 감지는 MT5 버전에서 제공됩니다:
MT5 버전 → https://www.mql5.com/en/market/product/142042 주요 기능 (MT4) 네이티브 Heikin Ashi 캔들. 상승/하락 색상 사용자 지정 가능. 기본 캔들 숨기기 옵션. 라이트/다크 테마 지원. 긴 데이터에서도 빠른 처리 속도. 가격 흐름과 반전을 명확히 표시. 파라미터 캔들 스타일: 표준. 차트 테마: 라이트/다크. 적합 대상 프라이스 액션 트레이더. 스캘퍼. MT4에서
FREE
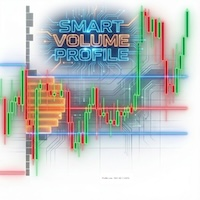
Korean "Smart Money" 스캔 (Volume Markers): 평균보다 높은 비정상적인 거래량을 녹색/빨간색 화살표로 명확하게 표시합니다. 이는 **세력(Smart Money)**의 진입을 식별하고 속임수 신호 를 걸러내는 데 도움을 줍니다. 주요 알림 (Alerts): 하루 종일 화면을 지켜볼 필요가 없습니다. 가격이 추세의 지속 또는 반전을 결정하는 중요한 지점인 **POC(매물대 중심)**를 교차할 때 시스템이 즉시 알림을 보냅니다. 실시간 시장 구조 확인 (Developing Profile): 현재 형성되고 있는 가격 주기의 프로필을 보여줍니다. 가격이 매집 구간 을 돌파하고 있는지, 아니면 평균으로 다시 회귀 하고 있는지 파악할 수 있습니다. thank you ..

Available for MT4 and MT5 . Join the Market Structure Patterns channel to download materials available for study and/or additional informations.
Related posts: Market Structure Patterns - Introduction Beyond Fancy Order Blocks: Using True Volumetric Analysis with Market Structure Patterns & Timeless Charts Market Structure Patterns is an indicator based on smart money concepts that displays SMC/ICT elements that can take your trading decisions to the next level. Take advantage
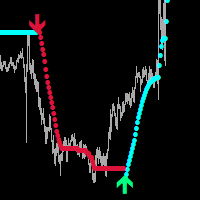
Global Parabolic MT4
Indicator for scalping on M1-M5.
A very good indicator for your trading system, it can be used as a standalone
trading system, I recommend using it together with - System Trend Pro The indicator does not repaint and does not change its data.
Settings:
Change the FILTER parameter for accurate market entries.
Any questions? Need help?, I am always happy to help, write me in private messages or
In telegram
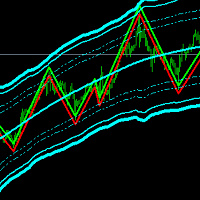
Channel Trend Bands – A Comprehensive Indicator for Market Analysis MetaTrader 5 Version
Simple to Use, Effective in Application User-Friendly and Suitable for All Traders This indicator stands out due to its straightforward functionality. Whether you're a beginner exploring the market or an experienced trader refining your strategy, this tool offers valuable insights. Using a Triangular Moving Average (TMA) with additional ATR-based bands , it provides structured market data to support well-i
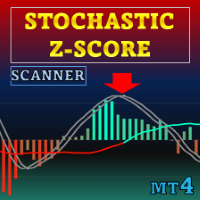
특별 제공 : 모든 도구 , 각 $35 ! 새 도구 는 첫 주 또는 최초 3회 구매 에 한해 $30 ! MQL5의 Trading Tools 채널 : 최신 소식을 받으려면 제 MQL5 채널에 가입하세요 Stochastic Z-Score 는 가격을 Z-Score 로 정규화하고, 확률적 로직으로 범위를 제한하며, HMA 로 평활화하는 모멘텀 오실레이터입니다. 장기 컨텍스트를 위해 ALMA 를 사용합니다. 선택 요소로 히스토그램, 동적 밴드, 반전 라벨이 있습니다.
MT5 버전 보기: Stochastic Z Score MT5 Scanner MT4 버전 보기: Stochastic Z Score MT4 Scanner 더 많은 제품: All P roducts Overview Stochastic Z-Score 는 변동성에 대해 정규화된 Z-Score 와 확률적 로직을 결합하고, Hull Moving Average(HMA) 로 평활화합니다.
가격 편차를 정규화된 신호로

Stratos Pali Indicator is a revolutionary tool designed to enhance your trading strategy by accurately identifying market trends. This sophisticated indicator uses a unique algorithm to generate a complete histogram, which records when the trend is Long or Short. When a trend reversal occurs, an arrow appears, indicating the new direction of the trend.
Important Information Revealed Leave a review and contact me via mql5 message to receive My Top 5 set files for Stratos Pali at no cost!
Dow

THE ONLY CURRENCY STRENGTH INDICATOR THAT IS BASED ON PRICE ACTION. DESIGNED FOR TREND, MOMENTUM & REVERSAL TRADERS
This indicator reads price action to confirm trend and strength . Advanced multi-currency and multi-time frame indicator that shows you simply by looking at one chart, every currency pair that is trending and the strongest and weakest currencies driving those trends.
For full details on how to use this indicator, and also how to get a FREE chart tool, please see user manual HERE
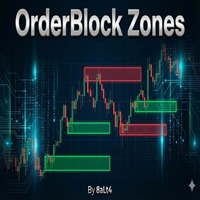
개요 OrderBlock Zone은 시장에서 기관 거래 구역(Order Blocks)을 자동으로 탐지하고 시각화하는 고급 MetaTrader 4 지표입니다. 대형 플레이어(은행, 헤지 펀드)가 남긴 흔적을 추적하여 잠재적인 지지선과 저항선을 식별합니다.
주요 기능 자동 오더블록 탐지 프랙탈 기반 분석: 36기간(사용자 정의 가능) 프랙탈 분석으로 강력한 반전 지점 식별 불 & 베어 존: 녹색 화살표 상승, 빨간색 화살표 하락 오더블록 표시 Engulfing Pattern 지원: 삼키기 캔들 패턴을 인식하여 더 강력한 신호를 생성합니다 시각적 도구 자동 레벨 라인: 각 OrderBlock에 대한 상한선 및 하한선 컬러 존: Bull(녹색) 및 Bear(빨간색) 구역이 명확히 구분됩니다 Engulfing Highlight: 삼키기 패턴을 파란색/주황색 사각형으로 강조 표시 깔끔한 인터페이스: 그리드가 자동으로 닫히고, 최적화된 보기를 위해 차트가 왼쪽으로 이동 사용자 정의 가능
FREE

시장의 두 가지 기본 원칙에 기반한 일중 전략. 알고리즘은 추가 필터를 사용하여 거래량 및 가격 파동 분석을 기반으로 합니다. 지표의 지능형 알고리즘은 두 가지 시장 요인이 하나로 결합될 때만 신호를 제공합니다. 지표는 더 높은 시간 프레임의 데이터를 사용하여 M1 차트에서 특정 범위의 파도를 계산합니다. 그리고 파동을 확인하기 위해 지표는 볼륨 분석을 사용합니다. 이 표시기는 준비된 거래 시스템입니다. 트레이더가 필요로 하는 모든 것은 신호를 따르는 것입니다. 또한 지표는 자신의 거래 시스템의 기초가 될 수 있습니다. 거래는 분 차트에서만 수행됩니다. 지표가 MTF 원리를 사용한다는 사실에도 불구하고 지표 알고리즘은 가능한 한 안정적입니다. 구매 후 반드시 저에게 편지를 보내주세요! 내 거래 설정 및 권장 사항을 공유하겠습니다!
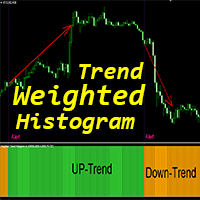
MT4용 Crypto_Forex 지표 "가중 추세 히스토그램", 리페인트 불필요
- 가중 추세 히스토그램 지표는 일반적인 이동 평균 교차 분석보다 훨씬 효율적입니다. - 추세 전략을 선호하는 트레이더에게 적합합니다. - 지표는 두 가지 색상으로 제공됩니다. 노란색은 하락 추세, 녹색은 상승 추세를 나타냅니다(색상은 설정에서 변경 가능). - 모바일 및 PC 알림 기능 제공 - 가격 변동, 스캘핑, 모멘텀 트레이딩 등 다른 거래 방식과 함께 사용하기 좋습니다. ..................................................................................................... 여기를 클릭하여 고품질 트레이딩 로봇과 지표를 확인하세요! 본 제품은 MQL5 웹사이트에서만 제공되는 오리지널 제품입니다.
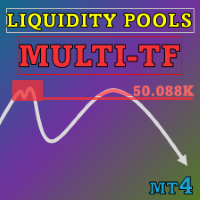
Special offer : ALL TOOLS , just $35 each! New tools will be $30 for the first week or the first 3 purchases ! Trading Tools Channel on MQL5 : Join my MQL5 channel to update the latest news from me Liquidity Pools 지표는 고급 도구로, 빈번하게 윅이 닿는 고점 및 저점을 분석하고 각 구역에서 거래된 재방문 횟수와 거래량을 분석하여 잠재적인 유동성 구역을 차트에 식별하고 표시합니다. 이 도구는 거래자에게 유동성이 쌓이는 시장 역학에 대한 종합적인 뷰를 제공하여 잠재적인 전환점을 예측하고 주요 지지 및 저항 수준을 식별하는 데 도움을 줍니다. MT5 버전 보기: Liquidity Pools MT5 다른 제품 보기: 모든 제품 주요 특징 및 혜택 1. 정확한 유동성 구역 식별 고영향 구역 강
** All Symbols x All Timeframes scan just by pressing scanner button ** After 18 years of experience in the markets and programming, Winner indicator is ready. I would like to share with you! *** Contact me to send you instruction and add you in "123 scanner group" for sharing or seeing experiences with other users. Introduction The 123 Pattern Scanner indicator with a special enhanced algorithm is a very repetitive common pattern finder with a high success rate . Interestingly, this Winner in
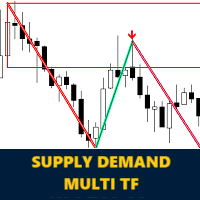
MetaTrader 4용 Koala 공급 수요 지표 소개 (긍정적이든 부정적이든 귀하의 리뷰나 피드백을 공유하여 다른 트레이더가 귀하의 경험을 통해 이익을 얻을 수 있도록 해주세요.) : 코알라 공급 및 수요 지표에 오신 것을 환영합니다. 이 지표는 끊임없는 공급 및 수요 지역을 식별하기 위해 설계되었습니다. 이 지표는 트레이더가 시장을 지역 영역으로 볼 수 있도록 도와주며 가격이 어떻게 강력한 지역을 존중하는지 확인할 수 있습니다. 또한 이 지표는 지역 내에서 형성된 가격 행동 신호를 보여줄 수도 있습니다. 코알라 트레이딩 솔루션 채널 에 가입하여 모든 코알라 제품에 대한 최신 소식을 확인하십시오. 가입 링크는 다음과 같습니다: https://www.mql5.com/en/channels/koalatradingsolution https://www.mql5.com/en/blogs/post/755700
!중요 : 이 제품에는 무료 전문가 고문 (EA)가 포함되어 있습니다. 구매 후
FREE

KT MACD Alerts는 MetaTrader에서 제공되는 표준 MACD 지표를 기반으로 한 맞춤형 구현입니다. 다음 두 가지 이벤트 발생 시 알림을 제공하며 차트에 수직선을 표시합니다: MACD가 0선을 위로 돌파할 때 MACD가 0선을 아래로 돌파할 때
기능 모든 시간 프레임에서 MACD 방향을 보여주는 MTF(멀티 타임프레임) 스캐너가 내장되어 있습니다. MACD의 0선 상단 및 하단 크로스 신호에 따라 거래하는 트레이더에게 적합합니다. 알림과 함께 수직선을 자동으로 표시하여 교차 지점을 더 쉽게 식별할 수 있습니다. 가볍고 최적화된 코드로 설계되어 메모리와 시스템 자원을 거의 소모하지 않습니다. 팝업, 알림음, 이메일, 푸시 알림 등 MetaTrader에서 제공하는 모든 알림 방식을 지원합니다.
MACD의 역사 MACD(Moving Average Convergence Divergence, 이동 평균 수렴 확산 지표)는 주식 및 외환 시장에서 널리 사용되는 기술적 분석
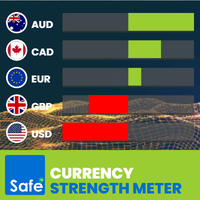
What Is the Currency Strength Meter? The Currency Strength Meter is an advanced yet easy-to-use indicator that measures the relative strength of 8 major currencies by analyzing their real-time performance across 28 currency pairs .
It visually ranks currencies from strongest to weakest, helping you: Spot high-probability trading opportunities
Match strong currencies against weak ones
Trade with confidence and precision
With just a glance at the dashboard, you'll know which currencies to trade –

FX Volume: 브로커 시각에서 바라보는 진짜 시장 심리 간단 요약
트레이딩 접근 방식을 한층 더 향상시키고 싶으신가요? FX Volume 는 소매 트레이더와 브로커의 포지션을 실시간으로 파악할 수 있게 해 줍니다. 이는 COT 같은 지연된 보고서보다 훨씬 빠릅니다. 꾸준한 수익을 추구하는 분이든, 시장에서 더 깊은 우위를 원하시는 분이든, FX Volume 을 통해 대규모 불균형을 찾아내고, 돌파 여부를 확인하며 리스크 관리를 정교화할 수 있습니다. 지금 시작해 보세요! 실제 거래량 데이터가 의사결정을 어떻게 혁신할 수 있는지 직접 경험해 보시기 바랍니다.
1. 트레이더에게 FX Volume이 매우 유익한 이유 탁월한 정확도를 지닌 조기 경보 신호
• 다른 사람들보다 훨씬 앞서, 각 통화쌍을 매수·매도하는 트레이더 수를 거의 실시간으로 파악할 수 있습니다.
• FX Volume 은 여러 리테일 브로커에서 추출한 실제 거래량 데이터를 종합해 명확하고 편리한 형태로 제공하는
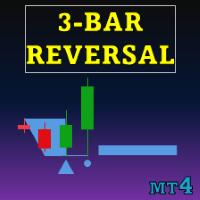
Special offer : ALL TOOLS , just $35 each! New tools will be $30 for the first week or the first 3 purchases ! Trading Tools Channel on MQL5 : Join my MQL5 channel to update the latest news from me 삼중 반전 패턴 지표 는 트레이더들에게 강력한 도구를 제공하여 가격 차트에 삼중 반전 패턴을 자동으로 식별하고 강조 표시합니다. 이 지표는 잠재적인 트렌드 반전을 탐지하는 데 유용하며, 통합된 트렌드 지표를 통해 신호 정확도를 향상시킬 수 있습니다. MT5 버전 보기: Three Bar Reversal Pattern MT5 다른 제품 보기: 모든 제품 주요 특징 자동 패턴 감지: 이 지표는 삼중 반전 패턴을 스캔하며, 명확한 시각적 신호로 표시하여 잠재적인 트렌드 반전 포인트를 인식하는 데 도움을 줍니다.
M1 Golding — This is an easy to use trading system. It is an arrow indicator designed for the M1-M5 time frame. The indicator can be used as a standalone scalping system, as well as as part of your existing trading system. Bonus: When you buy the indicator, you get a gift - Trend Arrow Super I also provide an additional trend filter indicator absolutely free of charge - Filter The combination of these indicators can help you make your trading easier and more accurate.
Indicator Parameters: Tre

Gold Pro Scalper
Precise entry points for currencies, crypto, metals, stocks, indices! Indicator 100% does not repaint!!!
If a signal appeared, it does not disappear! Unlike indicators with redrawing, which lead to loss of deposit, because they can show a signal, and then remove it.
Trading with this indicator is very easy.
Wait for a signal from the indicator and enter the deal, according to the arrow
(Blue arrow - Buy, Red - Sell).
I recommend using it with the Trend Filter (download

Day Trader Master 는 데이 트레이더를 위한 완벽한 거래 시스템입니다. 시스템은 두 개의 지표로 구성됩니다. 하나의 지표는 매수 및 매도를 위한 화살표 신호입니다. 얻을 수 있는 화살표 표시기입니다. 2차 지표를 무료로 드립니다. 두 번째 지표는 이러한 화살표와 함께 사용하도록 특별히 설계된 추세 지표입니다. 표시기는 반복하지 않고 늦지 않습니다! 이 시스템을 사용하는 것은 매우 간단합니다. 2색 선으로 표시되는 현재 추세 방향의 화살표 신호를 따라가기만 하면 됩니다. 파란색은 구매 추세입니다. 빨간색은 판매 추세입니다. 파란색 화살표는 매수 신호입니다. 빨간색 화살표는 매도 신호입니다. 추세선의 색상과 일치하려면 화살표의 색상과 신호의 방향이 필요합니다. 화살표 표시기는 주로 시간 간격 M5 및 M15에서 일중 거래를 위해 만들어졌습니다. 그러나 기술적으로 시스템은 다른 시간 간격으로 사용할 수 있습니다. 표시기에는 PUSH 메시지 기능이 있는 팝업 경고가 장착되어 있

The intention of the dashboard is to provide a quick overview of the daily, weekly and monthly range of configured assets. In "single asset mode" the dashboard shows you possible reversal points directly in the chart, thus making statistics directly tradable. If a configured threshold is exceeded, the dashboard can send a screen alert, a notification (to the mobile MT4) or an email. There are various ways of using this information. One approach is that an asset that has completed nearly 100% of

SMC Easy Signal was built to remove the confusion around the smart money concept by turning structural shifts like BOS (Break of Structure) and CHoCH (Change of Character) into simple buy and sell trading signals. It simplifies market structure trading by automatically identifying breakouts and reversals as they happen, allowing traders to focus on execution rather than analysis. Whether the market is continuing its trend or preparing to reverse, the indicator translates complex price action in

이 인디케이터는 두 번째 캔들스틱이 첫 번째 캔들스틱 안에 있을 때, 즉 한계를 벗어나지 않았을 때 차트에 신호를 표시합니다. 이 캔들 패턴을 이너 바라고 합니다. 이 패턴은 핀 바 또는 테이크오버만큼 대중적이지는 않지만 일부 트레이더가 사용하기도 합니다. 추세(2개 이동평균) 및 반전(RSI 및 볼린저 밴드)을 기준으로 필터링할 수 있습니다. 다중 통화 패널을 사용할 수 있습니다. 이를 통해 차트 사이를 쉽게 전환할 수 있습니다.
거래 패턴: 추세 재테스트. 거짓 브레이크아웃. 기타.
EURUSD, GBPUSD, XAUUSD, ... M15, M30, H1.
입력 매개 변수.
기본. Bars Count – 인디케이터가 작동할 히스토리 바의 수입니다. Min Ratio Candles - 첫 번째 캔들과 두 번째 캔들의 최소 비율입니다. Calc Mode - 내부 막대를 결정하는 방법 (HL, OC, HLOC).
필터. Filter 1 Trend And Reverse – 추

RSI(상대강도지수) 지표의 다중 통화 및 다중 시간대 수정. 매개변수에서 원하는 통화와 기간을 지정할 수 있습니다. 또한 패널은 과매수 및 과매도 수준을 넘을 때 알림을 보낼 수 있습니다. 마침표가 있는 셀을 클릭하면 해당 기호와 마침표가 열립니다. MTF 스캐너입니다.
차트에서 대시보드를 숨기는 키는 기본적으로 "D"입니다
통화 강도 측정기(CSM)와 마찬가지로 대시보드는 지정된 통화가 포함된 쌍 또는 해당 통화가 기본 통화로 포함된 쌍을 자동으로 선택할 수 있습니다. 표시기는 "쌍 집합"에 지정된 모든 쌍에서 통화를 검색합니다. 다른 쌍은 무시됩니다. 그리고 이 쌍을 기반으로 이 통화의 총 RSI가 계산됩니다. 그리고 그 통화가 얼마나 강하거나 약한지 알 수 있습니다.
매개변수 RSI Period — 평균 기간. RSI Applied price — 가격 유형. Clear the chart at startup — 시작 시 차트를 지웁니다 Set of Pairs — 기호

덮어 촛대 패턴을 표시하는 표시기. 설정에서 침몰 유형(몸,그림자 및 조합)을 지정할 수 있습니다. 추세(2 이동 평균)와 반전(리시 및 볼린저 밴드)으로 필터링 할 수 있습니다. 이것은 매우 인기있는 가격 행동 패턴입니다. 다중 통화 대시 보드를 사용할 수 있습니다. 그것으로,당신은 쉽게 차트 사이를 전환 할 수 있습니다.
거래 패턴: 트렌드 별 재시험. 거짓 브레이크 아웃. 주문 블록. 기타.
EURUSD, GBPUSD, XAUUSD, ... M15, M30, H1.
입력 매개변수.
인기 있는. Bars Count – 표시기가 작동하는 히스토리 바의 수. Calc Mode – 침몰 유형 선택. 3 Lines Strike (Close overlap First Open).
PPR (Close overlap High) - 가까운 오버랩 높은. High overlap High - 높은 오버랩 높은. Close overlap Open - 닫기 오버랩 열기. High and Cl

ZeusArrow Smart Liquidity Finder
Smart Liquidity Finder is Ai controlled indicator based on the Idea of Your SL is My Entry. It scan and draws the major Liquidity areas on chart partitioning them with Premium and Discount Zone and allows you find the best possible trading setups and help you decide the perfect entry price to avoid getting your Stop Loss hunted . Now no more confusion about when to enter and where to enter. Benefit from this one of it's kind trading tool powered by Ai an trade

The Forex Master Pattern is an alternative form of technical analysis that provides a framework which will help you to find and follow the hidden price pattern that reveals the true intentions of financial markets. This algorithm here does a good job detecting the Phase 1 of the Forex Master Pattern cycle, which is the contraction point (or Value).
On Phase 2 we get higher timeframe activation (also called Expansion), which is where price oscillates above and below the average price defined
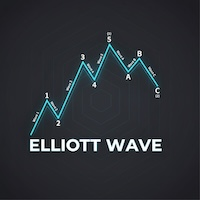
자동 엘리어트 파동 이론 (Automated Elliott Wave) 1. 자동 파동 카운팅 및 편향 감소 (객관성) 보통 엘리어트 파동 카운팅은 개인적인 "상상"이나 주관이 많이 개입됩니다. 이 보조지표는 다음과 같이 도와줍니다: 충격 파동(Impulse Wave 1-2-3-4-5) 탐지: 엄격한 규칙(예: 3파는 가장 짧을 수 없음, 4파는 1파와 겹칠 수 없음)을 사용하여 이론적으로 정확한 가격 구조를 보여줍니다. 조정 파동(Corrective Wave A-B-C) 탐지: 추세에 따라 재진입할 기회를 찾기 위해 가격 조정 구간을 포착합니다. 2. 다중 등급 분석 (Multi-Degree Analysis) 하나의 시간 프레임만 보는 것이 아니라 3가지 깊이 수준을 동시에 분석하여 시장을 입체적으로 보여줍니다: Minor (단기): 빠른 움직임 확인용. Intermediate (중기): 주요 추세 확인용. Primary (장기): 시장의 큰 흐름 확인용. 장점: 트레이딩 스타일에
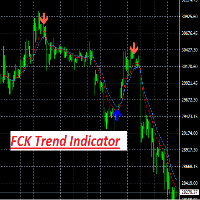
FCK Trend Indicator is an indicator for determining the current direction of price movement and reversal points. The indicator will be useful for those who want to see the current market situation better. The indicator can be used as an add-on for ready-made trading systems, or as an independent tool, or to develop your own trading systems. FCK Trend Indicator indicator, to determine the reversal points, analyzes a lot of conditions since the combined analysis gives a more accurate picture of t

PUMPING STATION – 당신만을 위한 올인원(All-in-One) 전략
PUMPING STATION은 당신의 외환 거래를 더욱 흥미롭고 효과적으로 바꿔줄 혁신적인 인디케이터입니다. 단순한 보조 도구가 아니라, 강력한 알고리즘을 갖춘 완전한 거래 시스템으로서 보다 안정적인 트레이딩을 시작할 수 있도록 도와줍니다. 이 제품을 구매하시면 다음의 혜택을 무료로 받으실 수 있습니다: 전용 설정 파일: 자동 설정으로 최대의 퍼포먼스를 제공합니다. 단계별 동영상 가이드: PUMPING STATION 전략으로 거래하는 법을 배워보세요. Pumping Utility: PUMPING STATION과 함께 사용하도록 설계된 반자동 거래 봇으로, 거래를 더욱 쉽고 편리하게 만들어줍니다. ※ 구매 후 바로 저에게 메시지를 보내주세요. 추가 자료에 대한 접근 권한을 제공해드립니다. PUMPING STATION은 어떻게 작동하나요? 트렌드 컨트롤: 시장의 추세 방향을 즉시 파악합니다. 추세는
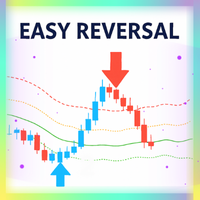
Easy Reversal is designed to help traders spot turning points in the market with clear buy and sell signals. The indicator is based on the Keltner Channel but improved with a custom calculation that uses ATR and EMA confirmation. This makes it more reliable and less noisy than standard reversal tools.
The signals from Easy Reversal appear directly from peak candlestick behavior, showing you when price action is reaching exhaustion. A buy signal is generated when a candlestick forms a strong r

This unique multi-currency strategy simultaneously determines the end of the trend, entry points and the expected take profit levels for each trade. The indicator can determine entry points on any trading period from M1 to D1. For the convenience of users, the indicator renders the entry point (in the form of an arrow), recommended take profit levels (Fast Take Profit, Middle Take Profit, Main Take Profit, Global Take Profit) and the Stop Loss level. The detailed guide on how to use the indicato
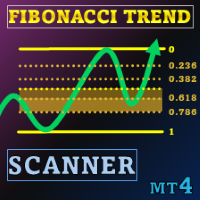
스페셜 오퍼 : ALL TOOLS , 각 $35 에 구매 가능! New tools will be $30 for the first week or the first 3 purchases ! Trading Tools Channel on MQL5 : Join my MQL5 channel to update the latest news from me 변동성이 큰 트레이딩 환경에서 강력하고 직관적인 분석 도구는 신속하게 기회를 포착하는 데 도움이 됩니다. Fibonacci Trend Scanner는 전통적인 피보나치(Fibonacci) 지표 기능과 SuperTrend를 통합할 뿐만 아니라, 통화쌍 스캔, 멀티 타임프레임 모니터링, 그리고 추세가 상승세에서 하락세로(또는 반대로) 전환될 때 인텔리전트 알림을 제공하도록 기능을 확장하였습니다. See more MT5 version at: Fibonacci Trend MT5 Scanner See more products a
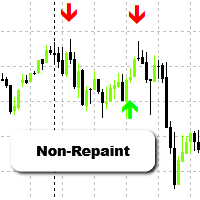
Spartan Arrows – Non-Repainting Buy/Sell Signals Spartan Arrows is a powerful MT4 indicator that delivers accurate buy and sell arrows directly on your chart. Built for traders who want clarity and precision, it filters out market noise and provides only high-probability signals. Once an arrow appears, it does not repaint – giving you the confidence to trade without second-guessing your entries and exits. Key Features Clear buy/sell arrows for instant decisions Non-repainting and non-lagging si

MT5 버전은 여기에서 이용 가능합니다:
https://www.mql5.com/en/market/product/50048 텔레그램 채널 & 그룹:
https://t.me/bluedigitsfx V.I.P 그룹 접속:
유료 제품 구매 증빙을 메시지로 보내주세요 추천 브로커:
https://bit.ly/BlueDigitsFxStarTrader BlueDigitsFx Easy 123 System — MT4용 강력한 반전 및 돌파 감지 시스템 초보자와 전문가 모두를 위한, 시장 구조 변화, 돌파 및 추세 반전을 쉽고 명확하게 감지할 수 있는 올인원 논리 재도색 방지(Non-Repaint) 인디케이터입니다. 이 인디케이터는 "123" 패턴을 따릅니다: 1단계: 잠재적 과매수/과매도 지점에서 큰 화살표로 새로운 고점 또는 저점을 식별 2단계: 구조가 깨졌음을 신호로 보내 추세 반전 가능성을 확인 3단계: 작은 화살표와 지지/저항 점으로 진입 신호를 확정 참고: 큰 화살표는 봉이 종료될
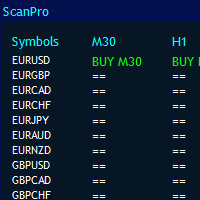
MT4 Universal Panel pro 는 ex4 파일을 포함한 모든 지표와 기간을 위해 설계되었습니다.
컴퓨터 전원과 최대 10시간 프레임을 기반으로 무한 쌍을 스캔할 수 있습니다. 패널의 크기는 자동으로 정렬됩니다.
버퍼로 모든 표시기를 호출할 수 있습니다.
모든 기본 및 사용자 지정 표시기에 대해 작동합니다. heikan ashi, rsi, 포물선, renko, 도형, 지지 저항, 수요 공급, 다이버전스, 고점 및 저점 이동 평균에 간단히 사용할 수 있습니다.
모든 통화에 대해 하나의 창에서 작동할 수 있습니다. 설정에 대한 질문이 있으면 연락하십시오.
이것은 모든 쌍에서 작동하는 mt4 대시보드입니다. 다음과 같이 쌍 이름을 입력하기만 하면 됩니다. 모든 외환 표시기를 호출하고 해당 신호 막대를 확인합니다.
즉. 패널 작업을 원하고 3쌍만 스캔하고 여러 시간 프레임을 입력하려면 다음과 같이 입력하십시오.
기호 : EURUSD,GBPUSD,USDJPY
시간 프레
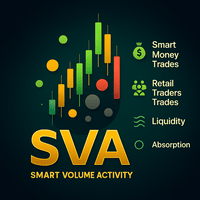
Smart Volume Activity [SVA] is an advanced analytical indicator designed for MetaTrader platforms. It reveals how institutional (Smart Money) and retail traders operate by analyzing volume behavior across multiple timeframes . Unlike ordinary volume tools, SVA automatically adapts to any chart timeframe and highlights zones of absorption — moments when large market participants absorb liquidity from weaker hands. By detecting abnormal volume spikes far beyond typical mark
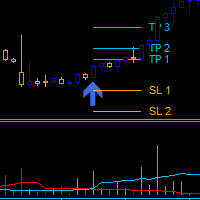
Dark Power is an Indicator for intraday trading. This Indicator is based on Trend Following strategy, also adopting the use of an histogram to determine the right power . We can enter in good price with this Indicator, in order to follow the strong trend on the current instrument. The histogram is calculated based on the size of the bars and two moving averages calculated on the histogram determine the direction of the signal
Key benefits
Easily visible take profit/stop loss lines Intui

슬레이어 바이너리는 이진 옵션 1캔들 스트라이크 화살표 표시기입니다. 이 지표는 성배를 찾는 사람들을 위한 것이 아닙니다. 일반적으로 거래에 있어 비현실적인 접근법이기 때문입니다. 이 지표는 꾸준한 성공률을 제공하며, 자금 관리와 일일 목표와 함께 사용하면 더욱 신뢰할 수 있습니다. 이 지시기에는 아래에 나열된 여러 기능이 포함되어 있습니다:
기능 재도색 없음: 지시기는 활력을 다시 칠하지 않습니다;화살표가 주어지면, 가격이 반대 방향으로 움직여도 그 화살표는 그 자리에 머무릅니다. 통계 패널: 전체 승률 %와 연속된 최대 손실-승리 신호 등 지표 성능 통계를 보여주는 패널 다이버전스 기반 검증된 논리: 이 지표는 다이버전스 전략을 사용해 매수/매도 화살표를 결정합니다. 6개 이상의 추가 필터: 인디케이터에는 승률을 높이고 무제한 콤보를 테스트할 수 있는 다양한 필터가 있습니다. 거래는 어떻게 하나요? 단순히 상승 화살표가 인쇄될 때 콜/매수를 열고, 현재 사용 중인 그 시간대의

유동성 충격 감지기 (XAUUSD 1분봉 버전) ======================================================
간략 설명: ----------------------------------- 급격한 가격 변동으로 생성되는 기관 유동성 영역을 감지하고 다중 시간대 추세 분석을 제공합니다.
상세 설명: -----------------
유동성 충격 감지기는 기관 활동을 나타내는 중요한 가격 변동을 식별합니다. 대규모 시장 참여자가 포지션을 진입하거나 청산할 때 가격이 자주 재진입하는 유동성 영역이 생성됩니다. 이 지표는 이러한 영역을 자동으로 감지하고 여러 시간대에 걸쳐 실시간 추세 분석을 제공합니다.
작동 방식
이 지표는 가격 변동 속도와 캔들 크기를 모니터링하여 급격한 움직임을 감지합니다. 중요한 변동이 발생하면 검증 기간을 통해 해당 영역이 유효한지 확인합니다. 검증된 영역은 차트에 명확한 시각적 표시와 함께 표시되어 영역의 강도와 방향을

트렌드 캐처 (The Trend Catcher): 알림 인디케이터가 포함된 트렌드 캐처 전략은 트레이더가 시장의 추세와 잠재적인 진입 및 청산 지점을 식별하는 데 도움이 되는 다기능 기술 분석 도구입니다. 시장 상황에 따라 적응하는 동적 트렌드 캐처 전략을 특징으로 하며, 추세 방향을 명확하게 시각적으로 보여줍니다. 트레이더는 개인의 선호도와 위험 허용 범위에 맞게 매개변수를 사용자 지정할 수 있습니다. 이 인디케이터는 추세 식별을 돕고, 잠재적 반전 신호를 제공하며, 트레일링 스탑 메커니즘으로 작동하고, 실시간 알림을 통해 신속한 시장 대응을 가능하게 합니다. 기능: 추세 식별: 상승 및 하락 추세를 신호로 표시합니다.
추세 반전: 캔들 색상이 상승에서 하락으로 또는 그 반대로 변할 때 잠재적 반전을 알립니다.
실시간 알림: 새로운 추세가 감지되면 알림을 생성합니다. 추천: 통화쌍: EURUSD, AUDUSD, XAUUSD…
시간 프레임: M5, M10, M15, M30, H1.
FREE

"이 인디케이터는 바이스트라 패턴 이론을 기반으로 한 입장을 감지하고 목표 및 중지 레벨을 갖춘 한정 주문을 놓을 수 있는 입장 가치를 제공합니다. 이를 통해 리스크 비율을 계산할 수 있습니다. 참고: 이 인디케이터에는 EA에서 사용할 수 있는 버퍼가 있습니다. 이 제품을 사용하는 동안 좋은 자금 관리를 실천하는 것이 중요합니다. 시간 프레임을 변경할 때, 인디케이터는 마지막 세션에서 사용한 템플릿을 저장합니다. 이 방법을 배우려면 구매 후 저희에게 연락하고 리뷰를 추가해주시기 바랍니다. 매개변수: 시스템 비주얼 사용 - 이 제품의 비주얼 테마를 활성화/비활성화합니다. 속도 관련 - 마지막 웨이브의 빠른 움직임 중에만 패턴을 감지하도록 활성화/비활성화합니다. 마지막 양식 카운터 표시 - 양식 타이머를 활성화/비활성화합니다. 양식 카운터 색상 - 양식 타이머 텍스트의 색상입니다. 상승 패턴 색상 - 상승 패턴의 색상입니다. 하락 패턴 색상 - 하락 패턴의 색상입니다. 알림 보내기 -
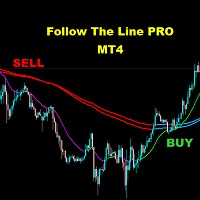
FOLLOW THE LINE (PRO VERSION) This powerful indicator is the full and complete version of my free indicator called "Follow The Line". IT IS BASED ON the popular maxim that: "THE TREND IS YOUR FRIEND" It gives alarms and alerts of all kinds. IT DOES NOT REPAINT and can be used for all currency pairs and timeframes.
AVOID FALSE SIGNALS:
BUY ONLY when price closes above the green line and the green line is above the blue channel.
SELL ONLY when price closes below the pink line and the pink line i
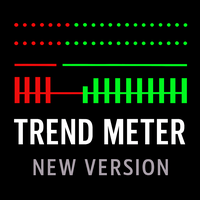
MetaTrader 4용 다중 통화 추세 분석 지표로, 여러 시간 프레임에서 추세 방향과 추세 강도를 시각화합니다. 분석 목적 전용입니다. TREND METER – 다중 통화 추세 분석 지표 (MT4) Trend Meter는 여러 시간 프레임과 심볼에서 추세 방향, 추세 강도 및 추세 정렬 상태를 시각화하도록 설계된 기술적 추세 분석 지표입니다. 본 지표는 시각적 분석 전용이며 자동으로 거래를 실행하지 않습니다. 개념 시장 추세는 시간 프레임과 거래 상품에 따라 달라질 수 있습니다.
Trend Meter는 여러 내부 추세 계산을 통합하여 간결한 시각적 형식으로 표시함으로써 시장 상황을 빠르게 평가할 수 있도록 돕습니다. 본 지표는 다음에 중점을 둡니다: 추세의 존재 여부 추세 방향 상대적인 추세 강도 여러 추세 모듈 간의 일치 여부 지표 구조 Trend Meter는 세 개의 독립적인 추세 모듈로 구성됩니다: Trend Meter 1 조기 반응형 추세 로직 단기 변화에 대한 높은
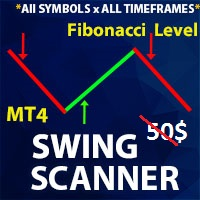
** All Symbols x All Time frames scan just by pressing scanner button ** Discount: The price is $50$, But now it is just $35, Limited time offer is active.
*** Contact me to send you instruction and add you in "Swing scanner group" for sharing or seeing experiences with other users. Swing EA: https://www.mql5.com/en/market/product/124747 Introduction: Swing Scanner is the indicator designed to detect swings in the direction of the trend and possible reversal swings. The indicator studies sev

캔들 타이머 카운트다운은 현재 막대가 닫히고 새 막대가 형성되기까지 남은 시간을 표시합니다. 시간 관리에 사용할 수 있습니다.
MT5 버전은 여기 !
기능 하이라이트 현지 시간이 아닌 서버 시간을 추적합니다. 구성 가능한 텍스트 색상 및 글꼴 크기 기호 일일 변동의 선택적 시각화 CPU 사용량을 줄이기 위해 최적화
입력 매개변수
일별 편차 표시: 참/거짓 텍스트 글꼴 크기 텍스트 색상
여전히 질문이 있는 경우 다이렉트 메시지로 저에게 연락하십시오. https://www.mql5.com/ko/users/robsjunqueira/
이것이 우리가 지속적으로 발전 할 수있는 유일한 방법이기 때문에 개선을위한 제안에 부담없이 문의하십시오. 또한 당사의 다른 지표 및 전문 고문에 대해 알아보십시오. 다양한 유형의 자산을 거래할 수 있는 다양한 상품이 있음을 알 수 있습니다.
FREE

Did You Have A Profitable Trade But Suddenly Reversed? In a solid strategy, exiting a trade is equally important as entering.
Exit EDGE helps maximize your current trade profit and avoid turning winning trades to losers.
Never Miss An Exit Signal Again
Monitor all pairs and timeframes in just 1 chart www.mql5.com/en/blogs/post/726558
How To Trade You can close your open trades as soon as you receive a signal
Close your Buy orders if you receive an Exit Buy Signal. Close your Sell orders if

Special offer : ALL TOOLS , just $35 each! New tools will be $30 for the first week or the first 3 purchases ! Trading Tools Channel on MQL5 : Join my MQL5 channel to update the latest news from me Volumatic VIDYA (Variable Index Dynamic Average) 는 트렌드를 추적하고 각 트렌드 단계에서 매수 및 매도 압력을 분석하기 위해 설계된 고급 지표입니다. 가변 지수 동적 평균(Variable Index Dynamic Average)을 핵심 동적 평활화 기술로 활용하여 이 도구는 주요 시장 구조 수준에서 가격 및 거래량 역학에 대한 중요한 통찰력을 제공합니다. MT5 버전 보기: Volumatic VIDyA MT5 다른 제품 보기: 모든 제품 To use iCustom

Ultimate MTF Support & Resistance - 5 Star Best Seller New Year Sale - Save $20 (normal price $79) Beginner or Professional our best selling multi-timeframe Pivot Prof will enhance your trading and bring you great trade opportunities with the Support and Resistance levels that professionals use. Pivot trading is a simple effective method for entering and exiting the market at key levels and has been used by professionals for decades and works on all symbols: Forex, Crypto, Stocks, Indicies et

Effortless trading: non-repainting indicator for accurate price reversals This indicator detects price reversals in a zig-zag fashion, using only price action analysis and a donchian channel. It has been specifically designed for short-term trading, without repainting or backpainting at all. It is a fantastic tool for shrewd traders aiming to increase the timing of their operations. [ Installation Guide | Update Guide | Troubleshooting | FAQ | All Products ] Amazingly easy to trade It provides

The indicator displays volume clusters or volume profiles to choose from.
Input variables
StepPoint - cluster step in points, if the value is zero, the step is assigned automatically. AssociatedTimeframe - binding the indicator to the specified timeframe of the chart, if the value is equal to Current, the indicator works on all timeframes. ClustersVolume - volume in clusters: All - all volume. Active - active volume (which produced the price movement). ClustersAsDelta - difference betwee
This Indicator only places quality trades when the market is really in your favor with a clear break and retest. Patience is key with this price action strategy!
If you want more alert signals per day, you increase the number next to the parameter called: Support & Resistance Sensitivity. After many months of hard work and dedication, we are extremely proud to present you our Break and Retest price action indicator created from scratch. One of the most complex indicators that we made with over
** All Symbols x All Timeframes scan just by pressing scanner button ** - Discount : it is not 50$, it is just 39$. *** Contact me to send you instruction and add you in "Head & Shoulders Scanner group" for sharing or seeing experiences with other users. Introduction: Head and Shoulders Pattern is a very repetitive common type of price reversal patterns. The pattern appears on all time frames and can be used by all types of traders and investors. The Head and Shoulders Scanner in

우리의 지지 또는 저항 수준은 시장의 가격 움직임이 반전되고 방향이 바뀌면서 시장에 고점 또는 저점(스윙 포인트)을 남길 때 형성됩니다. 지원 및 저항 수준은 거래 범위를 개척할 수 있습니다. 지표는 지표 세트에 정의된 X개의 막대( 기간 )를 기반으로 스윙 하이 및 스윙 로우를 식별합니다.
참고: 가격 조치 표시기가 마음에 들면 하나의 추세 표시기(추세 스크리너, 추세선, 강한 추세 및 추세 반전 신호 등)를 모두 사용해 보십시오. 그것을 얻으려면 , 여기를 클릭하십시오
주요 특징들 기술적 분석의 핵심 개념은 저항이나 지지 수준이 무너지면 그 역할이 역전된다는 것입니다. 가격이 지원 수준 아래로 떨어지면 그 수준은 저항이 될 것입니다. 가격이 저항선 위로 올라가면 종종 지지선이 됩니다. 수평 지원 및 저항 수준은 이러한 수준의 가장 기본적인 유형입니다. 그들은 단순히 수평선으로 식별됩니다.
차트의 녹색 레벨은 저항 레벨입니다. 차트의 빨간색 레벨은 지원 레벨입니다.
우리의
FREE

다시 색을 칠하지 않고 거래에 진입할 수 있는 정확한 신호를 제공하는 MT4용 지표입니다. 외환, 암호화폐, 금속, 주식, 지수 등 모든 금융 자산에 적용할 수 있습니다. 매우 정확한 추정값을 제공하고 매수와 매도의 가장 좋은 시점을 알려줍니다. 하나의 시그널로 수익을 내는 지표의 예와 함께 비디오 (6:22)시청하십시오! 대부분의 거래자는 Entry Points Pro 지표의 도움으로 첫 거래 주 동안 트레이딩 결과를 개선합니다. 저희의 Telegram Group 을 구독하세요! Entry Points Pro 지표의 좋은점. 재도색이 없는 진입 신호
신호가 나타나고 확인되면(시그널 캔들이 완성된 경우) 신호는 더 이상 사라지지 않습니다. 여타 보조지표의 경우 신호를 표시한 다음 제거되기 때문에 큰 재정적 손실로 이어집니다.
오류 없는 거래 게시
알고리즘을 통해 트레이드(진입 또는 청산)를 할 이상적인 순간을 찾을 수 있으며, 이를 통해 이를 사용하는 모든 거래자의 성공률이

Nas100 killer V2 (See video of how we test the indicator live) 1000% non-repaint indicator appears on current candlestick. Timeframes: M5, M15, M30, H1, H4. Works on pairs such as (NAS100, US30, SPX500, and Gold) The indicator is strictly for scalping do not hold trades for too long. Orange arrows look for selling opportunities. Light Blue arrows look for buying opportunities.
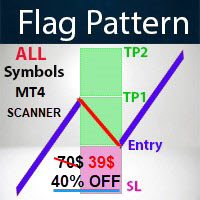
- Real price is 80$ - 50% Discount ( It is 39$ now ) Contact me for instruction, any questions! Related Product: Gold Expert , Professor EA - Non-repaint - Lifetime update free
I just sell my products in Elif Kaya Profile, any other websites are stolen old versions, So no any new updates or support. Introduction Flag patterns are an important tool for technical traders. Flags are generally considered to be a period of consolidation where the price of a security is caught in a range afte
MetaTrader 마켓은 거래로봇과 기술지표를 판매하기에 최적의 장소입니다.
오직 어플리케이션만 개발하면 됩니다. 수백만 명의 MetaTrader 사용자에게 제품을 제공하기 위해 마켓에 제품을 게시하는 방법에 대해 설명해 드리겠습니다.
트레이딩 기회를 놓치고 있어요:
- 무료 트레이딩 앱
- 복사용 8,000 이상의 시그널
- 금융 시장 개척을 위한 경제 뉴스
등록
로그인
계정이 없으시면, 가입하십시오
MQL5.com 웹사이트에 로그인을 하기 위해 쿠키를 허용하십시오.
브라우저에서 필요한 설정을 활성화하시지 않으면, 로그인할 수 없습니다.