MetaTrader 4용 기술 지표 - 13
Introducing the Swing Point Model Indicator – A Professional Trading Tool The Swing Point Model Indicator is an innovative tool designed for traders who want to capture market structure and identify potential trading opportunities. With a logical and transparent approach, the Swing Point Model helps you gain deeper market insights and make precise trading decisions. This is multiple Timeframe indicator so you can choose Higher timeframe for detect Swing point model What Is the Swing Point Mo
Scalp Arrow Exit Signals (MT4 Indicator) All-in-One MT4 Signals: Precise Entries, Exits & Re-entries for Any Trading Style! The "Scalp Arrow Exit Signals" is a professional-grade trading indicator for MetaTrader 4 (MT4) , engineered to be your comprehensive guide for reliable entry, exit, re-entry, retracement entry, and pull-back entry signals . This powerful forex tool operates as a complete "black-box" system, providing clear, actionable buy and sell signals with robust alerts across any inst
설명:
MetaTrader 4용 NR4 & NR7 Inside Bar Highlighter 는 NR4 또는 NR7 과 Inside Bar 의 조합에 기반한 가격 압축 패턴을 자동으로 감지하는 지표입니다. 작동 방식:
**NR4 (Narrow Range 4)**는 최근 4개 봉 중 범위가 가장 좁은 봉을 식별하고, NR7 은 최근 7개 봉을 고려합니다. 이러한 좁은 범위 조건이 Inside Bar (이전 봉 안에 완전히 포함된 봉)과 동시에 발생하면, 종종 강력한 브레이크아웃 이전의 저변동성 국면을 시사합니다. 이 패턴들은 브레이크아웃 전략에서 널리 활용됩니다. 강조된 신호:
지표는 차트 상에서 관련 봉들을 설정 가능한 색상으로 표시합니다: NR4 + Inside Bar: 흰색 NR7 + Inside Bar: 주황색 각 신호에는 시각적 식별을 위한 라벨도 함께 표시됩니다. 통합 및 알림:
이 시스템은 MetaTrader 4에서 시각적 알림 , 이메일 , 사운드 또는 맞춤형 트레
FREE

키 존 감지기 (Key Zone Detector)
공급 및 수요 존 감지기 (Key Level Supply & Demand Zone Detector) 개요 (Overview)
시장에서 중요한 활동이 발생하는 주요 가격 수준을 식별하고 평가하는 정교한 공급 및 수요 존 감지 지표입니다. 프랙탈 분석과 다중 검증 방법을 사용하여 거래 존을 감지하고 분류합니다. 주요 기능 (Key Features) 존 감지 (Zone Detection) 지지 및 저항 존 자동 감지 확인을 위한 이중 프랙탈 시스템(빠른/느린) 사용 ATR(평균 실제 범위) 기반 동적 존 두께 더 깔끔한 표시를 위해 중복 존 병합 존 분류 (Zone Classification) 검증된 존(Proven Zones): 4회 이상 테스트, 최고 신뢰성 확인된 존(Verified Zones): 1-3회 테스트, 양호한 신뢰성 미검증 존(Untested Zones): 첫 테스트 대기 중인 새 존 변절 존(Turncoat Zone

Overview Happy Devil is an Auto-Fibonacci Retracement Indicator designed to eliminate the subjectivity of manual drawing. It identifies market swings automatically Key Functions 1. Visual Legend Blue Lines (0.0% & 100.0%): Represent the boundaries of the current price swing. Red Line (61.8%): Highlights the "Golden Ratio," a critical level for trend reversals or retracements. White Lines: Represent the secondary retracement levels (23.6%, 38.2%, 50.0%, 78.6%). Auto-Extend Right: All lines aut
FREE

Time Session OPEN-HIGH-LOW-CLOSE This Indicator Will Draw Lines Of OHLC Levels Of Time Session Defined By User. It Will Plot Floating Lines On Current Day Chart. Time Session Can Of Current Day Or Previous Day. You Can Plot Multiple Session Lines By Giving Unique ID To Each Session. It Can Even Show Historical Levels Of Time Session Selected By User On Chart To Do Backdating Test. You Can Write Text To Describe The Lines.
FREE

FX Correlation Matrix is a powerful multi-timeframe dashboard that helps traders analyze real-time currency correlations of up to 28 symbols at a glance. With customizable settings, sleek design, and manual symbol selection option, it enhances trade accuracy, reduces risk, and identifies profitable correlation-based opportunities. Setup & Guide: Download MT5 Version here. Follow our MQL5 channel for daily market insights, chart, indicator updates and offers! Join here.
Read the product des

** All Symbols x All Timeframes scan just by pressing scanner button ** *** Contact me to send you instruction and add you in "Wolfe Wave Scanner group" for sharing or seeing experiences with other users. Introduction: A Wolfe Wave is created with five-wave patterns in price. It shows supply and demand and a fight towards a balance price. T hese waves of price actions can help traders identify the boundaries of the trend . Also It helps forecast how the price will move in the near future

YOU CAN NOW DOWNLOAD FREE VERSIONS OF OUR PAID INDICATORS . IT'S OUR WAY OF GIVING BACK TO THE COMMUNITY ! >>> GO HERE TO DOWNLOAD The system is a free open source pine script originally published on TradingView by everget . It was converted to Mt4 by Forex Robot Makers. This system is a popular trend indicator based on ATR ( Average True Range ) , Moving Averages and the Donchian channel .
System BackGround
ATR The average true range is an indicator of the price volatility of an asse
FREE

PLEASE NOTE You can customize the settings of Fast EMA, Slow EMA, MACD SMA & Main SMA. The accuracy will change as per your settings.
100% Non repaint indicator
Pre-alert (get ready) signals
Non-delay indications
24/7 signals
100% No lag
No recalculating The arrows wont repaint even if the signal fails, or you refresh or restart the mt4 Indicator is based on simple crossover strategy of main line and signal line of MACD indicator in consideration with zero line and Main SMA. The best thing
FREE
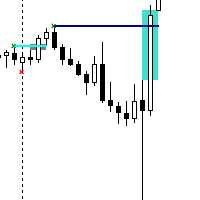
The Contraction/Expansion Breakout Indicator for MetaTrader 4 (MT4) is a powerful tool crafted to identify and signal the breakout of bullish and bearish contraction or expansion formations within financial markets. Utilizing advanced algorithmic calculations, this indicator assists traders in recognizing significant price movements that frequently accompany these formations, providing valuable insights for strategic trading decisions. Key Features: Contraction and Expansion Identification: The
FREE

Round Numbers Levels indicator for MT4 Round Numbers indicator is a simple but useful indicator to draw 00 and 50 price levels in your chart.
These levels act as supports and resistances, and therefore should be taken into account when trading.
These levels can be used as profit targets or entry points.
Inputs of the indicator are:
TGridColor00: color to be used for xx00 levels GridStyle00: line style to be used for xx00 levels GridWidth00: line width to be used for xx00 levels GridColor50:
FREE
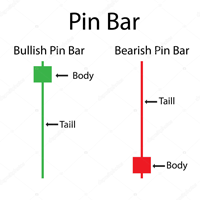
Pin bar pattern is characterized by a long upper or lower wick with a small body relative to the size of the wick with little to no lower or upper shadows. Pin bars are not to be traded in isolation , but need to be considered within the larger context of the chart analysis. A pin bar entry signal, in a trending market, can offer a very high-probability entry and a good risk to reward scenario.
Inputs MinimumTailPips- Minimum size of Tail in pips; TailBodyCandle- means how many times Tail grea
FREE
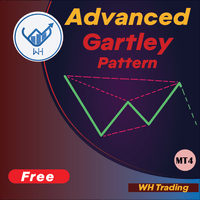
고급 Gartley 패턴 인식 표시기에 오신 것을 환영합니다. 이 지표는 가격 구조의 HH 및 LL과 피보나치 수준을 기반으로 가틀리 패턴을 감지하고 특정 피보나치 수준이 충족되면 지표가 차트에 패턴을 표시합니다. MT5 버전 : WH 고급 가틀리 패턴 MT5
**이 표시기는 콤보 의 일부입니다 WH Ultimate Harmonic Patterns MT4 , 모든 패턴 인식을 포함하는 .** 특징 : 높은 가틀리 패턴 검출을 위한 고급 알고리즘 정확도 . 매우 빠른 그리고 낮은 리소스(머신에 덜 요구됨). 아니요 지연 ...도 아니다 다시 칠하십시오 . 관습 피보나치 수준 조정(선호하는 설정에 따라 피보나치 수준을 변경할 수 있음). 보여주다 약세 그리고 강세 패턴을 동시에(약세 또는 강세 설정에 대해 여러
FREE
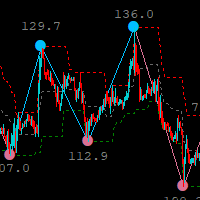
지그재그 표시기를 기반으로 하는 지그재그 고저 채널 표시기는 거래자에게 추세 변화를 알리는 도구이며 매우 유용합니다.
현재 추세의 변화에 대한 조기 경고를 제공하므로 지표에는 더 높거나 낮은 시간대를 거래할 수 있는 다중 시간대 옵션이 있습니다.
현재 시간대의 채널, 이 표시기는 시스템/전략에 추가되며 거래를 위해 독립형으로 사용할 수 있지만 사용을 권장합니다.
그것은 당신의 무기고에 추가됩니다.
=========================== =========================== =========================== ======================================== ===== =
FREE

A trend indicator showing the strength of bulls and bears in a trading range.
Consists of two lines:
The green line is a balanced overbought/oversold condition. The red line is the direction of trading activity. Does not redraw calculations.
Can be used on all Symbols/Instruments/Time Frames.
Easy to use and set up.
How to use the indicator and what it determines.
The basic rule is to follow the direction of the red line:
if it crosses the green line from the bottom up, the market is dominat
FREE
The Super Arrow PRT Indicator generates high-probability trading signals by using multiple indicators such as Moving Averages, Bull/Bear power, Relative Strength Index (RSI), Bollinger Bands, and Magic Filter. It filters out false signals and provides good trade signals by combining these indicators. The Supper Arrow PRT indicator is a trend reversal system that paints buy/sell signal arrows at the potential reversal zone of the price. The buy/sell signal arrows are painted directly on the ch
FREE

Dashboard uses Ichimoku Strategy to find best trades.
Get extra Indicators/Template: And read more about detailed Product Description and usage here: https://www.mql5.com/en/blogs/post/747457
Read more about Scanner Common features in detail here: https://www.mql5.com/en/blogs/post/747456
Features:
Price Kumo Breakout Tenkan-Kijun Cross Chikou/CLoud and Chikou/Price Support/Resistance (SR-SS or SR-NRTR) Stochastic OB/OS and back Awesome Oscillator Higher Timeframe Ichimoku Trend Align
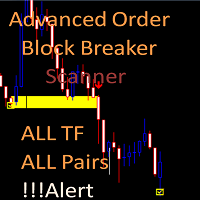
Advanced Order Block Breaker Scanner
This Scanner is free to download but is dependent on you owning the advance order block breaker indicator. Need to purchase the indicator here: https://www.mql5.com/en/market/product/59127
MT5 version: https://www.mql5.com/en/market/product/62769
The Scanner will show you on a single chart all the timeframes (M1 to Monthly) with their own status for the indicator: advance order block breaker Scan all time frame and all symbol: breaker's smart algor
FREE

---- Brand New Strategy. Three Month Rent is $30. ONE YEAR RENT ONLY $50. FREE EURUSD VERSION AVAILABLE UNDER << Forecast System Gift >>. NO NEED FOR BACKTEST! Link to the FREE version --> https://www.mql5.com/en/market/product/110085?source=Site --- This is a simple strategy based on BREAKOUT and FIBONACCI levels. After a breakout, either, the market: - continues the move directly to the 161, 261 and 423 levels, or - retraces to the 50% level (also called a correction) and thereafter continues
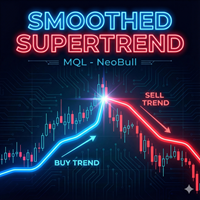
Smoothed Supertrend 지표 - 변동성 기반 추세 지표와 평활화 기능 Smoothed Supertrend 지표는 MetaTrader 4 용 클래식 Supertrend 지표의 향상된 버전입니다. 추가 평활화 기능을 통합하여 시장 노이즈를 줄이고 추세 신호의 품질을 향상시킵니다. 기술 설명: 이 지표는 시장 변동성을 측정하기 위한 Average True Range(ATR)를 기반으로 하며, 가격 데이터의 이동 평균 평활화와 결합합니다. 결과 라인은 현재 추세 방향을 표시하고 변동성 변화에 동적으로 적응합니다. 계산 방법: 가격의 이동 평균(MA) 계산 N개 기간에 걸친 Average True Range(ATR) 계산 상하단 밴드 계산: 상단 밴드 = MA + (ATR × 승수) 하단 밴드 = MA - (ATR × 승수) 밴드에 대한 종가 위치를 기반으로 한 추세 결정 단계 로직: 라인은 추세 반전 시에만 변경 입력 매개변수: ATR_Period(기본값: 10) - ATR 계
FREE

This indicator provides the ability to recognize the SMC pattern, essentially a condensed version of the Wyckoff model. Once the pattern is confirmed by RTO, it represents a significant investment opportunity. There are numerous indicators related to SMC beyond the market, but this is the first indicator to leverage patterns to identify specific actions of BigBoy to navigate the market. Upgrade 2024-03-08: Add TP by RR feature. The SMC (Smart Money Concept) pattern is a market analysis m

Title: BBMA Structure Guide - BBMA Structure Guide
Description: BBMA Structure Guide is a specialized MQL4 indicator designed to help traders understand the journey of BBMA structure more easily and efficiently. BBMA, or "Bollinger Bands Moving Average," is known for its motto "One Step Ahead," highlighting the importance of understanding market structure in depth.
With BBMA Structure Guide, you can quickly identify the underlying market structure patterns that drive price movements. This wil

IceFX SpreadMonitor is a special spread logging indicator which displays the current, minimum/maximum and average spread values. These values are set to be visible even after a reboot. Also, SpreadMonitor could save all the desired spread values to .csv files for later analysis of the results.
Indicator parameters: SpreadLowLevel - low level of spread (show value in green color) SpreadHighLevel - high level of spread (show value in red color) BGColor - background of panel SpreadNormalColor - co
FREE

제시된 지표는 금융 상품의 변동성을 평가하고, 가격 움직임 방향에서 큰 변화가 발생하는 순간에 대한 신호를 높은 효율성으로 제공합니다. 이 지표는 직관적이고 사용하기 쉽습니다. 지표 신호는 막대 형성이 완료된 후에 생성되며, 막대 형성이 완료되면 지표가 0을 기준으로 위치가 변경됩니다. 지표는 결코 신호를 다시 그리지 않습니다. 지표 신호는 지표가 0에 대한 상대적 위치가 변경되는 막대의 최대값/최소값을 초과하는 가격으로 확인되어야 합니다. 이 표시기를 사용하면 모바일 단말기로 이메일과 메시지를 보낼 수 있습니다. 구성 가능한 지표 매개변수: Sensitivity - 금융 상품의 변동성에 대한 지표 민감도 Signal_on_Chart - 해당 지표는 지표 창뿐만 아니라 가격 차트에도 신호를 표시합니다. UP_Symbol_Type - 가격 차트에 표시되는 "상승" 신호에 대한 심볼 유형입니다. DN_Symbol_Type - 가격 차트에 표시되는 "하락" 신호에 대한 심볼 유형입니다.

简介
不重绘入场信号的趋势指标 显示精确的价格反转指标。是可以添加到任何图表中的交易武器。 反转信号有高度准确性,适合在5分钟进行剥头皮交易,或在30分钟波段交易。买入和卖出箭头在图表上显示为进入信号,但在K线结束后形成带有警报的确认选项。 很多交易者在Super Trend MT4指标的帮助下,在第一个交易周内改善了交易结果。 优点
不重新绘制仪表板箭头 仅适用于台式机MT5 适合剥头皮 适合波段交易 仪表板箭头输入警报 仪表板箭头信号严格警告“蜡烛图收盘关闭” 移动警报、桌面警报、电子邮件警报 显示任意时间段的箭头 适用于任何Mt4货币对 适合新手和专家交易员 设置 Period: 周期 Multiplier: 倍增器 Show Trend Line : 显示趋势线 Show Arrow: 显示箭头 关于我们 欲了解更多我们产品信息,请 点击这里
FREE

거래 정확도를 높여보세요 WH 트레이딩 세션 MT4 MetaTrader 4를 위한 지표! 이 강력한 도구는 주요 시장 세션을 손쉽게 시각화하고 관리하는 데 도움이 됩니다. 기반 : WH SMC Indicator MT4
MT5 버전 : WH 트레이딩 세션 MT5 주요 특징: 대화형 GUI 패널 – 쉽게 선택하고 전환하세요 아시아, 런던, 뉴욕 거래 세션.
사용자 정의 가능한 알림 및 설정 – 직관적인 인터페이스를 통해 전략에 맞게 지표를 조정하세요. 옵션 탭 .
빠르고 반응성이 좋은 인터페이스 – 매끄러운 경험을 즐겨보세요 이동 가능하고 최소화 가능하며 최대화 가능한 패널입니다 .
자동 GMT 오프셋 처리 – 수동 조정이 필요 없습니다. 세션은 항상 시장 시간에 맞춰 조정됩니다.
Trading Session을 통해 시장 활동을 앞서가고 거래
FREE

인디케이터는 차트의 라운드 레벨을 보여줍니다. 심리적, 뱅킹 또는 주요 플레이어 레벨이라고도 합니다. 이 수준에서 황소와 곰 사이에 실제 싸움이 있고 많은 주문이 누적되어 변동성이 증가합니다. 표시기는 모든 악기와 기간에 따라 자동으로 조정됩니다. 80레벨을 돌파하고 테스트를 하면 구매합니다. 20레벨 돌파 후 테스트 하면 판매합니다. 목표는 00입니다. 주목. 강력한 지원 및 저항 수준으로 인해 가격이 00 수준을 약간 놓칠 수 있습니다.
입력 매개변수.
Bars Count - 라인 길이. Show 00 Levels - 00 레벨을 표시하거나 표시하지 않음. Show 10, 90 Levels. Show 20, 80 Levels. Show 30, 70 Levels. Show 40, 60 Levels. Show 50 Levels. N Lines - 차트의 레벨 수를 제한하는 매개변수. Distance 00 Levels - 레벨 사이의 거리(자동 또는 수동). Line Positi
FREE

Background : Forex swing trading is a short-to-medium-term strategy aiming to profit from price "swings" (short uptrends/downtrends) within larger market moves.
This is a simple system that trades the rejection of a previous swing high/low . The system is non repaint and easy to use.Please use with discretion , it gives a decent accuracy and would definitely improve your trades. You can use on any pair and timeframe
FREE

" ZigZag on Trend " 지표는 가격 움직임 방향을 파악하는 데 도움이 되는 지표이며, 막대 및 핍 계산기 기능도 제공합니다. 이 지표는 추세 지표, 가격 방향을 추적하는 지그재그로 표현된 추세선, 그리고 추세 방향으로 지나가는 막대 수와 수직선의 핍 수를 계산하는 카운터로 구성됩니다(계산은 막대의 시작점을 기준으로 합니다). 이 지표는 다시 채색되지 않습니다. 편의상 색상이 있는 막대 또는 선으로 표시됩니다. 모든 시간대에서 사용할 수 있지만, M5 이상에서 사용하는 것이 가장 좋습니다.
" Period "은 가격 방향을 검색할 막대 수를 결정합니다. 한 방향으로 완만한 추세를 얻기 위해 방향의 길이를 계산합니다.
" Diapason "는 추세 방향의 빈도를 조정하며, 주로 다양한 거래 상품의 첫 번째 매개변수를 조정합니다(EURUSD의 경우 최대 10개, GOLD의 경우 최대 100개).
핍 카운터는 모든 시간대 및 거래 상품에 대한 조정을 지원합니다.
주요 지표
The Swing High Low Indicator is an essential tool for traders who rely on price action. It automatically marks key reversal points (swing highs in red, swing lows in green), helping you visualize trends, spot breakouts, and draw precise trendlines. By highlighting these critical levels, the indicator reveals market structure shifts—whether the trend is strengthening, reversing, or entering consolidation. Perfect for all timeframes and strategies, it turns raw price data into actionable tradi
FREE

Gann Box 지표는 트레이더가 시장의 핵심 수준을 식별하고 활용할 수 있도록 설계된 강력하고 다재다능한 도구입니다. 이 지표는 차트에 직사각형을 그릴 수 있게 해주며, 자동으로 전략적 수준인 0, 0.25, 0.50, 0.75, 1 로 여러 영역으로 나뉩니다. 가격이 이 중 하나의 수준에 도달하면 경고가 활성화되어 거래 결정을 내리는 데 귀중한 도움을 제공합니다. 그리신 영역에 대한 시장의 변화를 즉시 알 수 있습니다. 영역을 그리려면 간단한 직사각형을 그리고 이름을 GannBox 로 바꾸기만 하면 됩니다. 이 지표는 지지 및 저항 , 공급 및 수요 개념을 사용하는 트레이더, ICT 기술을 사용하는 트레이더, 또는 공정 가치 갭 (FVG) 전문가 등 모든 유형의 트레이더를 위해 설계되었습니다. 일일 거래자, 스윙 거래자 또는 포지션 거래자이든, Gann Box 는 시장의 움직임을 더 잘 이해하고 예측하는 데 도움을 주어 반응성과 성과를 향상시킵니다. MT5 버전
Gann Box

Indicator Description: DISH X Imbalance (DIDTA/DIDFA) 1. Overview The DISH X Imbalance indicator is a sophisticated volume-based technical analysis tool for MetaTrader 4 that analyzes market order flow imbalance to identify potential trend reversals and fair value deviations. The indicator calculates two core values: DIDTA (Daily Imbalance Delta) and DIDFA (Daily Imbalance Delta Fair Value) , providing traders with insights into buying/selling pressure and market valuation. 2. Core Com
FREE

평균 일일 범위는 특정 기간 동안 측정된 Forex 쌍의 평균 핍 범위를 보여줍니다. 거래자는 ADR을 사용하여 평균 일일 이동을 벗어난 잠재적인 가격 조치를 시각화할 수 있습니다. ADR이 평균보다 높으면 일일 변동성이 평소보다 높다는 것을 의미하며, 이는 통화 쌍이 정상 이상으로 확장될 수 있음을 의미합니다.
ADR Analyzer는 5가지 주요 기능으로 구성됩니다. 범위(ADR) 스크리너: 다중 통화 ADR 분석. ADR 구역: ADR 구역 외의 가격 붐이 일 동안 예상되는 시장 범위를 보여줍니다. X막대 Zone : 사용자가 지정한 X막대, X막대의 틈을 보여줍니다. 일간 고저존 : 전일 고점 또는 저점의 구간을 식별합니다. Weekly High and Low Zone : 주간 High 레벨 또는 Low 레벨을 식별합니다. 기간 한정 제공: 범위 분석기 표시기는 50$ 및 평생 동안만 사용할 수 있습니다. ( 원래 가격 125$ )
주요 특징들 다중 통화 스크리너. AD

Galaxy Force Analyzer - is an intelligent indicator for analyzing market volume and strength. It combines data from indicators like Force, OBV, MFI, AD, and others with advanced algorithms for acceleration and filtering to show the energy of price movement — the moment when a trend gains strength or begins to weaken. The indicator doesn’t just display volume — it measures impulse power, acceleration, and the speed of pressure changes between buyers and sellers.
Signals: Everything on the chart
FREE

For some trader's charts analysis use, specially for multi timeframe trading strategies . When you need to check something of the time within different timeframe at the same symbol chart, even different symbol charts, this indicator will show the crosshair at sync moving. You just need to load this indicator into some charts, then the crosshair will shown automatic.
FREE

Is This tools use able for free in Forex market ?
Accuracy Meter is useful and also free product, i made this product for free because i believe that any seller must have some good products for free not just release bad products as free tools.
What does Green koala logo mean :
Means Free Products , i ll release my free products by green koala logo, so when you see green koala, it means new free products is access able for you.
Accuracy Meter Introduction :
Accuracy Meter is powerful tool to
FREE
Overview
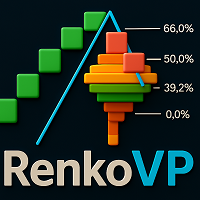
RenkoVP is a professional tool for price structure analysis that runs fully online on the main chart. Unlike many other Renko indicators, it requires no offline charts. The indicator combines Renko bricks, volume profile, dynamic Fibonacci levels, and automatic pattern recognition to help traders identify trends, key zones, and precise entry/exit points. Renko Bricks Configuration
The indicator offers both manual and automatic brick configuration: No offline chart required - runs direc
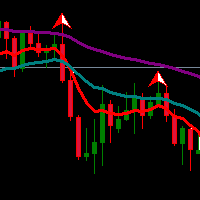
Exponential Moving Average (EMA) is an indicator that often be used by traders. Combination of two or three EMA indicators often applied to determine trend direction. Multiple EMA combined with fractals or oscillator indicator to detect overbought/oversold and divergence point also great to do in trading system.
If you like EMA indicator and want to get better indicator, highly recommended using EMA SuperTrend Strategy Indicator if you want to get better result in here:
https://www.mql5.com/en
FREE

Overview Happy Cub Junior is a multi-timeframe and multi-indicator analytical dashboard, it consolidates data from 10 different technical indicators across 8 timeframes into a single, color-coded table. Its primary purpose is to help traders identify "confluence" - the rare moment when multiple indicators and timeframes align in the same direction. Paid version in Happy Cub " https://www.mql5.com/en/market/product/165154 " will have Bear & Bull Index instead of K-Bars (Close price vs Open price)
FREE

This indicator identifies swing highs and swing lows in the price chart by comparing the Highs and lows of each candle to a specified number of candle before and after it. Once it has identified the swing highs and swing lows, it can use them to determine potential support and resistance levels. A support level is formed when the price drops and bounces back up from a swing low, indicating that there is buying pressure at that level. A resistance level is formed when the price rises and reve
FREE
추세 상관 강도 (TCS) 지표: 외환 추세 분석의 우위 추세 상관 강도 (TCS) 지표 는 추세 강도를 측정하는 방식을 재정의하는 최첨단 도구로, 평균 방향 지수(ADX)와 같은 기존 지표에 비해 상당한 이점을 제공합니다. 방향성 움직임에 의존하는 ADX와 달리, TCS는 종가와 선형 시계열 간의 상관 관계 를 계산하여 추세 강도를 독특하게 정량화합니다. 이 혁신적인 접근 방식은 외환 트레이더에게 강력한 추세를 식별하고 활용하기 위한 매우 정밀한 방법을 제공합니다. TCS를 선택하는 이유? 추세를 일찍 포착하고 핍을 극대화하세요: TCS는 단순히 반응하는 것이 아니라 예측합니다. 시간이 지남에 따라 가격이 얼마나 선형적으로 움직이는지 측정하여 놀라운 정확도로 새로운 추세를 식별하는 데 도움이 됩니다. 주간 차트에서 TCS 값이 45 이상으로 상승하는 것 은 중요한 시장 움직임이 진행 중이라는 강력한 신호입니다. 기존 전략에 TCS를 통합하여 더 일찍 거래에 진입하고 더 많은 핍을
FREE

The Pioneer Of Trend Detection! A Powerful Indicator That Avoids Whipsaws And Uncertain Market Noise. Functions mainly as a filter to help you trade in the direction of the trend. It works in any pair or timeframe.
Features Advanced trend detection software using complex algorithms that can be used as the supporting tool or system. Unique trend detection that avoids whipsaws and uncertain market noise Analyzes statistics of maximum profits and calculates possible targets for the next signal Fle
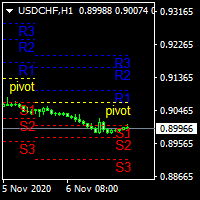
.................................if you need pivot point s levels............................... ............................this is a daily pivot point level creator........................... ...it is for daily pivots and show levels at times period H4 , H1 , M30 , M15 ,M 5... .................................also shows levels for 3 last days.............................. ................can use it with other indicators and see important levels...............
FREE

This indicator represents a genuine momentum oscillator according to the true definition of "Momentum", and as realised by the techniques of digital filtering. ( Note : download a complete set of true momentum oscillators here ). A scholarly paper on the subject by the current developer can be found here , but in this description we shall borrow only the minimum of conceptual and mathematical framework needed. In the process, we expose some long-held myths about indicators supposedly measurin
FREE

It is a custom non-repaint indicator to identify trade opportunities in swing action as prices move within an upper and lower band. Inspired by the Keltner Channel, the most popular channel Indicator introduced by Chester Keltner. It is different with a Bollinger Bands. It represents volatility using the high and low prices, while Bollinger's studies rely on the standard deviation. The algorithm for this indicator is also available in the EntryMaximator EA. Including the option to use it or not.
FREE

ECM Elite Channel is a volatility-based indicator, developed with a specific time algorithm, which consists of finding possible corrections in the market.
This indicator shows two outer lines, an inner line (retracement line) and an arrow sign, where the channel theory is to help identify overbought and oversold conditions in the market.
The market price will generally fall between the boundaries of the channel. If prices touch or move outside the channel, it's a trading opportunity.
The ind

Elliott Wave Trend was designed for the scientific wave counting. This tool focuses to get rid of the vagueness of the classic Elliott Wave Counting using the guideline from the template and pattern approach. In doing so, firstly Elliott Wave Trend offers the template for your wave counting. Secondly, it offers Wave Structural Score to assist to identify accurate wave formation. It offers both impulse wave Structural Score and corrective wave Structure Score. Structural Score is the rating to sh

With this indicator you'll have a general reading of the market's range using Gann's calculating modes. Gann's swing is used to have a quick reading to the market latest movements at first glance. The foundation of this swing calculation is in the count of candles in relation to the break-up and break-down of the price. When the price breaks-up the last maximum, the swing will get traced if a certain number of candles is exceeded from the last minimum. It can be used a "pure Gann" or not: If set

The indicator displays peak levels of activity formed by the maximum volume, tracks the correlation of the candles on all timeframes (from the highest to the lowest one). Each volume level is a kind of key trading activity. The most important cluster is inside a month, week, day, hour, etc.
Indicator operation features A volume level receives Demand status if the nearest volume level located to the left and above has been broken upwards. A volume level receives Supply status if the nearest volu

FutureForecast is one of the few indicators looking into the future, or rather calculating the current candle's High and Low price values.
Advantages of the indicator no repainting works on any timeframes works with any trading instruments perfectly suitable for scalping and trading binary options
Parameters alert - enable/disable alerts about signals. Enabled by default.
Parameters (Colors) FutureHigh - estimated High price line color. FutureLow - estimated Low price line color.
Recommendat
TW Trend Sniper: 최고의 트렌드 전략
TW Trend Sniper 지표는 고급 기술 분석 기술의 지능적 조합을 활용하여 시장 동향을 정확하게 파악하고 수익성 있는 거래를 위한 적시 신호를 수신하는 데 도움이 됩니다. Trade Wizards의 독점적인 공식과 가격 액션 분석, 피보나치 수준 및 기타 기술 분석 도구는 정확하고 신뢰할 수 있는 거래 신호를 제공합니다. 이 지표는 전문 트레이더와 숙련된 프로그래머의 협력적 노력의 결과로, 트레이더에게 강력하고 효율적인 도구를 제공하도록 설계되었습니다.
금융 시장의 진입 및 종료 시점을 정확하게 예측하고 식별할 수 있는 강력한 도구를 찾고 계십니까? "TW Trend Sniper" 제품은 최첨단 기술과 인공지능 알고리즘을 활용하여 정확하고 신뢰할 수 있는 거래 신호를 제공합니다.
금융 시장에서 기술 분석과 수익 창출을 위한 전문적이고 강력한 도구를 찾고 있다면 이 제품이 당신에게 가장 좋은 선택입니다. 이 제품을 사용하

The Turtle Trading Indicator implements the original Dennis Richards and Bill Eckhart trading system, commonly known as The Turtle Trader. This trend following system relies on breakouts of historical highs and lows to take and close trades: it is the complete opposite to the "buy low and sell high" approach. The main rule is "Trade an N-day breakout and take profits when an M-day high or low is breached (N must me above M)". [ Installation Guide | Update Guide | Troubleshooting | FAQ | All Prod
FREE

Please check the " What's new " tab regularly for a complete and up-to-date list of all improvements + parameters. FREE indicator for my trading utility Take a Break . This indicator allows you to manage multiple other EAs with just one Take a Break EA instance. Simply specify the corresponding Chart Group in the indicator(s) and Take a Break EA settings and you are good to go.
Setup examples (Indicator + EA)
As a prerequisite, add the URL https:// trading.custom-solutions.it to the list of a
FREE

WaPreviousCandleLevels MT4 shows the previous candle levels, it shows the previous candle Open High Low Close levels (OHLC Levels) in different time frame. It's designed to help the trader to analyse the market and pay attention to the previous candle levels in different time frame. We all know that the OHLC Levels in Monthly, Weekly and Daily are really strong and must of the time, the price strongly reacts at those levels. In the technical analysis, the user can use them as a support and res
FREE

Exclusive Arrival: Presenting for the First Time . This is your secret weapon for predicting which way the wind will blow with the next market shift. It assists you in developing your trading strategy by predicting the direction of the next candle. Compatible with forex, stocks, and cryptocurrencies on all timeframes, but higher timeframes are recommended. MT5 Version - https://www.mql5.com/en/market/product/108937/ How does it work ? It's pretty neat. The algorithm separates green and red can

차트의 시각적 측면을 향상시킬 뿐만 아니라 활기차고 역동적인 특성을 부여하는 지표를 소개합니다. 이 인디케이터는 하나 이상의 이동평균(MA) 인디케이터를 조합한 것으로, 지속적으로 색상이 변하면서 흥미롭고 다채로운 모습을 연출합니다.
이 제품은 그래픽 솔루션이므로 텍스트에서 수행하는 작업을 설명하기가 어렵고 제품이 무료 일뿐만 아니라 다운로드하면 더 쉽게 볼 수 있습니다. 이 인디케이터는 비디오 편집을 위해 차트의 아름다운 그림을 만들고 싶은 블로거 또는 차트를 생동감 있고 화려하게 만들고 싶은 트레이더에게 적합합니다.
MA 선의 색상 팔레트는 무지개처럼 변경되거나 무작위로 변경됩니다(설정된 매개 변수에 따라 다름). MA 지표는 "MA 기간" 매개변수의 단계를 유지하여 독립적으로 정렬되므로 아름다운 그림을 만들 수 있습니다.
이 표시기는 또한 MA 기간을 지속적으로 변경할 수 있으므로 차트에 생동감과 역동성의 효과를 만들 수 있습니다.
관심을 가져주셔서 감사합니다. 좋은
FREE

The Netsrac Supply&Demand Dashboard shows you at a glance where relevant zones are located on your favorite assets. Open your chart directly from the dashboard and trade zones that really matter. Features
Finds the next relevant supply and demand zone and displays the distance to this zone (in pips) Finds and displays the zones in three different timeframes Calculates a trend indicator for the current and past candle for each configured time frame Opens a chart with your chart template directly
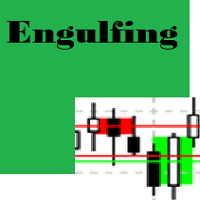
Engulfing Candle Detector
Detectable pattern Double Candlestick Patterns Bullish Engulfing
The first candle is black candle. The second candle opens with a gap below the real body of the black candle but rallies upwards to close above the real body of the black candle. In other words, the second candle's real body completely engulfs the first candle's real body Bearish Engulfing
The first candle is white candle. The second candle opens with a gap above the real body of the white candle but dec
FREE

Attention! Friends, since there have been many scammers on the Internet recently selling indicators called ForexGump, we decided to warn you that only on our page is the LICENSE AUTHOR'S VERSION of the INDICATOR sold! We do not sell this indicator on other sites at a price lower than this! All indicators are sold cheaper - fakes! And even more often sold demo versions that stop working in a week! Therefore, in order not to risk your money, buy this indicator only on this site!
Forex Gump Pro is

H4 & M30 Turning Point PRO로 트렌드 기반 거래 극대화! 추측과 복잡한 차트는 이제 그만. 이 프리미엄 지표는 상위 시간대 트렌드 감지와 정밀한 단기 전환점 신호를 결합하여 명확한 매수 및 매도 기회를 제공합니다. 트레이더들이 사랑하는 이유: H4 EMA200 트렌드 바이어스: 우세한 트렌드를 한눈에 파악. 트렌드 방향으로만 거래. M30 실행 화살표: 트렌드, 구조, 변동성으로 확인된 고확률 전환점을 기다리세요. 스마트 라벨: 매수(BUY) 또는 매도(SELL) 화살표를 언제 예상해야 하는지 항상 확인 – 혼란과 신호 누락 없음. 선택적 알림: 팝업, 푸시 알림, 이메일은 설정당 한 번만 발생하여 알림 과부하 방지. 커스터마이징 가능한 라인 및 시각화: H4 & M30 EMA 라인 표시/숨김 가능, 전문적인 차트 레이아웃을 위한 깔끔한 라벨. 스윙 + ATR 필터: 강력한 시장 구조만 신호를 트리거 – 자신감 있는 거래! 적합 대상: 트렌드 기반 진입을 원하는

Pairs Trading Z-Score Optimized is a custom indicator for the MetaTrader 4 (MT4) platform, designed to support pairs trading by analyzing the spread between two currency pairs using Z-Score calculations and stationarity testing. It operates on a single pair (the chart’s symbol and a user-defined second symbol) and displays Z-Score values, threshold bands, and trading signals in a subwindow, with optional arrows on the main chart. The indicator incorporates the Augmented Dickey-Fuller (ADF) test

The balance of supply and demand is a simple and effective market analysis method. The supply and demand diagram can show you in advance, even before the trend reversal, where the supply ends and the demand is already emerging, where the demand ends and the supply is emerging, while substantially increasing the probability of making a deal in the right direction and with a high profit factor.
Indicator Signals The indicator uses the price/volume values to generate signals: ED – excess demand. E

Spline Searcher MT5 — 가격 스플라인 및 관심 지점의 조기 탐지를 위한 다중 통화 지표 복잡한 가격 형성의 초기 단계를 자동으로 탐지하고 시각화하는 보조 도구입니다. 이 지표는 오직 수동 트레이딩을 위해 설계되었으며, 더 복잡한 시장 형상이나 트렌드(그 구성 요소로 단순한 형성이 포함될 수 있음)를 조기에 포착하려는 트레이더에게 적합합니다. 최대 6가지 유형의 초기 형상을 탐지합니다: 원격 캔들과 근접 캔들에 정점이 있는 포물선, 감쇠 조절이 가능한 조화 진동, 선형 파형 등입니다. 모든 형상은 정확도, 크기, 지속 시간, 견고성 기준에 따라 평가됩니다. 외관에 대한 유연한 사용자 정의와 고급 검색 로직이 제공됩니다. 추가 기능을 얻는 데 도움이 되는 링크 다음과 같은 목적이 있으신 경우: MetaTrader 5 용 지표 버전 질문하거나 지원받기 이 지표는 누구를 위한 것인가요? 흥미로운 시장 상황을 조기에 탐지하고 다양한 접근법을 시도하고자 하는 트레이더용입니다.
FREE
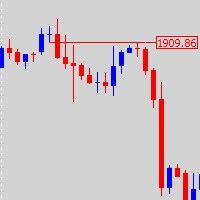
This is a combine that combines the ATR, Candle Timer, Watermark indicators and a tool for working with graphical objects, which allows you to reduce the time for marking charts. Functionality: Levels and proteins with price tags; drawing strictly horizontal levels; continuous zigzag manually; expansion / truncation of lines, wrinkles; quick change of colors and fonts and shapes; Filling/removing the filling of vessels, triangles, ellipses; dragging by 1 (first) point and auto alignment of the h
FREE

SENSE는 선택된 GANN 방식과 프랙탈 계산을 결합한 자동화된 시스템입니다. 이 시스템은 거래를 개시하고 청산할 위치를 알려줍니다. 더 이상 복잡한 계산에 시간을 낭비할 필요가 없습니다. SENSE가 모든 것을 알아서 해줍니다. 인디케이터를 설치하기만 하면 됩니다.
기본 원칙:
가격이 흰색 선 위에 있으면 시장은 강세입니다.
흰색 선 위에서 매수, 아래에서 손절 녹색 선은 상승 목표 가격이 흰색 선 아래에 있으면 시장은 약세입니다.
흰색 선 아래에서 매도, 그 위에 스톱 빨간색 선은 하락 목표 녹색 또는 빨간색 이중선은 강세 구간을 나타냅니다.
왜 센스인가?
수익 목표: SENSE는 자동으로 이익 실현 목표를 설정하여 트레이딩 성공을 극대화할 수 있도록 도와줍니다. 자동 적응: 인디케이터는 모든 차트주기에 대해 자동으로 다시 계산하여 수동으로 조정할 필요 없이 정확하고 신뢰할 수 있는 신호를 제공합니다.
스캘핑에도 좋습니다.
데모를 확인해 보세요!
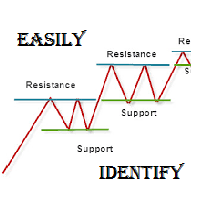
As per name Easily Identify, This Indicator is a affordable trading tool because with the help of Popular Developers & Support of M Q L Platform I have programmed this strategy. I tried to input 4 types and 3 periods of Calculation regarding Support Resistance, Furthermore, I have also care about Trend lines that Trader can easily get in touch with market in another way also. What is in for Trader?
Trading Modes: This selection is for activate whole strategy "Easily Identify" Support_R
FREE

표시기는 모든 기간의 모든 기호에 대해 최소화된 차트를 표시합니다. 표시되는 차트의 최대 수는 28개입니다. 차트는 기본 창과 하단 창에서 모두 찾을 수 있습니다. 두 가지 표시 모드: 양초와 막대. 표시되는 데이터의 양(막대 및 캔들)과 차트 크기는 조정 가능합니다. 매개변수: Corner - 시작 코너 표시(목록에서 선택) CandleMode - 디스플레이 모드: true - 양초, false - 막대 ShowLastBid - 마지막 가격 표시 활성화/비활성화 LastBidShiftX - X 축에 의한 마지막 가격 라인 이동(모든 이동은 보다 정확한 표시를 위해 사용됨) LastBidShiftY - Y 축에 의한 마지막 가격 라인 이동 ColorLB - 마지막 가격 라인 색상 BarsToDisplay - 현재 막대 없이 표시되는 막대/촛불의 양 LineColor - 선 색상(Doji 양초) BullColor - 강세 막대/촛불 색상 BearColor - 약세 막대/촛불 색상 Sc
FREE

Flow Trend Flow trend is designed to detect the market trend with special calculation and a combination of Bolinger band and statistical moving period
to detect the market trend without frequency change and fault.
This indicator is designed with simple parameters to use fast and easy and helpful tools to trade in a pure direction and set your SL/TP with this indicator cloud system.
FREE

"The Game is Decided Right Here" – Oni Strength Pro v30.08 This is the upgraded/advanced version. https://www.mql5.com/en/market/product/164789 【The Innovation of Three "NO"s】 NO SEARCHING : The system automatically selects "profit-ready" pairs from 28 different instruments. All you have to do is choose from the list. NO HESITATION : [BUY] or [SELL] signals appear only when all technical grounds align perfectly. It turns your mindset into steel. NO LIES : Zero repainting. Once a signal is
MetaTrader 마켓은 거래로봇과 기술지표를 판매하기에 최적의 장소입니다.
오직 어플리케이션만 개발하면 됩니다. 수백만 명의 MetaTrader 사용자에게 제품을 제공하기 위해 마켓에 제품을 게시하는 방법에 대해 설명해 드리겠습니다.
트레이딩 기회를 놓치고 있어요:
- 무료 트레이딩 앱
- 복사용 8,000 이상의 시그널
- 금융 시장 개척을 위한 경제 뉴스
등록
로그인
계정이 없으시면, 가입하십시오
MQL5.com 웹사이트에 로그인을 하기 위해 쿠키를 허용하십시오.
브라우저에서 필요한 설정을 활성화하시지 않으면, 로그인할 수 없습니다.