Volume Break Oscillator MT4
- 지표
- 버전: 1.0
- 활성화: 5

Volume Break Oscillator는 가격 움직임을 오실레이터 형태로 볼륨 추세와 일치시키는 지표입니다.
저는 볼륨 분석을 제 전략에 통합하고 싶었지만 OBV, Money Flow Index, A/D, Volume Weighted Macd 및 기타 여러 지표와 같은 대부분의 볼륨 지표에 항상 실망했습니다.
그래서 저는 이 지표를 직접 작성했고, 얼마나 유용한지 만족스러워서 시장에 공개하기로 결정했습니다.
주요 기능:
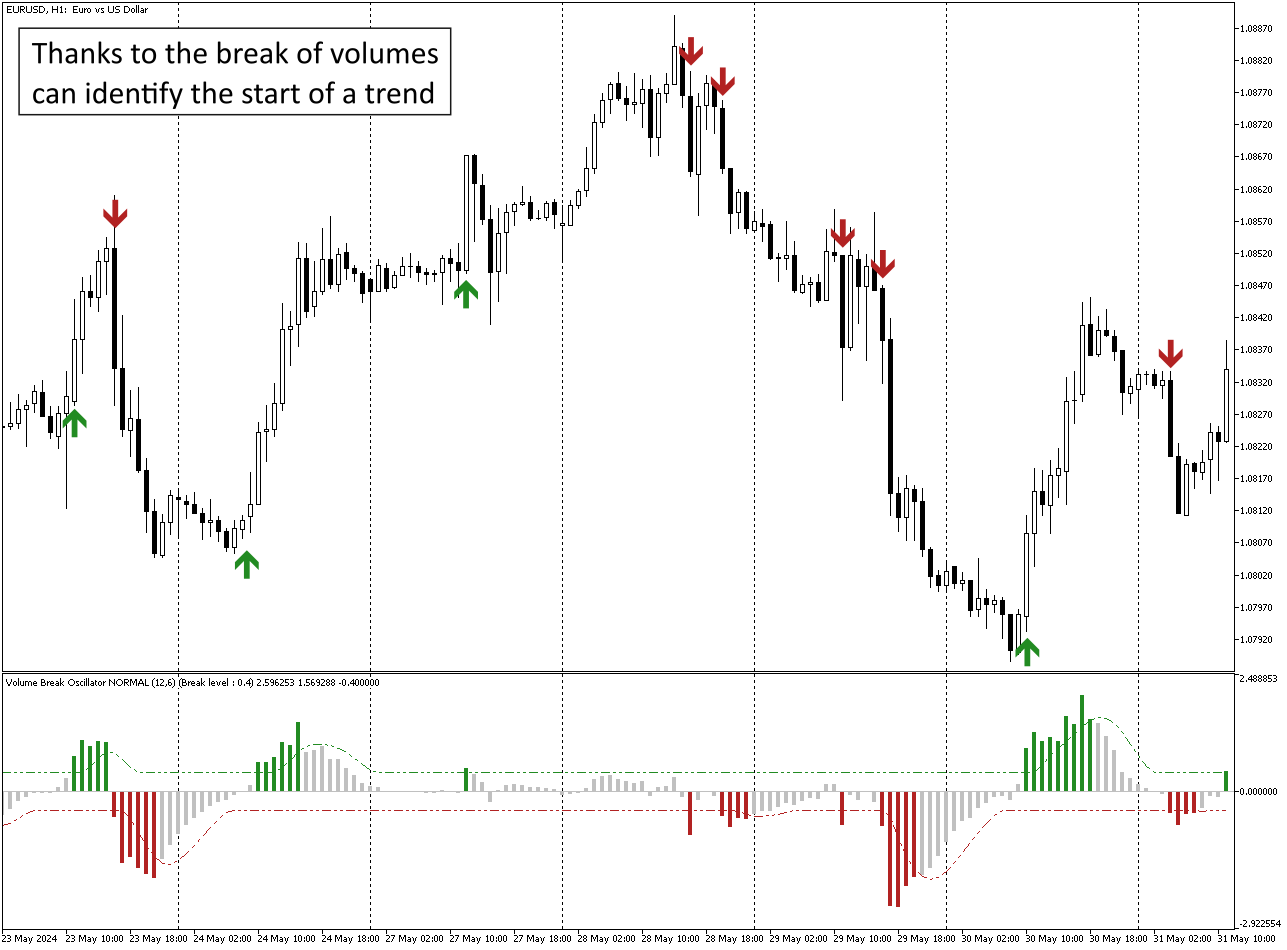
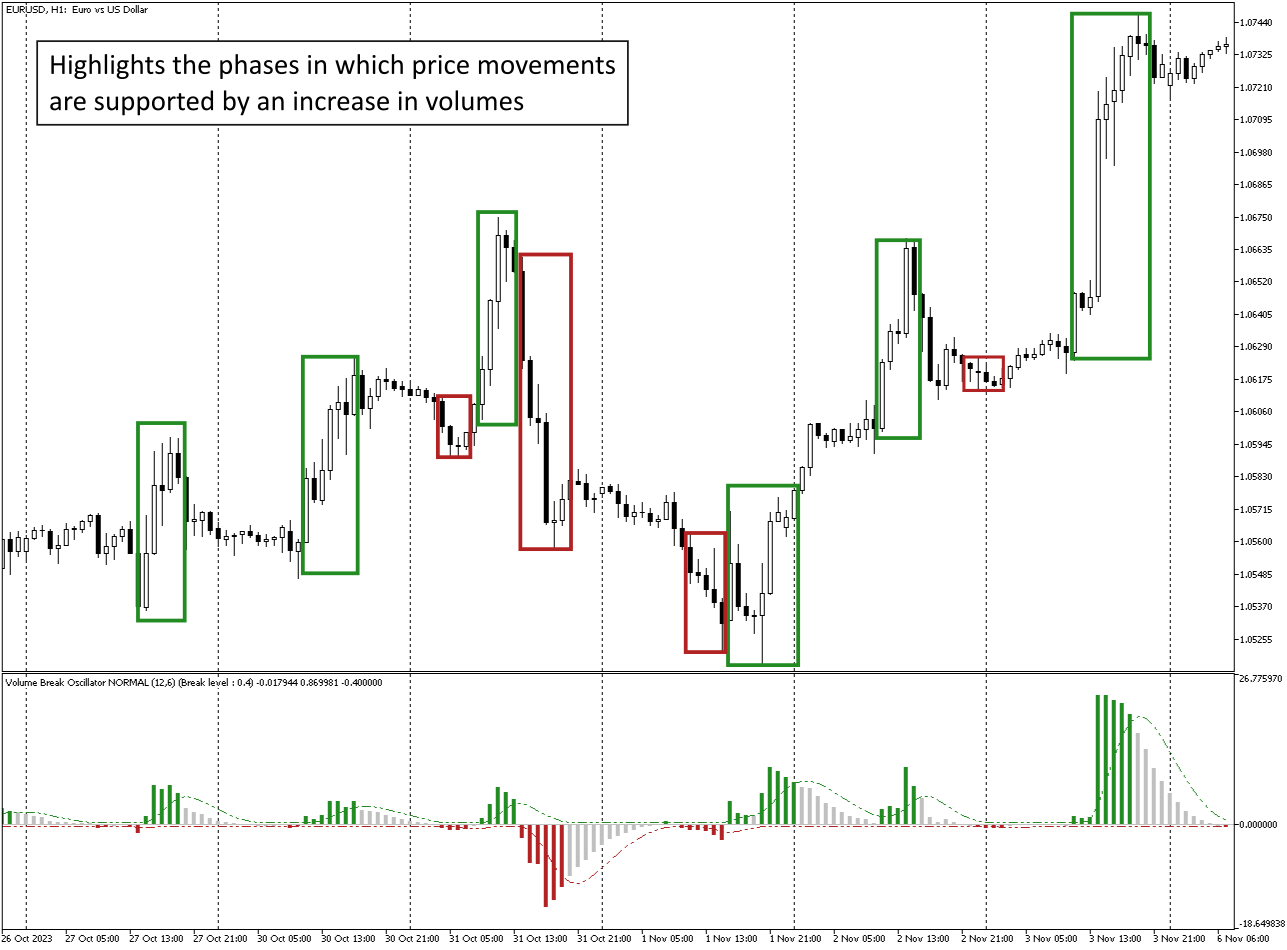
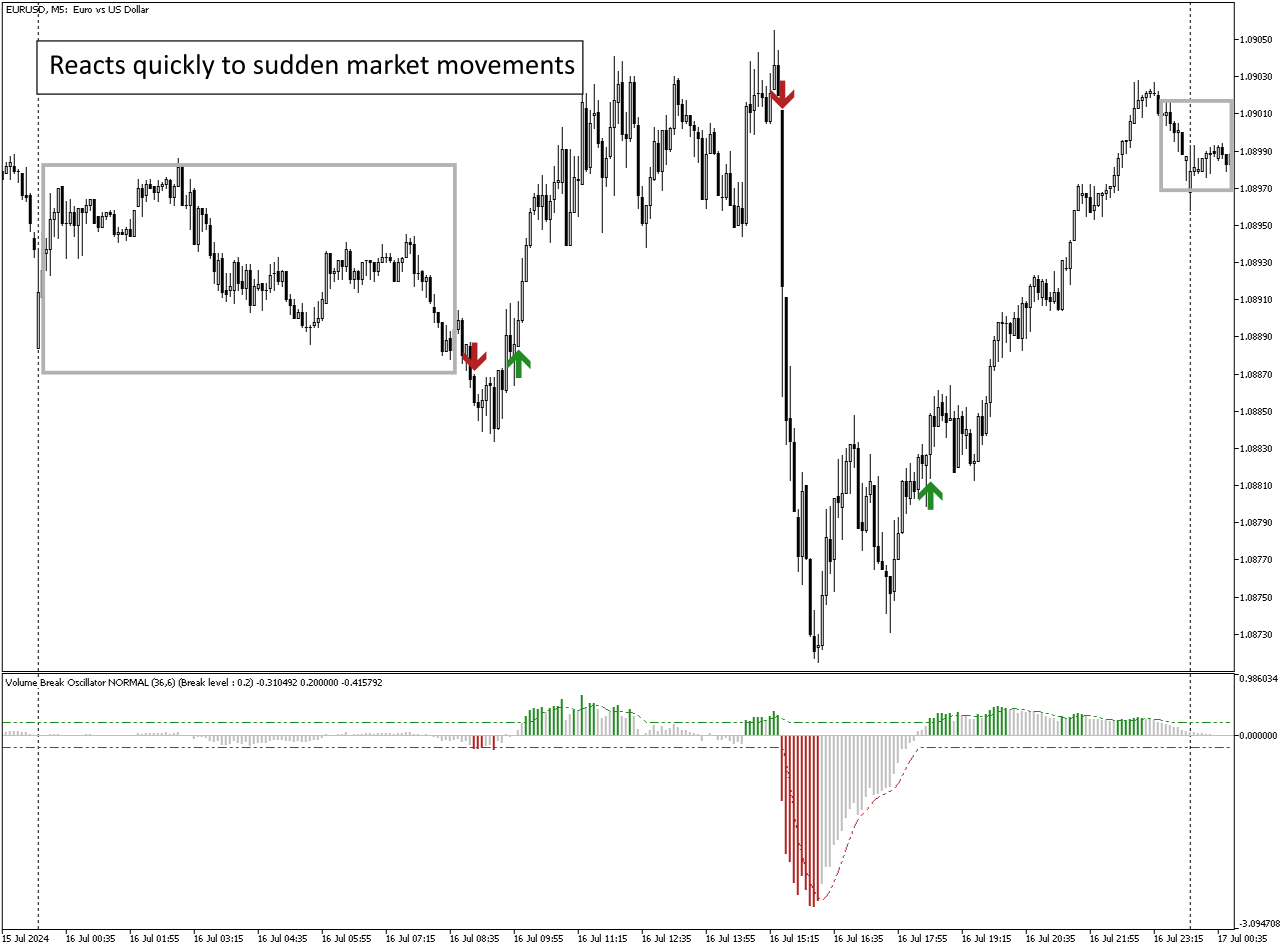
가격이 볼륨 증가(브레이크)로 지원되는 방향으로 움직이는 단계를 강조합니다.
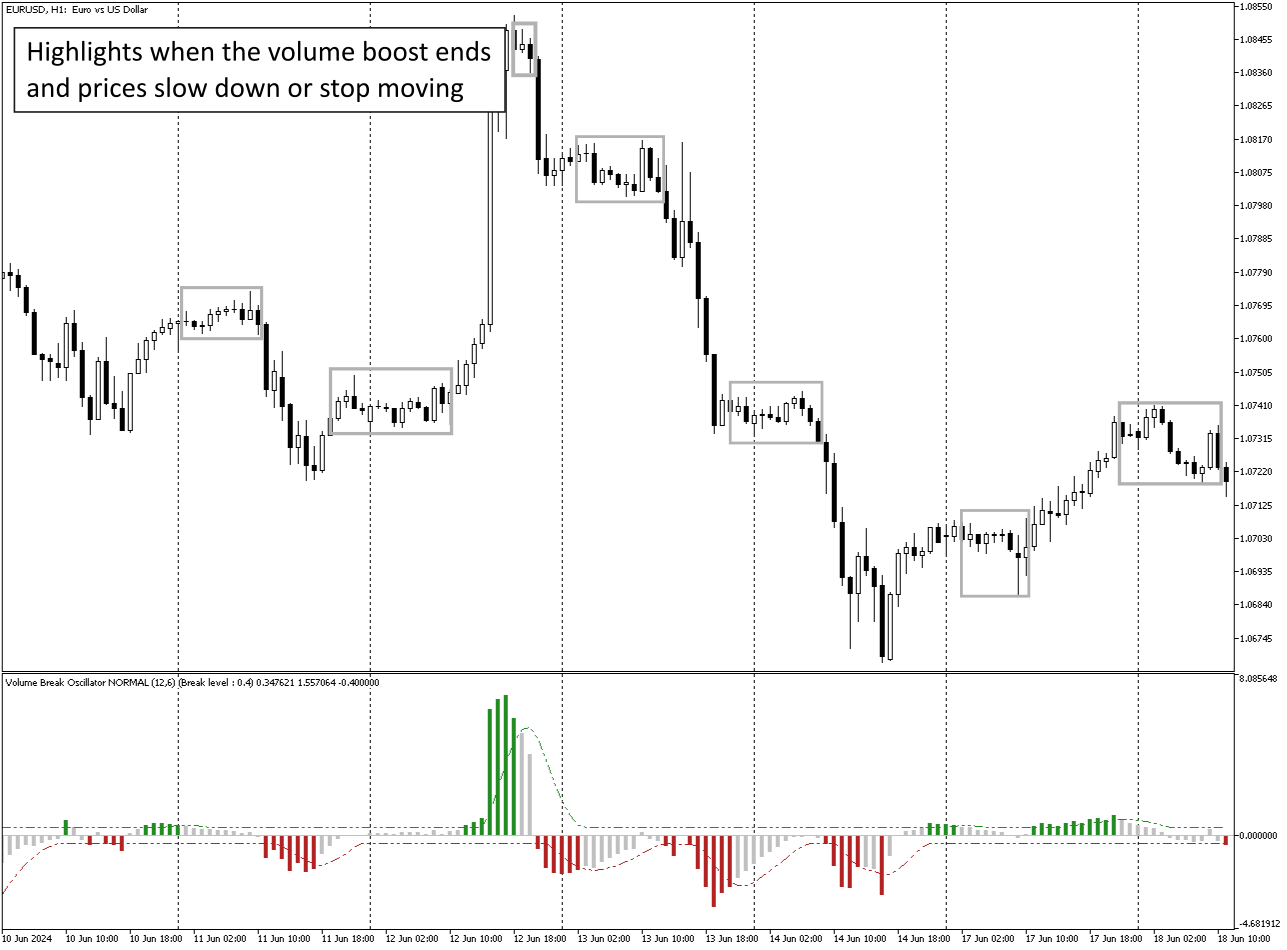
볼륨 증가가 멈추고 시장이 수축되는 단계를 강조합니다.
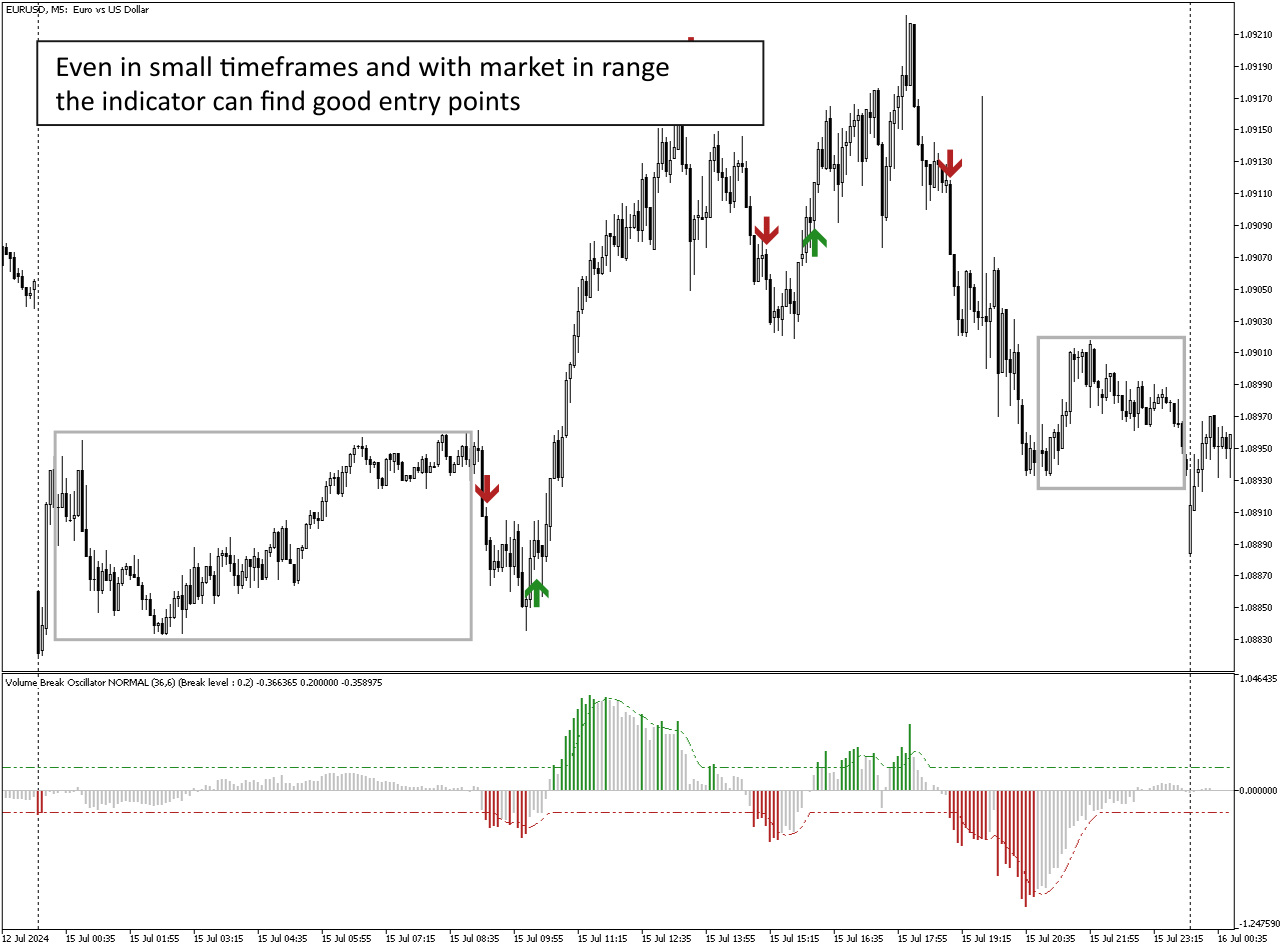
특히 시간 프레임(<=15분)이 있는 일중 거래에서 가격이나 볼륨이 움직이지 않아 시장이 향후 상승에 대비하는 단계를 강조합니다.
볼륨 증가로 지원되지 않는 다른 전문가 자문가의 거짓 신호를 걸러냅니다.
추세와 범위 단계를 시각화하는 것이 매우 쉽습니다.
입력 매개변수:
계산 설정:
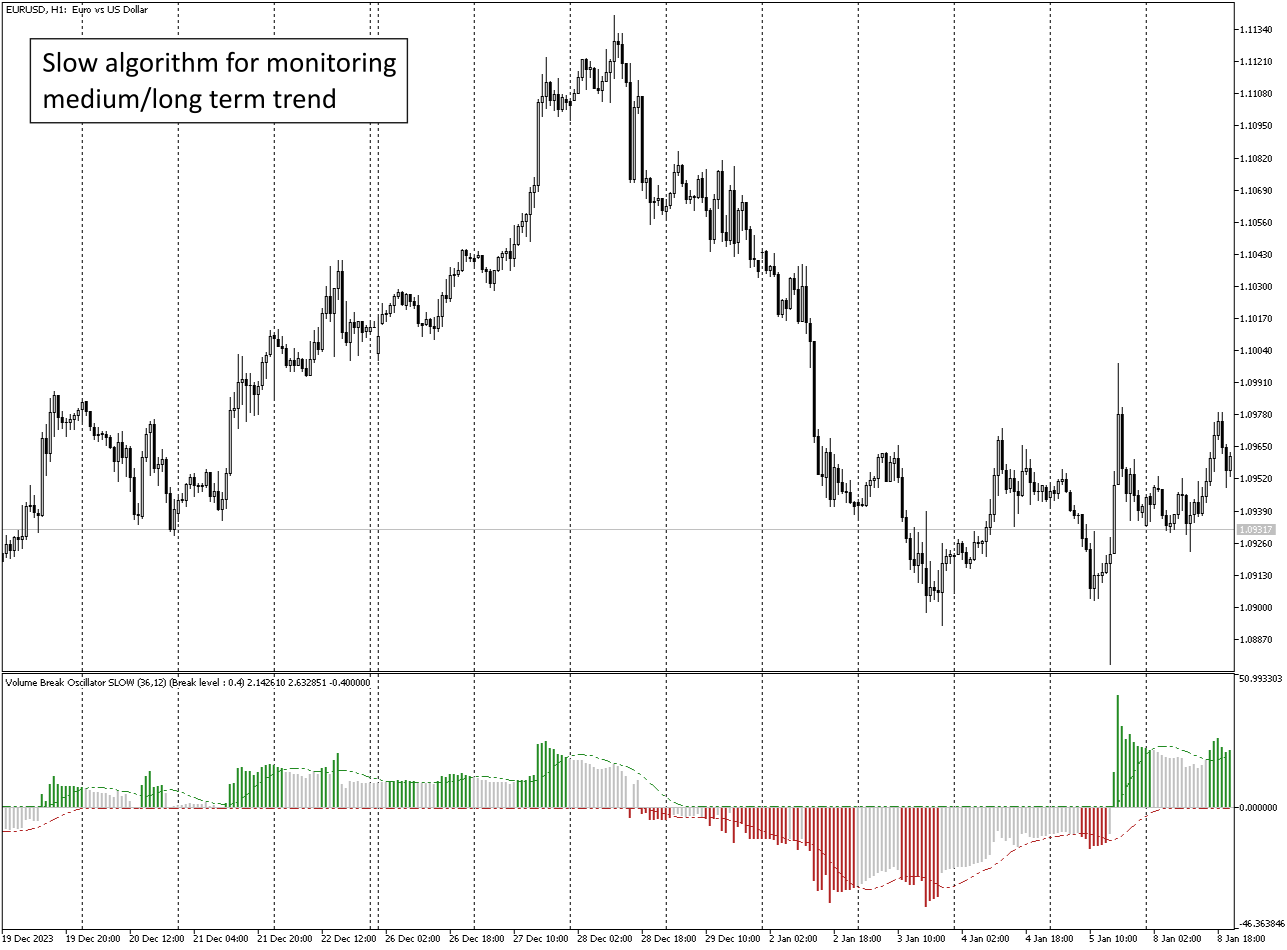
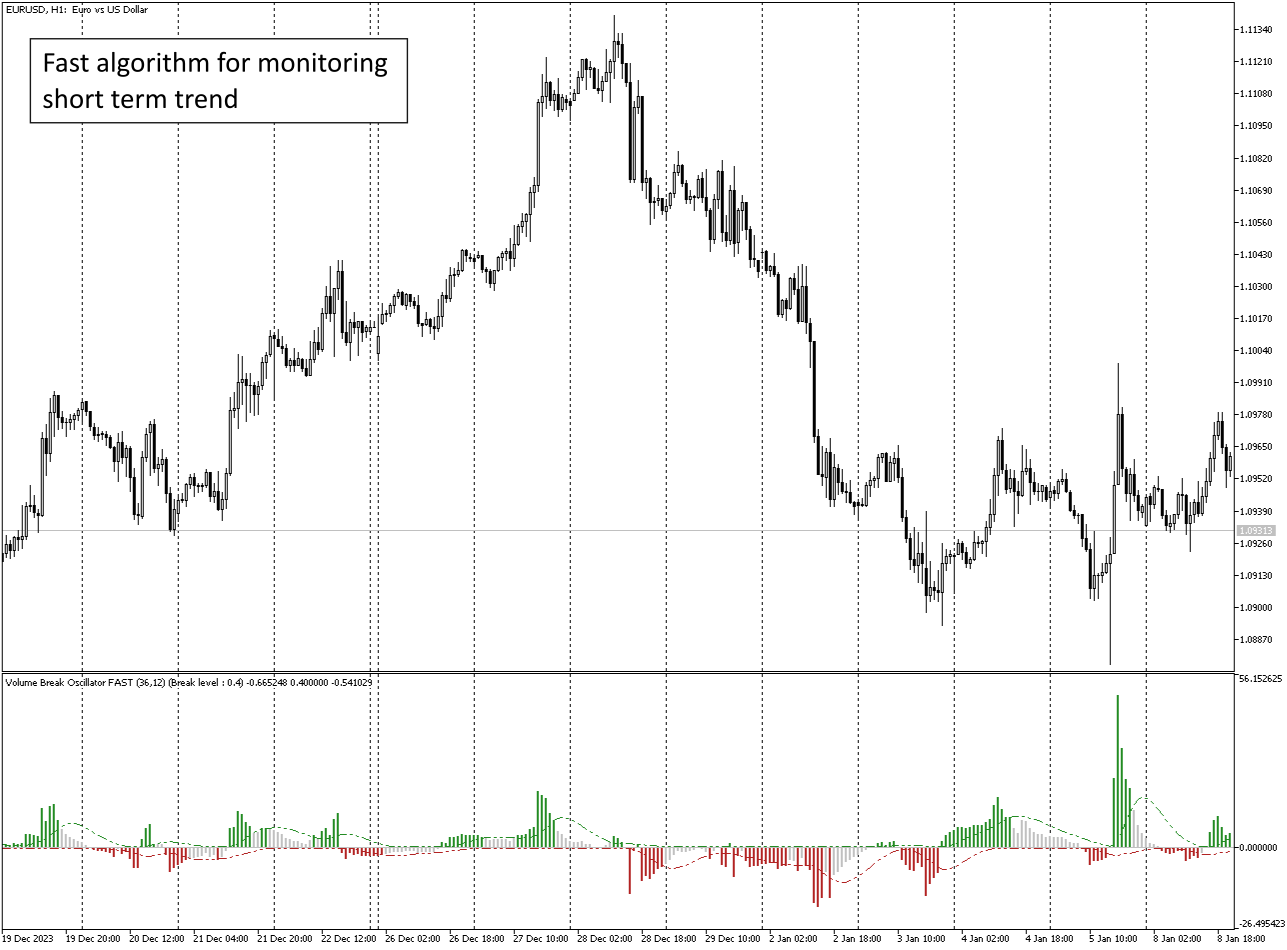
계산 유형: FAST, NORMAL, SLOW, 동일한 기간 내에 남아 단기, 중기 및 장기를 모니터링합니다.
계산 기간: 계산 기간
볼륨 설정:
볼륨 유형: 틱볼륨(주로 외환용) 및 실제볼륨(주식 시장용)
신호 설정:
신호 기간: 신호선 기간
브레이크 레벨: 브레이크아웃 신호에 대한 임계값
알림 설정
알림 유형: 마감 막대 또는 즉시
알림
메일
알림
알림 재설정: 볼륨 증가가 끝날 때(회색 막대) 또는 반대 신호에서
EA에서 호출할 버퍼 번호:
0 - 히스토그램
1 - 히스토그램 상승
2 - 히스토그램 하강
3 - 신호선 상승
4 - 신호선 하락
모두 즐거운 트레이딩 되세요!