MetaTrader 4용 기술 지표 - 11

스마트 트렌드 채널 지표 설명:
스마트 트렌드 채널 지표는 시장의 주요 트렌드를 시각적으로 식별하기 위해 차트에 동적으로 지원선과 저항선을 그려주는 강력하고 유연한 도구입니다. 고급 프랙탈 계산을 사용하여 지표는 시장의 변동에 따라 자동으로 트렌드 라인을 조정하고, 트레이더가 돌파구나 반전 포인트를 식별하는 데 도움을 줍니다. 주요 기능: 채널 표시 제어: 트렌드 채널을 표시하거나 숨길 수 있는 옵션이 있습니다. 동적 프랙탈 계산: 시간 프레임과 프랙탈 파라미터를 기준으로 자동으로 트렌드 라인이 조정됩니다. 명확한 트렌드 시각화: 상한선, 하한선, 중간선의 3개 라인으로 시장 트렌드를 명확히 나타내어 거래 결정을 돕습니다. 사용자 정의 가능한 라인 색상: 라인의 색상을 개별적으로 설정하여 중요한 시장 레벨을 강조하고, 시각적 명확성을 높일 수 있습니다. 다양한 시간 프레임 지원: 1분 차트부터 1개월 차트까지 다양한 시간 프레임에 자동으로 적응합니다. 장점: 강한 시장 트렌드와 반
FREE
"신호 히스토그램 스캘퍼" 표시기는 다시 그리거나 지연되지 않는 히스토그램 및 신호 형태의 일반 표시기입니다. "신호 히스토그램 스캘퍼" 표시기는 추세에 따른 최상의 진입점을 차트에 표시합니다. 다른 추세 지표와 함께 필터로 사용하는 것이 좋습니다. 이 지표는 M5 시간대에서 좋은 결과를 보여줍니다. 신호는 양초가 닫힌 후 생성되어 녹색과 빨간색 원 형태로 나타납니다. "신호 히스토그램 스캘퍼" 지표는 순수한 형태의 스캘핑과 필터를 사용한 일중 거래용으로 고안되었습니다. 스크린샷은 포지션의 진입점과 이탈점의 예를 보여줍니다. "신호 히스토그램 스캘퍼" 지표를 사용하여 거래할 때 지표 알고리즘에 고유한 스캘핑 전략이 포함되어 있으므로 항상 흑자 상태가 됩니다. "신호 히스토그램 스캘퍼" 표시기는 다시 그리거나 지연되지 않는 히스토그램 및 신호 형태의 일반 표시기입니다. "신호 히스토그램 스캘퍼" 표시기는 추세에 따른 최상의 진입점을 차트에 표시합니다. 다른 추세 지표와 함께 필터로 사
Double top and bottom indicator is a pattern scanning indicator which scans the tops and bottoms using zig zag pattern. When it find price bouncing back from the same point twice after a long trend then it generate arrow signals whenever the last resistance points is broken for double bottom and last support price broken for double top. Unlike other top bottom scanner it does not give only 1 signal. it alerts user when ever the last support /resistance is broker from double top/bottom pattern un
FREE

Background : Forex swing trading is a short-to-medium-term strategy aiming to profit from price "swings" (short uptrends/downtrends) within larger market moves.
This is a simple system that trades the rejection of a previous swing high/low . The system is non repaint and easy to use.Please use with discretion , it gives a decent accuracy and would definitely improve your trades. You can use on any pair and timeframe
FREE

Head and Shoulders Pattern Indicator - Your Key to Recognizing Trend Reversals Unlock the power of pattern recognition with the "Head and Shoulders Pattern Indicator." This cutting-edge tool, designed for MetaTrader, is your trusted ally in identifying one of the most powerful chart patterns in technical analysis. Whether you're a novice or an experienced trader, this indicator simplifies the process of spotting the Head and Shoulders pattern, allowing you to make informed trading decisions. Key
FREE
MT5 Version TTM Squeeze Momentum
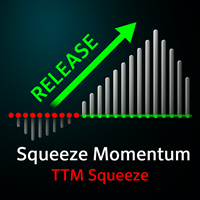
TTM Squeeze Momentum is an enhanced indicator ideal for recognizing consolidation periods in the market and the start of the next explosive move. This improved version is a volatility indicator based on John Carter's "TTM Squeeze" in which the histogram is based on a linear regression rather than a simple momentum indicator. Red dots on the middle line indicate that the market has entered a "Squeeze" zone or consolidation period, indicated in this enhanced versi

The Laguerre VIX Trend Extrema (LVTE) indicator detects market tops and bottoms. As its name suggests, LVTE is a percentage price oscillator that identifies extreme ranges in market price. How to use: Buy when the indicator was in the lower "blue" range for more than 2 candles, and then moves up into grey. Sell when the indicator was in the upper "red" range, and then moves down into orange. Please see screenshots for examples! To make it simple, the indicator can show this by paint

MarketSessions Indicator The Essential Tool for Global Market Session Visualization The MarketSessions indicator is a powerful MT4 tool designed to help traders visualize major forex market sessions directly on their charts. By clearly displaying the active trading hours of Sydney, Tokyo, London, and New York markets, this indicator helps you identify optimal trading periods and understand market volatility patterns. Key Features: Clear visualization of all four major trading sessions (Sydney, T
FREE
Key Features of the Indicator: Buy & Sell Signals: The indicator generates buy and sell signals based on specific conditions. It uses the crossover of the Fast Moving Average (Fast MA) and Slow Moving Average (Slow MA) to determine market entries. The RSI (Relative Strength Index) is used to identify buy signals when RSI is above 50 and below 75. It also considers support and resistance levels for additional confirmation of signals. Trend Filter: The market trend is identified using a Trend Movi
FREE

This indicator allows to analyze a chart using the rule of supple and demand. You will see zones of sales and purchases and determine the most profitable points to open positions. The indicator is based on the principle of market fractality. Chart zones show places where a strong buyer or seller has made the price reverse and change its direction. The indicator has several types of zones calculation. Color and type of zones displaying are set as desired. The zone width can be displayed in pips.
FREE
Minotaur Waves 는 잠재적인 전환점을 감지하고 가격 방향 전환을 높은 정확도로 확인하기 위해 설계된 고급 시장 분석 지표입니다. 이 시스템은 Minotaur Oscillator 의 강력함과 동적인 적응 밴드 구조를 결합하여 명확하고 신뢰할 수 있는 시각적 신호를 제공함으로써 신중한 진입 결정을 돕습니다. 모든 통화 쌍에서 사용 가능하며, 특히 EURUSD, GBPUSD, USDJPY 심볼에서 M1, M5, M15, M30 타임프레임에서 최적의 성능을 발휘합니다.
최신 소식과 가이드를 확인하세요: https://www.mql5.com/en/channels/forexnewadvisor
시스템 주요 구성 요소: 동적 밴드 시스템: 실시간 모멘텀 변화를 감지하고 주요 돌파 구간을 강조 표시 Minotaur Oscillator: 모멘텀 오실레이터로 히스토그램 형태의 극값을 표시하여 전환 구간을 확인 극값 검증: +33(상단) 또는 -33(하단)의 정확한 값으로 확인된 피크에서만

Tipu Heikin-Ashi Panel is the modified version of the original Heiken Ashi indicator published by MetaQuotes here . A professional version of this indicator is available here .
Features An easy to use Panel that shows the Heiken Ashi trend of selected timeframe. Customizable Buy/Sell alerts, push alerts, email alerts, or visual on-screen alerts. Customizable Panel. The panel can be moved to any place on the chart or minimized to allow more space. Heikin means "the average", and Ashi means "foot
FREE

AlphaTrend Pro - Enhanced Visual Trend Detection Indicator Product Title AlphaTrend Pro - Advanced Trend Detection with Crystal-Clear Visual Signals Brief Description AlphaTrend Pro is a sophisticated trend-following indicator that combines volatility analysis (ATR) with momentum oscillators (RSI/MFI) to create dynamic support and resistance levels. Enhanced with large directional arrows and smart visual positioning, this professional MT4 indicator provides unmistakable buy/sell signals that ada

핍스 헌터 프로는 수년에 걸쳐 개발되었으며 이전 버전보다 개선된 버전입니다. 이 강력한 지표는 시장과 가격 이력을 분석하여 매수 및 매도 항목을 생성합니다. 이러한 항목의 계산을 위해 함께 작동하는 다양한 지표와 덜 유리한 항목을 필터링하고 제거하는 복잡한 통계 로그를 사용합니다 / MT5 버전 .
특징 다시 칠하지 않음
이 인디케이터는 새 데이터가 도착해도 값이 변경되지 않습니다
지연 없음 이 표시기는 지연되지 않습니다 거래 쌍
모든 외환 쌍 (가급적 EURGBP)
타임프레임
모든 차트주기
매개변수 ===== 표시 =====
화살표 거리 // 신호(화살표)와 캔들스틱 사이의 거리
===== 알림 =====
팝업 알림 // MT4 터미널용 알림
푸시 알림 알림 // 휴대폰용 알림
이메일 알림 // 이메일 알림
===== 차트 설정 =====
차트에서 캔들 스틱의 색상을 변경하는 옵션
경고 저는 MQL5.com에서만 제품을 판매합니다. 누군가 내
FREE

INFOPad는 MetaTrader 4 터미널에서 선택한 통화 쌍에 대한 정보를 생성하는 정보 패널입니다. 이 표시기에는 5가지 기능이 있습니다. 선택한 기호에 대한 주요 및 주요 정보를 표시합니다. 매도호가 매수, 스프레드, 스탑 레벨, 스왑, 틱 값, 수수료 가격; SL 목표와 TP 목표의 미래 목표를 보여줍니다(설정된 손절매와 이익실현의 포인트 수, 달러 금액). 그것은 기간 동안 받은 이익을 보여줍니다: 오늘, 주, 월, 연도, 선택한 통화에 대한 총 이익; 현재 오픈 포지션, 로트(볼륨), 포지션 수, 포지션 이익(포인트, 달러, 퍼센트)을 보여줍니다. 미결 거래에 대한 차트에 대한 추가 정보를 표시합니다. 그것은 손절매 및 이익 수준 및 이러한 정지 수준의 목표를 보여줍니다. 심볼에서 트랜잭션이 열리거나 트랜잭션이 닫히거나 트랜잭션이 수정될 때 로그 파일에 정보를 기록합니다. 거래를 열 때, 거래를 닫을 때, 거래를 수정할 때 사운드 파일을 재생합니다. 거래 개시, 거래
FREE
The TPX Supply Demand indicator will alert you to detect supply and demand areas. With the risk/reward filter, you'll only receive alerts if they match your chosen configuration. With the first-touch filter, alerts will only be issued in colored areas that haven't been touched yet, meaning they haven't yet been settled and have the greatest potential for reaction. Once the area is touched, only the border remains. Entry and stop-loss values are available both in the alerts and on the screen.
FREE
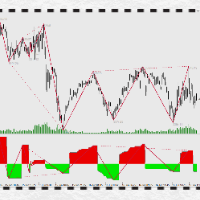
Introduction to PowerTrapezoid:
The application of market Power deviation system is not a secret, such as volume price deviation, MACD deviation, Chanlun deviation and so on. However, how to correctly understand and calculate, and accurately judge the increase or decrease of POWER is a threshold in application, which is difficult to cross with the conventional system. How to avoid reciting? How to implement multi level backflow parallel computing? How to intuitively show the range of backtrack
FREE

The Indicator show Daily Pivot Points. It is possible to specify the number of days to display. For forex it doesn't consider the sunday session data. It is possibile to modify the color, style and width for every level.It is better to use this indicator with timeframe not higher than Н1. 4 Levels of support and resistance with also Intermediate Levels that is possible to hide.
FREE

This is a Sharkfin Arrows Indicator. Detailed explanation and TDI extras: https://www.mql5.com/en/blogs/post/759138
This indicator will show only Arrows. It does not have TDI symbols on chart. Please get the extras from links above for TDI indicators.
Sharkfin Scanner (paid): https://www.mql5.com/en/market/product/123566
TDI Scanner Dash (paid): https://www.mql5.com/en/market/product/41826
About: This Indicator finds the Shark Fin Pattern. It will show an arrow in the current bar if RSI sha
FREE

Price Action Sniper is designed to trade the Price Action on the desired chart time frame. - Trend Reversals. - Trend Continuation. - Brekaouts. - Good tool for Binary Options
Price action forms the basis for all technical analysis of a currency pair, commodity or other asset chart. Many short-term traders rely exclusively on price action and the formations and trends extrapolated from it to make trading decisions. Technical analysis as a practice is a derivative of price action since it uses p
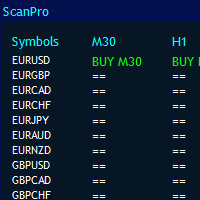
MT4 Universal Panel pro 는 ex4 파일을 포함한 모든 지표와 기간을 위해 설계되었습니다.
컴퓨터 전원과 최대 10시간 프레임을 기반으로 무한 쌍을 스캔할 수 있습니다. 패널의 크기는 자동으로 정렬됩니다.
버퍼로 모든 표시기를 호출할 수 있습니다.
모든 기본 및 사용자 지정 표시기에 대해 작동합니다. heikan ashi, rsi, 포물선, renko, 도형, 지지 저항, 수요 공급, 다이버전스, 고점 및 저점 이동 평균에 간단히 사용할 수 있습니다.
모든 통화에 대해 하나의 창에서 작동할 수 있습니다. 설정에 대한 질문이 있으면 연락하십시오.
이것은 모든 쌍에서 작동하는 mt4 대시보드입니다. 다음과 같이 쌍 이름을 입력하기만 하면 됩니다. 모든 외환 표시기를 호출하고 해당 신호 막대를 확인합니다.
즉. 패널 작업을 원하고 3쌍만 스캔하고 여러 시간 프레임을 입력하려면 다음과 같이 입력하십시오.
기호 : EURUSD,GBPUSD,USDJPY
시간 프레

현재 가격이 유지될 때 미리 받아두세요. 가격은 언제든지 변경될 수 있습니다. "Black Horse" 지표의 목표는 가격 행동과 VWAP 지표 간의 차이를 식별하는 것입니다. 이 지표는 잠재적으로 거짓된 차이를 걸러내고 고품질 및 정확한 경고를 생성하기 위해 필터를 사용합니다.
하락 차이는 양봉 위에 표시되는 빨간 점으로, 상승 차이는 양봉 아래에 있는 초록 점으로 나타납니다.
주된 차이 필터는 ATR(평균 실제 범위)와 되돌아보는 기간 내 이전 양봉의 가격 움직임을 중심으로 합니다. 가격 움직임이 ATR 곱하기 ATR 배수를 초과하는 충분한 강도로 나타날 때 차이가 확인됩니다.
계산 특성 상, 더 높은 시간 프레임에서 작업할 때 ATR 배수 및 되돌아보는 기간에 더 낮은 값을 설정하는 것이 좋습니다. 더 높은 시간 프레임에서는 가격 움직임이 보다 부드러워지므로 예를 들어 15분 차트에서처럼 급격한 가격 변동이 덜 발생하고 일반적으로 낮은 시간 프레임보다 더 적은 양봉 내에

RSI indicator with signal lines, at the intersection of which a corresponding notification will be issued, which can be in the form of a normal alert, or in the form of a user sound file.
The indicator also has the function of sending push-notifications and email notifications at the intersection of these levels.
The values of the levels can be set independently in the indicator settings, and, if desired, they can be changed and configured directly in the indicator window. To check the oper

평균 실제 범위( ATR )는 지정된 일수 동안의 시장 변동성을 측정한 것입니다. 가격이 박스권 끝에 도달했을 때 큰 폭의 연속 움직임을 기대해서는 안 됩니다. 시장에 연료가 떨어진 것으로 간주됩니다. 가격이 가장자리에 도달하지 않은 경우 여전히 이동 마진이 있습니다. 인디케이터 공식을 사용하면 고점-저점 레벨을 종합적으로 또는 개별적으로 계산할 수 있습니다. 이러한 레벨을 지지/저항 및 목표로 사용할 수도 있습니다.
매개변수 입력.
Start Day - 하루의 시작을 몇 시부터 계산할 것인가. 00 - 기본값입니다. ATR - 계산할 일수입니다. Calc Mode - 계산 방법 선택 (높음-낮음 / 높음 및 낮음).
Visual Button - 버튼 표시(활성화/비활성화). Corner - 버튼 앵커 각도. X indent - 픽셀의 수평 패딩. Y indent - 픽셀의 수직 패딩.
Label Visual - 디스플레이 레벨 레이블. Label Font Size -
FREE
Keltner Signals Pro: Trade Smarter, Earn More! Keltner Signals Pro Now available in EA format. Download Now. Boost your trading accuracy and eliminate false signals with Keltner Signals Pro – the advanced yet intuitive indicator designed for serious traders seeking consistent profits! Tired of misleading trading signals? Keltner Signals Pro masterfully combines the power of Keltner Channels for identifying crucial price breakouts with an unbeatable EMA200 Trend Filter . The result? More accurate
FREE

GalaxyReversalPro — Trend Signal Indicator
GalaxyReversalPro is a signal-based trend indicator designed for traders who value simplicity, accuracy, and reliability.
It’s extremely easy to use and requires no additional setup.
The tool helps you enter new trends early and exit before corrections begin — maximum precision with minimal risk.The algorithm is based on structural-impulse analysis: it tracks local highs and lows, detects breakouts of key levels, and confirms trend reversals only af
FREE

Info Plus is a simple tool that displays the current status on an asset class. The information displayed by Info Plus includes: Bid Price The high and low of the day. Candle time left. Current spread. Selected timeframe. Asset class selected (Symbol). Pip value. Open Positions. Total pips booked. Pips per trade. Session times (they may not be accurate and are subject to changes). Date and time.
How it Works When loaded onto any chart, Info Plus automatically gets the following parameters: Bid P
FREE
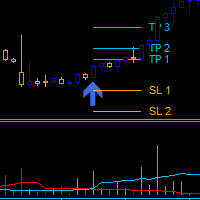
Dark Power is an Indicator for intraday trading. This Indicator is based on Trend Following strategy, also adopting the use of an histogram to determine the right power . We can enter in good price with this Indicator, in order to follow the strong trend on the current instrument. The histogram is calculated based on the size of the bars and two moving averages calculated on the histogram determine the direction of the signal
Key benefits
Easily visible take profit/stop loss lines Intui
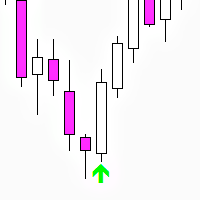
Three Bar Reversal (MT4) — free indicator Three Bar Reversal is a simple and effective MetaTrader 4 indicator that detects the classic three-bar reversal candlestick pattern with additional filtering based on ATR and candle body sizes.
Arrows are displayed on the last closed candle of the pattern, and push notifications are also sent. An automated trading robot Three Bar Reversal EA has been developed based on this indicator. The indicator works on all currency pairs and timeframes but pe
FREE

Turbo Trend technical analysis indicator, which determines the direction and strength of the trend, and also signals a trend change. The indicator shows potential market reversal points. The indicator's intelligent algorithm accurately determines the trend. Uses only one parameter for settings. The indicator is built for simple and effective visual trend detection with an additional smoothing filter. The indicator does not redraw and does not lag. Take profit is 9-10 times larger than stop loss

Evolutionize Your Trading with the UT Alert Bot Indicator for MQL4 The UT Alert Bot Indicator is your ultimate trading companion, meticulously designed to give you an edge in the fast-paced world of financial markets. Powered by the renowned UT system, this cutting-edge tool combines advanced analytics, real-time alerts, and customizable features to ensure you never miss a profitable opportunity. Whether you’re trading forex, stocks, indices, or commodities, the UT Alert Bot Indicator is your k
FREE

The Extreme point indicator helps in determining the probable price reversal points on the chart. The indicator facilitates the search for points to enter the market with greater accuracy. The indicator displays certain impulses, after which there is a high probability of the price continuing its movement in the same direction. The indicator can be used in conjunction with other indicators for a more accurate detection of the position entry points. The indicator can also be used independently. F

The Currency Index indicator enables traders to display any index of eight major currencies. It uses a special calculation that considers specific currency pairs and their weights.
The default weights are based on the BIS Triennial Central Bank Survey results. Because of this advantage, the trader can see each currency's true strength and weakness.
Note: If the indicator is used in Strategy Tester (demo version), please keep in mind that all currency pairs' data must be downloaded in History
Correlation Monitor 는 종목 간 관계를 빠르게 탐지하는 지표입니다 . 강한 양 / 음의 상관관계를 가진 페어를 찾고 , 다이버전스를 식별하며 , 헤지 · 페어 · 바스켓 트레이딩에서 보다 근거 있는 의사결정을 내리도록 돕습니다 . Meta traider 5.
주요 기능 • 상관관계 매트릭스와 컴팩트 리스트 : 선택한 심볼 간 관계의 강도를 즉시 보여 주며 , 색상 구분으로 가독성을 높입니다 . • 상관 심볼의 미니 차트 : 메인 차트의 가시 범위와 동기화되어 움직임을 직관적으로 비교할 수 있습니다 . • Top‑5 모드 : 가장 강한 양의 / 음의 관계를 강조 표시하여 빠르게 집중할 수 있습니다 . • 멀티 타임프레임 : 서로 다른 기간에서 평가하며 계산 창 ( 바 수 ) 을 설정할 수 있습니다 . • ‘ 시장 감시 (Market Watch)’ 의 모든 심볼을 지원하며 , 비표준 심볼도 가능합니다 . • 리소스 최적
FREE
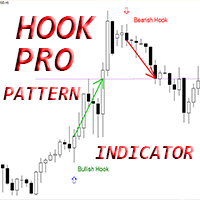
MT4용 Crypto_Forex 지표 "Hook Pro 패턴", 리페인트 없음, 지연 없음.
- "Hook Pro 패턴" 지표는 가격 변동 거래에 매우 강력한 지표입니다. - 이 지표는 차트에서 강세 및 약세 Hook 패턴을 감지합니다. - 강세 Hook - 차트의 파란색 화살표 신호(그림 참조). - 약세 Hook - 차트의 빨간색 화살표 신호(그림 참조). - PC, 모바일 및 이메일 알림 기능 제공. - "Hook Pro 패턴" 지표는 지지/저항선과 함께 사용하기 좋습니다. - 지표에는 정보 표시 기능이 있습니다. 지표가 연결된 외환 통화쌍의 현재 스프레드와 스왑을 표시합니다. - 정보 표시에는 계좌 잔액, 자본금, 증거금도 표시됩니다. - 정보 표시는 차트의 어느 모서리에나 배치할 수 있습니다. 0 - 왼쪽 상단, 1 - 오른쪽 상단, 2 - 왼쪽 하단, 3 - 오른쪽 하단.
여기를 클릭하여 고품질 트레이딩 로봇과 지표를 확인하세요! 본 제품은 MQL5 웹사이트에서만 제

This indicator represents a genuine momentum oscillator according to the true definition of "Momentum", and as realised by the techniques of digital filtering. ( Note : download a complete set of true momentum oscillators here ). A scholarly paper on the subject by the current developer can be found here , but in this description we shall borrow only the minimum of conceptual and mathematical framework needed. In the process, we expose some long-held myths about indicators supposedly measurin
FREE

The MACD 2 Line Indicator is a powerful, upgraded version of the classic Moving Average Convergence Divergence (MACD) indicator.
This tool is the embodiment of versatility and functionality, capable of delivering comprehensive market insights to both beginner and advanced traders. The MACD 2 Line Indicator for MQL4 offers a dynamic perspective of market momentum and direction, through clear, visually compelling charts and real-time analysis. Metatrader5 Version | How-to Install Product | How-to
FREE

The indicator of the indicators. The Most Powerful Technique to Determine Forex Trend Strength in 2023. We have perfected Supreme Commander that it calculates an average of the selected indicators (up to 16) and the selected timeframe (all) with the result of a single trend that indicates the potential of buying and selling. It includes the following indicators:
Accelerator/Decelerator oscillator Average Directional Movement Index Awesome oscillator; Bulls and Bears Commodity Channel Index; De

"TREND REVERTING PRO – THE INDICATOR FOR TRADERS WHO VALUE CALM AND CONTROL - The Smart Indicator for Confident Traders!" Bonus: You get the Forex Trend Commander Indicator absolutely free!
Turn market complexity into clear, actionable signals. Based on real market data and years of experience. Trend Reverting PRO doesn’t predict the future, but it gives you control and confidence, even when the market is unpredictable.
"Have you tested the indicator on the strategy tester yet, if not do it no

UR 볼륨트렌드
UR VolumeTrend는 볼륨 측면에서 진행 중인 추세를 보여주는 가장 명확한 볼륨 표시기입니다. UR TrendExhaustion과 같은 다른 지표와 완벽하게 작동하여 로컬 고점과 저점을 나타냅니다.
단 2개의 매개변수로 제한됩니다. 값이 높을수록 더 긴 추세가 표시됩니다. 기울기 극단은 잠재적 반전을 포착하기 위해 가능한 볼륨 소진을 보여줍니다. 두 줄 - 거래량 추세 및 평균입니다. 최고의 장점: 쉽고 모든 자산에 맞게 조정됩니다. 도구 업데이트를 최신 상태로 유지하고 빠진 것이 있다고 생각되면 요청을 보낼 수 있는 특별한 텔레그램 채팅이 있습니다!
왜 UR VolumeTrend인가?
거래량이 추세를 파악하는 데 중요하다는 데 모두 동의할 것입니다. 이 오실레이터는 사용하기 쉬운 하나의 표시기로 압축된 모든 볼륨 도구의 합계입니다. 보기 편한 방식으로 양수/음수 양을 보여줍니다. 뒤의 인터페이스는 볼륨이 과거에 비해 소진될 가능성이 있는지 또는
Sniper Flip Zones – 정밀한 매수/매도 신호 시스템
Sniper Flip Zones는 추세장이나 횡보장에서 모멘텀이 급격히 전환되는 순간을 포착하여 매우 정밀한 매수 및 매도 신호를 생성하도록 설계했습니다. XAUUSD의 M1/M5에서 특히 잘 작동하며, 설정 가능한 매개변수를 통해 어떤 통화쌍이나 시간대에서도 사용할 수 있습니다.
최신 정보를 받아보시려면 채널을 구독하세요: https://www.mql5.com/en/channels/forexnewadvisor
핵심 로직은 다음 요소들을 결합합니다:
– 스토캐스틱 지표의 극단 영역(10/90)에서의 반전 – 선택 가능한 %K와 %D의 교차 신호 – 단기 및 장기 이동 평균을 활용한 동적 추세 인식 – 같은 방향의 연속 신호를 피하기 위한 교차 신호 논리
신호가 생성되는 방식:
– 과매수/과매도 탈출: 빠른 스토캐스틱이 극단 구간을 벗어날 때 단기적인 반전을 감지합니다. – 교차 필터: 보다 강력한 확인을 위
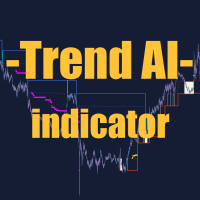
Trend AI Indicator 설명:
Trend AI Indicator는 인공 지능을 사용하여 트렌드와 주요 레벨을 식별하는 강력한 시장 분석 도구입니다. 이 지표는 변화하는 시장 조건에 자동으로 적응하여 의사 결정을 위한 정확한 데이터를 제공합니다. 주요 기능: 트렌드 식별: 이 지표는 머신 러닝 알고리즘을 사용하여 트렌드 방향(상승, 하락, 횡보)을 정확하게 판단합니다. 주요 레벨: 과거 데이터를 기반으로 지지 및 저항 레벨을 자동으로 구축합니다. 안전한 거래 구역: 가능한 최소 스톱 로스로 리스크를 최소화하는 구역을 정의합니다. 적응성: 지표는 시장 변동성에 적응하여 잘못된 데이터를 최소화합니다. 사용자 정의 설정: 다양한 거래 전략 및 시간대에 맞게 사용자 정의 가능합니다. 장점: AI 사용으로 높은 정확도 제공. 모든 시장 유형(외환, 주식, 암호화폐)에 적합합니다. 안전한 거래 구역은 가능한 최소 스톱 로스로 리스크를 최소화합니다. 초보자와 전문가

"Experience the full power on EURUSD!" Title: ChanLun Structure and SMC System Description: This indicator combines ChanLun Theory (Bi, Duan, Zhongshu) with Smart Money Concepts (SMC) to analyze market structure. It visualizes the market in three distinct layers—Pen, Segment, and Wave—and automatically identifies Premium, Discount, and Optimal Trade Entry (OTE) zones. The tool features an Interactive Hybrid Control System , allowing traders to manage the chart using keyboard hotkeys or mouse int
FREE

하모닉 패턴은 시장 반전점을 예측하는 데 가장 적합합니다. 이러한 패턴은 높은 승률과 하루 동안 다양한 거래 기회를 제공합니다. 저희 인디케이터는 하모닉 트레이딩 문헌에 기반하여 가장 인기 있는 하모닉 패턴을 식별합니다. 중요 사항: 이 인디케이터는 다시 그리지 않으며 (D 지점에서 패턴을 감지함), 따라잡지 않습니다 (패턴이 유효하거나 취소됨). 사용 방법: MT5 차트에 인디케이터를 끌어다 놓으세요. 패턴 감지를 TRUE로 설정하세요 (ABCD; Gartley). 원하는대로 편차를 조정하세요 (높은 편차는 더 많은 패턴, 낮은 편차는 더 적은 패턴). 색상을 원하는 대로 사용자 정의하세요. 필요에 따라 ENTRY POINT, TP 및 SL에 대한 경고를 활성화하거나 비활성화하세요. 패턴 감지 시: 알고리즘은 D 지점에서 패턴을 감지합니다. 경고가 활성화되어 있으면 패턴 감지에 대한 알림을 보냅니다. 패턴이 무효화되면 "패턴 취소"라는 메시지가 포함된 경고가 트리거됩니다. 성공적인
FREE
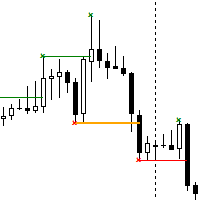
The Break of Structure (BoS) and Change of Character indicator is a powerful tool designed to identify significant turning points in price movements on financial charts within the MetaTrader 4 platform. By analyzing price action, this indicator highlights instances where the market shifts from a trend to a potential reversal or consolidation phase. Utilizing sophisticated algorithms, the indicator identifies breakouts where the structure of price movement undergoes notable changes. These breakou
FREE

ZigZag WaveSize - 파장에 대한 정보를 포인트로 추가한 수정된 표준 ZigZag 지표입니다.
특징: 최적화된 온라인 구성 로직: 레이블은 각 틱에서 처음부터 다시 그려지지 않고, 주 계산과 병렬로 작동하며, ZigZag가 새로운 선을 그리거나 업데이트할 때 마지막 레이블만 그립니다. 포인트의 또 다른 계산 모드가 추가되었습니다. 설정에서 지정된 포인트 수를 초과하면 라인이 구축됩니다. 수동 및 자동(미세 조정을 위한 계수가 있는 ATR에 의해) 가장 최근의 것부터 시작하여 색상과 두께에 따라 모든 지그재그 선을 강조 표시하는 추세선이 추가되었습니다. 2가지 색상 렌더링 모드가 추가되었습니다: 1) 표준(상단선 - 한 가지 색상, 하단선 - 다른 색상); 2) 구조적(동시에 상승 또는 하락 극단을 갖는 고전적 추세 - 단일 색상) 알림 모드 2개가 추가되었습니다: 1) 새로운 지그재그 선이 나타납니다. 2) 현재 지그재그 라인에 의한 마지막 극단의 돌파 평균 라인 크기
FREE
Signal King: Your Supreme Trend Indicator Ever felt lost in the noise of the market? The "Signal King" indicator cuts through the chaos, delivering clear, high-probability buy and sell signals directly to your chart. This isn't just another trend indicator; it's a powerful tool designed to give you an edge by combining the robust Supertrend with a reliable EMA filter . The Supertrend excels at identifying the overall market direction, while the EMA acts as a powerful confirmation filter. This du
FREE

PLEASE NOTE You can customize the settings of Fast EMA, Slow EMA, MACD SMA & Main SMA. The accuracy will change as per your settings.
100% Non repaint indicator
Pre-alert (get ready) signals
Non-delay indications
24/7 signals
100% No lag
No recalculating The arrows wont repaint even if the signal fails, or you refresh or restart the mt4 Indicator is based on simple crossover strategy of main line and signal line of MACD indicator in consideration with zero line and Main SMA. The best thing
FREE
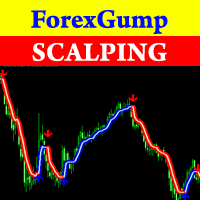
Attention! Friends, since there have been many scammers on the Internet recently selling indicators called ForexGump, we decided to warn you that only on our page is the LICENSE AUTHOR'S VERSION of the INDICATOR sold! We do not sell this indicator on other sites at a price lower than this! All indicators are sold cheaper - fakes! And even more often sold demo versions that stop working in a week! Therefore, in order not to risk your money, buy this indicator only on this site! Forex Gump Scalpin
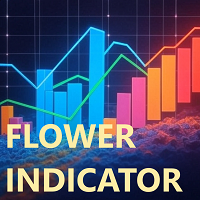
플라워 지표는 주로 추세를 파악하고 스캘핑 또는 일중 거래 전략을 지원하는 데 사용되는 기술 분석 도구입니다.
플라워 지표는 기술적 분석 및 가격 변동 분석을 기반으로 하는 신호 추세 지표입니다. 파란색 꽃은 상승 추세를, 빨간색 꽃은 하락 추세를 나타내는 등 다양한 색상의 꽃을 사용하여 추세를 시각적으로 보여줍니다.
각 레벨은 지지선과 저항선 역할을 할 수 있습니다(+/- 200 레벨과 차트에 나타나는 점을 주의 깊게 살펴보세요).
과매수/과매도 고정 레벨이나 그에 따른 밴드, 또는 둘 다, 또는 둘 중 하나를 돌파할 때 점이 나타나도록 설정할 수 있습니다.
이 지표는 시장의 잠재적 반전을 감지하고 매집/분산 구간을 파악합니다. 모든 상품 및 시간대와 호환되며, 매개변수는 필요에 따라 조정할 수 있습니다. 각 레벨은 지지선과 저항선 역할을 할 수 있습니다.
FREE
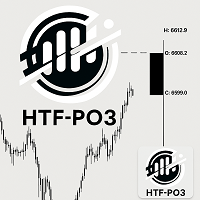
HTF Power of Three (ICT) - MT4 Indicator - Version 1.1 Overview The HTF Power of Three indicator is a professional implementation of the Inner Circle Trader's (ICT) Power of Three concept, inspired by Larry Williams. This indicator visualizes higher timeframe (HTF) candle development in real-time on any lower timeframe chart, making it an essential tool for ICT traders who study institutional price movement patterns. What is Power of Three (PO3)? Power of Three represents a three-staged Sma
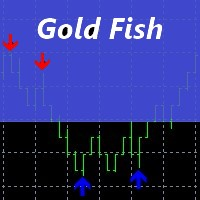
Thank you for your interest in "Goldfish Indicator". I have been trading since 2008. I usually trade on Renko chart in reversal pattern with Goldfish Indicator. If you share your vps details with me, I will connect your account (Live/Demo). To get proper results copy my trades for at least 30 days. Minimum Deposit: $1000 Leverage: 100:1 Profit Target: Monthly average profit target is 10% to 20%+/- Draw-down: The average drawdown is 10% to 20% Risk
Warning: Trading financial products on margin
FREE
CIS is designed for trading a basket of correlating currencies, as well as single instruments: indicators
VSA indicator which draws arrows (does not redraw). Its signals indicate the price reversal on a calm market or decrease of the rise or fall rate during strong movements. Works fine in the flats. As the indicator uses volumes in its calculations, be careful during evenings and night times, when there are very small volumes. It is recommended to be used only on multiple currencies or at lea

스캘퍼를 위한 VWAP
세션 인식 VWAP 라인으로 빠르고 정확한 스캘핑을 수행합니다. ️ 입력 (MT4/MT5) Enable_Hourly_VWAP: 시간별 VWAP 활성화. Enable_Asia_VWAP: 아시아 세션 VWAP 활성화. Enable_Europe_VWAP: 유럽 세션 VWAP 활성화. Enable_NA_VWAP: 북미 세션 VWAP 활성화. Enable_Extended_VWAP: 연장 세션 VWAP 활성화. Enable_Daily_VWAP: 일일 VWAP 활성화. 아시아 세션(GMT) Session_Asia_Start_Hour: 아시아 세션 시작 시간. Session_Asia_End_Hour: 아시아 세션 종료 시간. 유럽 세션(GMT) Session_Europe_Start_Hour: 유럽 세션 시작 시간. Session_Europe_End_Hour: 유럽 세션 종료 시간. 북미 세션(GMT) Session_NA_Start_Hour: 북미 세션 시작 시간. Ses
FREE

Flag Pattern Indicator - Your Guide to Flagging Profitable Trade Setups Welcome to the world of precision trading with the "Flag Pattern Indicator." Designed for MetaTrader, this powerful tool is your go-to solution for identifying one of the most reliable and versatile chart patterns in technical analysis: the flag pattern. Whether you're a seasoned trader or just starting, this indicator simplifies the process of spotting flag patterns, giving you an edge in your trading decisions. Key Feature
FREE
This is a powerful, session-aware breakout indicator designed for serious traders who thrive on volatility and structure. Engineered for precision, it identifies high-probability breakout zones during the London and New York trading sessions—where the market moves with intent. Key Features: Session Range Detection
Automatically detects and highlights the key price range of London and New York sessions. Breakout Confirmation
Identifies breakout candles after the session range, with cl
FREE
This automated VOLUME SCALPING INDICATOR can be utilized to manage trades and identify potential areas of support and resistance for both buying and selling. It is designed to identify zones for Sell/Buy trades based on the volume analysis and can be effectively used in conjunction with other indicators, such as order block indicators, and more. Currently designed for MT4, it will later be adapted to function on MT5. We also offer the opportunity to customize the robot according to your trading
FREE
Level Box Tool is a powerful and user-friendly custom indicator designed for traders who utilize technical analysis tools like rectangles and trend lines to identify key support, resistance, and price zones. This tool simplifies and speeds up the process of marking chart levels, offering both visual clarity and precision with its fully customizable panel, and now includes price-cross alerts — so you’ll never miss a key level again. MT5 Version - https://www.mql5.com/en/market/
FREE

Alan Hull's moving average, more sensitive to the current price activity than the normal MA. Reacts to the trend changes faster, displays the price movement more clearly. Color version of the indicator. Improvement of the original version of the indicator by Sergey <wizardserg@mail.ru>. Suitable for all timeframes.
Parameters Period - smoothing period, recommended values are from 9 to 64. The greater the period, the smoother the indicator. Method - smoothing method, suitable values are 0, 1, 2
FREE

Ziwox 월드맵 세션 인디케이터(MetaTrader 4용) 글로벌 시장 인식을 차트에 직접 가져오세요!
Ziwox 월드맵 세션 인디케이터는 실시간 세계 지도를 MT4 차트 배경으로 표시하며, 현재 거래 세션과 완벽하게 동기화됩니다. 주요 기능: 실시간 세션 동기화 : 현재 캔들이 세계 지도에서 정확히 어디에 위치하는지 확인할 수 있습니다. 동기화 모드 전환 : 실시간 동기화 모드와 고정 지도 모드 사이를 전환하여 거래 계획을 보다 효과적으로 세울 수 있습니다. 맞춤형 색상 : 지도 색상, 세션 마커 및 강조 표시를 선호에 맞게 조정 가능. 차트 내 시간 표시 : 차트에서 직접 세션 시간을 확인하여 더 나은 의사결정 가능. 시각적 거래 인식 : 거래 진입 시 세션 내 위치를 즉시 확인 가능. 데이 트레이더든 스윙 트레이더든, Ziwox 월드맵 세션 인디케이터를 사용하면 글로벌 시장의 리듬에 맞춰 거래할 수 있습니다.
MT4 글로벌 세션 맵 인디케이터 – 시장 타이밍 추적의 핵심 거
FREE
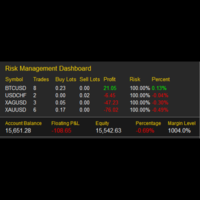
My Risk Management The Risk Management Dashboard is a visual tool designed to help traders monitor risk exposure in real time. With a clear and compact layout, it provides an instant overview of trading activity, enabling more disciplined and informed decision-making. Key Features Active Symbol Summary
Displays all traded symbols with the number of trades, total buy/sell lots, and current profit/loss. Per-Symbol Risk Analysis
Calculates and shows the risk percentage of each symbol relative to
FREE

Pivot trading:
1.pp pivot
2. r1 r2 r3, s1 s2 s3 Necessary for traders: tools and indicators Waves automatically calculate indicators, channel trend trading Perfect trend-wave automatic calculation channel calculation , MT4 Perfect trend-wave automatic calculation channel calculation , MT5 Local Trading copying Easy And Fast Copy , MT4 Easy And Fast Copy , MT5 Local Trading copying For DEMO Easy And Fast Copy , MT4 DEMO Easy And Fast Copy , MT5 DEMO
Strongly recommend trend indicators, auto
FREE

Metatrader 4 서버에서 동부 표준시(뉴욕 현지 시간)를 쉽게 식별할 수 있도록 Metatrader 4용으로 디자인한 이 사용자 지정 표시기입니다. 그러나 드롭다운 메뉴에서 시간대를 변경하여 현지 시간을 식별하는 데 사용할 수 있습니다. 선택한 시간대의 특정 시간에 모든 색상의 수직선을 추가할 수 있습니다. 선택한 시간대 또는 실제 서버 시간을 기준으로 수평 자동 계산 시가, 고가, 저가 및 종가 라인을 추가할 수 있습니다. 빠른 참고: 뉴욕 동부 표준시를 사용하는 경우 일광 절약 시간 동안 항상 일광 절약 시간이 켜져 있는지 확인하십시오. English: This custom indicator I designed for Metatrader 4 to be able to easily identify Eastern Standard Time (New York Local Time) from any metatrader 4 server. But, you can use this to id
FREE

The " YK Find Support And Resistance " indicator is a technical analysis tool used to identify key support and resistance levels on a price chart. Its features and functions are as follows:
1. Displays support and resistance levels using arrow lines and colored bands, with resistance in red and support in green.
2. Can be adjusted to calculate and display results from a specified timeframe using the forced_tf variable. If set to 0, it will use the current timeframe of the chart.
3. Uses the
FREE

Round Numbers Levels indicator for MT4 Round Numbers indicator is a simple but useful indicator to draw 00 and 50 price levels in your chart.
These levels act as supports and resistances, and therefore should be taken into account when trading.
These levels can be used as profit targets or entry points.
Inputs of the indicator are:
TGridColor00: color to be used for xx00 levels GridStyle00: line style to be used for xx00 levels GridWidth00: line width to be used for xx00 levels GridColor50:
FREE
트레이딩 세션 3: 글로벌 시장 활동 시각화 트레이딩 세션 3 는 주요 일중 거래 세션인 아시아, 런던, 뉴욕 을 명확하게 표시하도록 설계된 직관적인 MQL5 지표입니다. 글로벌 시장 활동을 명확하게 이해하고 전략적인 거래 결정을 위해 변동성 증가 기간을 정확히 파악하십시오. 주요 기능: 글로벌 세션 시각화: 차트에서 아시아, 런던, 뉴욕 세션의 활성 거래 시간을 쉽게 식별할 수 있습니다. 변동성 통찰력: 각 세션 동안 어떤 통화가 일반적으로 가장 중요한 가격 변동을 경험하는지 이해하십시오. 아시아 세션: AUD, NZD 및 JPY 통화 쌍에서 종종 더 높은 변동성을 보입니다. 런던 세션: GBP 및 EUR 통화 쌍의 변동성 증가가 특징입니다. 뉴욕 세션: USD 는 일반적으로 이 세션 동안 가장 변동성이 큰 통화입니다. 사용자 정의 가능한 거래 시간: 유연한 HH:MM 입력 필드를 사용하여 세션 시간을 특정 요구 사항에 맞게 조정하십시오. 선택 가능한 표시 요일: 집중적인 분석을
FREE
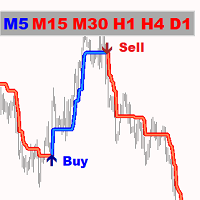
골드 포인터는 최고의 추세 지표입니다. 지표의 고유한 알고리즘은 기술적 및 수학적 분석 요소를 고려하여 자산 가격의 움직임을 분석하고 가장 수익성이 높은 진입 지점을 결정하고 매수 또는 매도 주문을 개시하라는 신호를 제공합니다.
최고의 보조지표 신호:
- 매도 = 빨간색 추세선 + 빨간색 TF 표시기 + 같은 방향의 노란색 신호 화살표. - 매수 = 파란색 추세선 + 파란색 TF 인디케이터 + 같은 방향의 아쿠아 신호 화살표.
인디케이터의 장점:
1. 표시기는 높은 정확도로 신호를 생성합니다. 2. 표시기의 확인 된 신호는 오디오 경고 (경고 및 메시지)로 신호 (화살표)를 확인한 후에도 사라지지 않고 다시 그려지지 않습니다. 3. 모든 브로커의 메타트레이더 4 거래 플랫폼에서 거래할 수 있습니다. 4. 모든 자산(통화, 금속, 암호화폐, 주식, 지수 등)을 거래할 수 있습니다. 5. 모든 차트주기(M5-M15 스캘핑 및 트레이딩/M30-N1 중기 트레이딩/H4-D1 장기

MT4용 R 2EMA 색상 표시기는 2 EMA의 교차를 기반으로 견고한 거래 신호를 제공합니다.
키 포인트 가격이 두 개의 녹색 EMA 위로 교차하고 닫히면 구매 거래 신호가 생성됩니다. 가격이 두 개의 빨간색 EMA 위로 교차하고 닫히면 매도 거래 신호가 생성됩니다. R 2EMA Color Forex 지표를 사용하면 구매 및 판매 시점을 더욱 쉽게 결정할 수 있습니다.
2개의 EMA 라인이 녹색으로 바뀌면 매수 신호가 발생합니다. 2개의 EMA 라인이 빨간색으로 바뀌면 매도 신호가 발생합니다. 그것으로 거래하는 방법? 두 개의 EMA 신호선이 빨간색에서 녹색으로 바뀌는 즉시 구매 거래를 시작하면 이제 추세가 긍정적입니다. 두 개의 EMA 신호선이 녹색에서 빨간색으로 바뀌는 즉시 매도 거래를 시작하십시오. 추세는 이제 음수입니다. 차트에서 반대 거래 신호가 발생하면 거래를 종료하십시오.
좋아하는 거래 방법을 자유롭게 사용하여 R 2EMA 색상 표시기로 거래를 열고 닫으십시오.
FREE

Key Levels + Zones
Indicator cleanly displays even numbered price levels: “00s” and “50s” . Additionally, you can display “Mid-Lines” which are preset distance levels on both sides of the even numbered price levels (set to 12.5 pips by default). This 25-pip zone that straddles each even numbered price relates to where many traders place their stops and therefore can be a risk “Zone” to steer clear of when placing your stops. The zone also acts as support and resistance. Indicator p rovide
FREE

센티넬 애로우 주요 기능:
⊗추세, 반전, 모멘텀 변화를 빠르고 정확하게 식별하는 독점 알고리즘입니다. ⊗전문가용으로 설계되었으며, 지연이나 잘못된 업데이트를 방지하는 강력한 신호 로직을 갖추고 있습니다. ⊗다양한 시간대에 적합합니다. ⊗과거 신호를 다시 그리거나 삭제하거나 수정하지 않습니다. ⊗모든 매수 및 매도 신호는 캔들스틱 자체에서 생성되며 고정됩니다. ⊗실제 거래에서는 다시 그리지 않고, 신호가 캔들스틱 자체에 즉시 나타납니다. ⊗안정성, 정확성, 유연성을 보장합니다. ⊗높은 수익률의 신호를 제공합니다. ⊗각 신호는 한 번만 트리거되며 반복되지 않습니다. ⊗모든 통화쌍, 지수, 주식, 외환, 금속, 암호화폐에 적합합니다. ⊗추세 트레이딩, 스윙 트레이딩, 반전 확인. ⊗신뢰할 수 있고 명확한 전문 시그널을 찾는 트레이더에게 적합합니다. ⊗완벽한 맞춤 설정 가능.
FREE
MetaTrader 마켓 - 거래자를 위한 로봇 및 기술 지표는 거래 터미널에서 바로 사용할 수 있습니다.
The MQL5.community 결제 시스템은 MQL5.com 사이트의 모든 등록된 사용자가 MetaTrader 서비스에서 트랜잭션을 수행할 수 있습니다. 여러분께서는 WebMoney, 페이팔, 또는 은행 카드를 통해 자금을 예치하거나 인출하실 수 있습니다.
트레이딩 기회를 놓치고 있어요:
- 무료 트레이딩 앱
- 복사용 8,000 이상의 시그널
- 금융 시장 개척을 위한 경제 뉴스
등록
로그인
계정이 없으시면, 가입하십시오
MQL5.com 웹사이트에 로그인을 하기 위해 쿠키를 허용하십시오.
브라우저에서 필요한 설정을 활성화하시지 않으면, 로그인할 수 없습니다.