ADX Dashboard
- 지표
- 버전: 4.10
- 업데이트됨: 12 4월 2026
- 활성화: 10

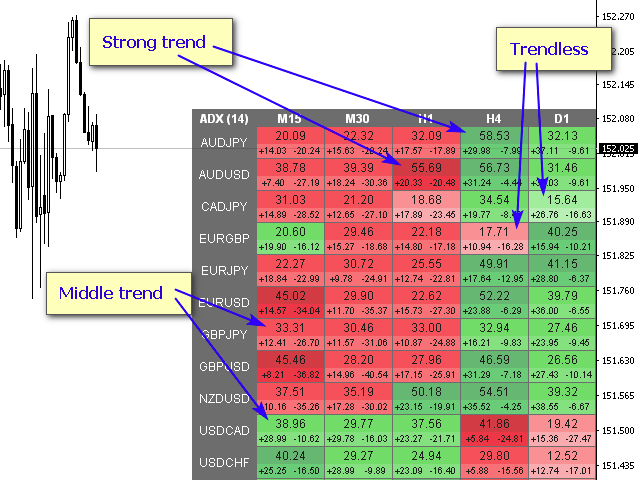
ADX 지표는 추세와 강도를 결정하는 데 사용됩니다. 가격의 방향은 +DI와 -DI 값으로 표시되며, ADX 값은 추세의 강도를 나타냅니다. +DI가 -DI보다 높으면 시장은 상승 추세에 있고, 반대로이면 하락 추세에 있습니다. ADX가 20 미만이면 명확한 방향이 없습니다. 지표가 이 수준을 돌파하자마자 중간 강도의 추세가 시작됩니다. 40보다 큰 값은 강한 추세(하락 추세 또는 상승 추세)를 나타냅니다.
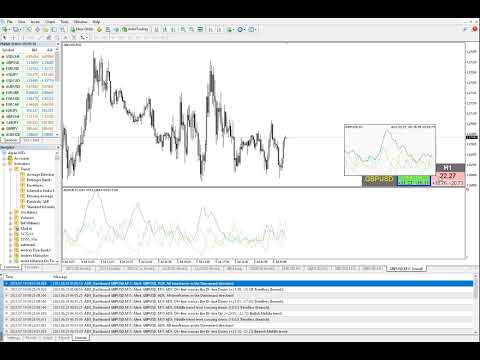
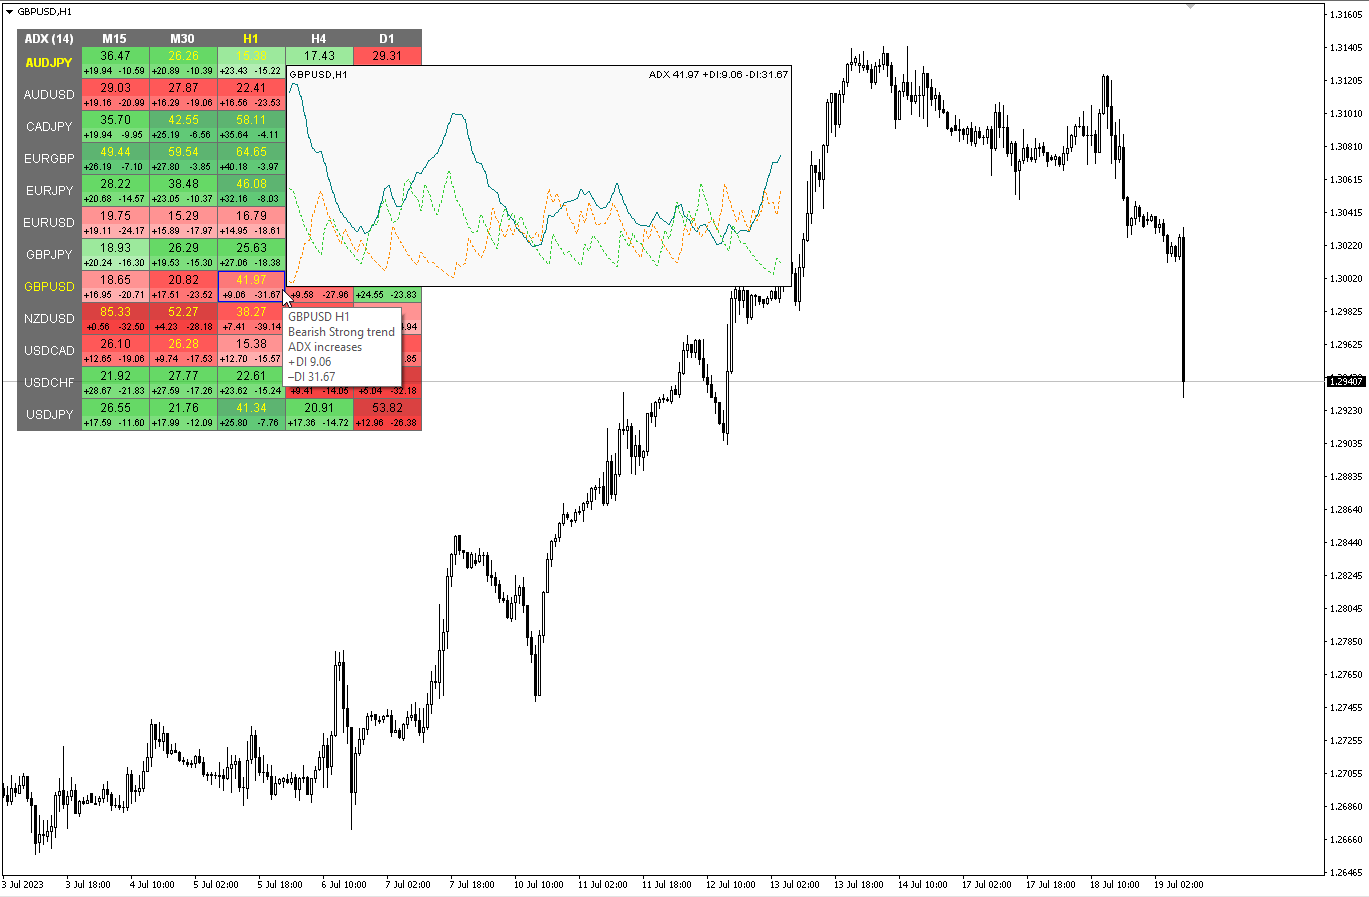
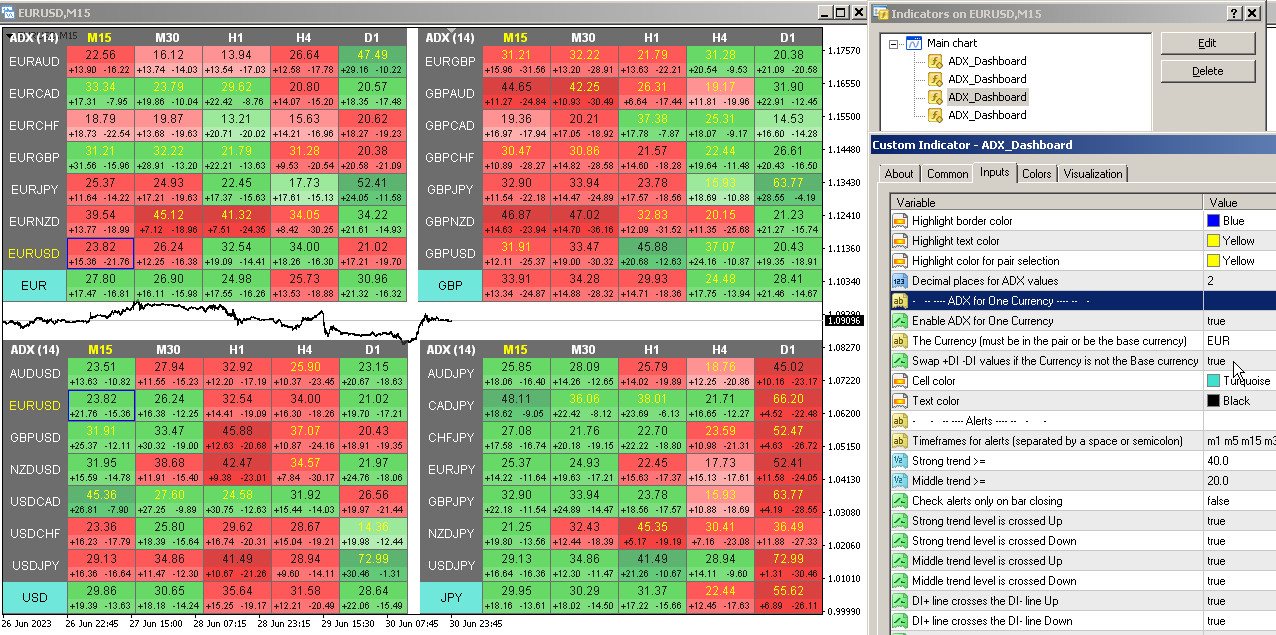
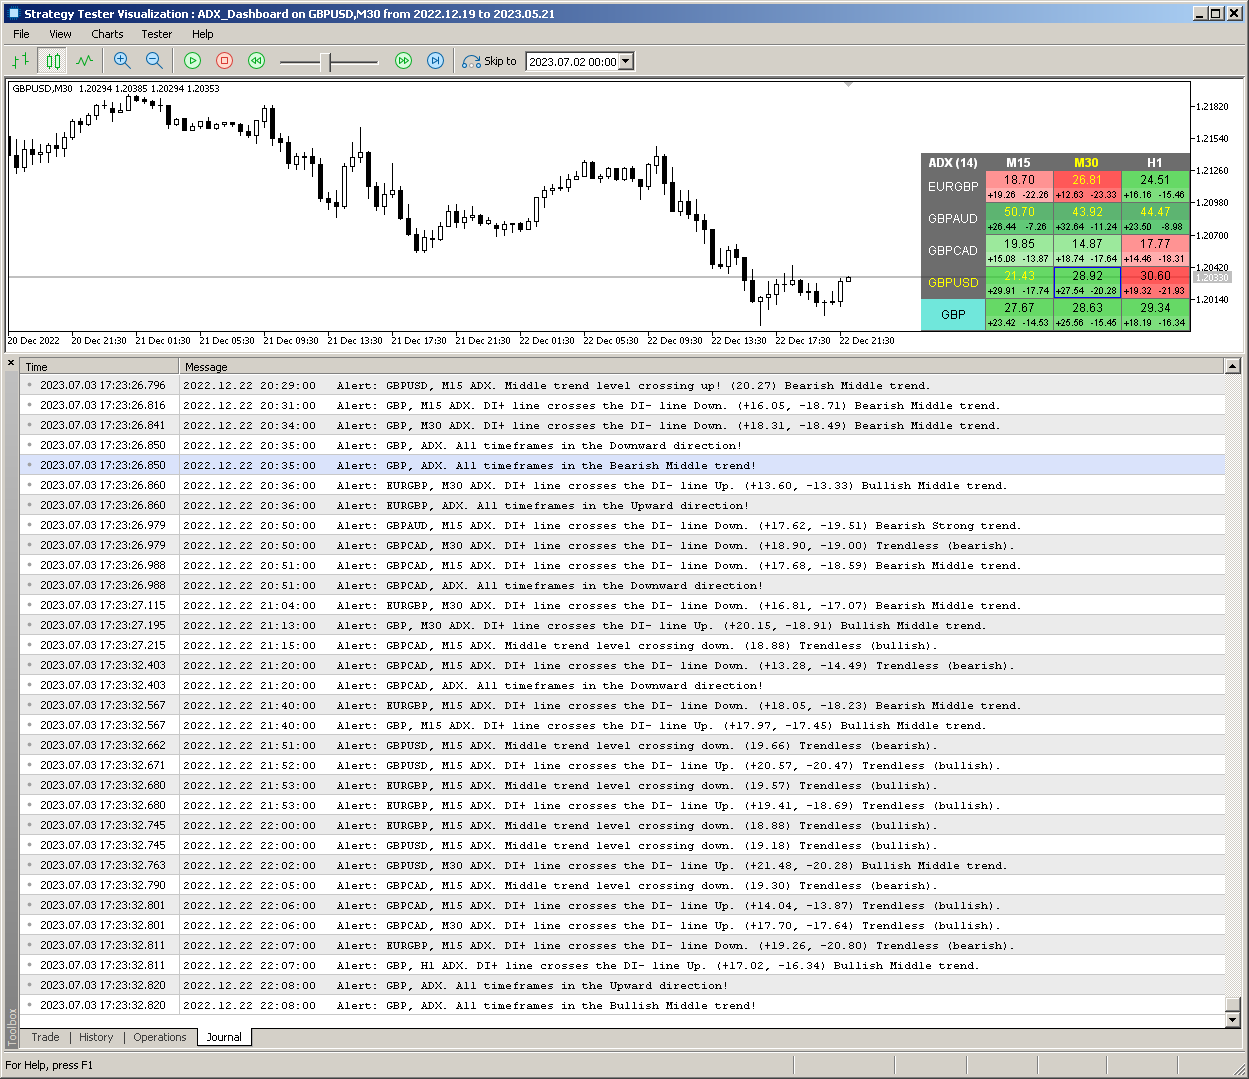
평균 방향 이동 지수(ADX) 지표의 다중 통화 및 다중 시간대 수정. 매개변수에서 원하는 통화와 기간을 지정할 수 있습니다. 또한 지표는 추세 강도 수준이 교차할 때, 그리고 +DI 및 -DI 선이 교차할 때 알림을 보낼 수 있습니다. 마침표가 있는 셀을 클릭하면 해당 기호와 마침표가 열립니다. MTF 스캐너입니다.
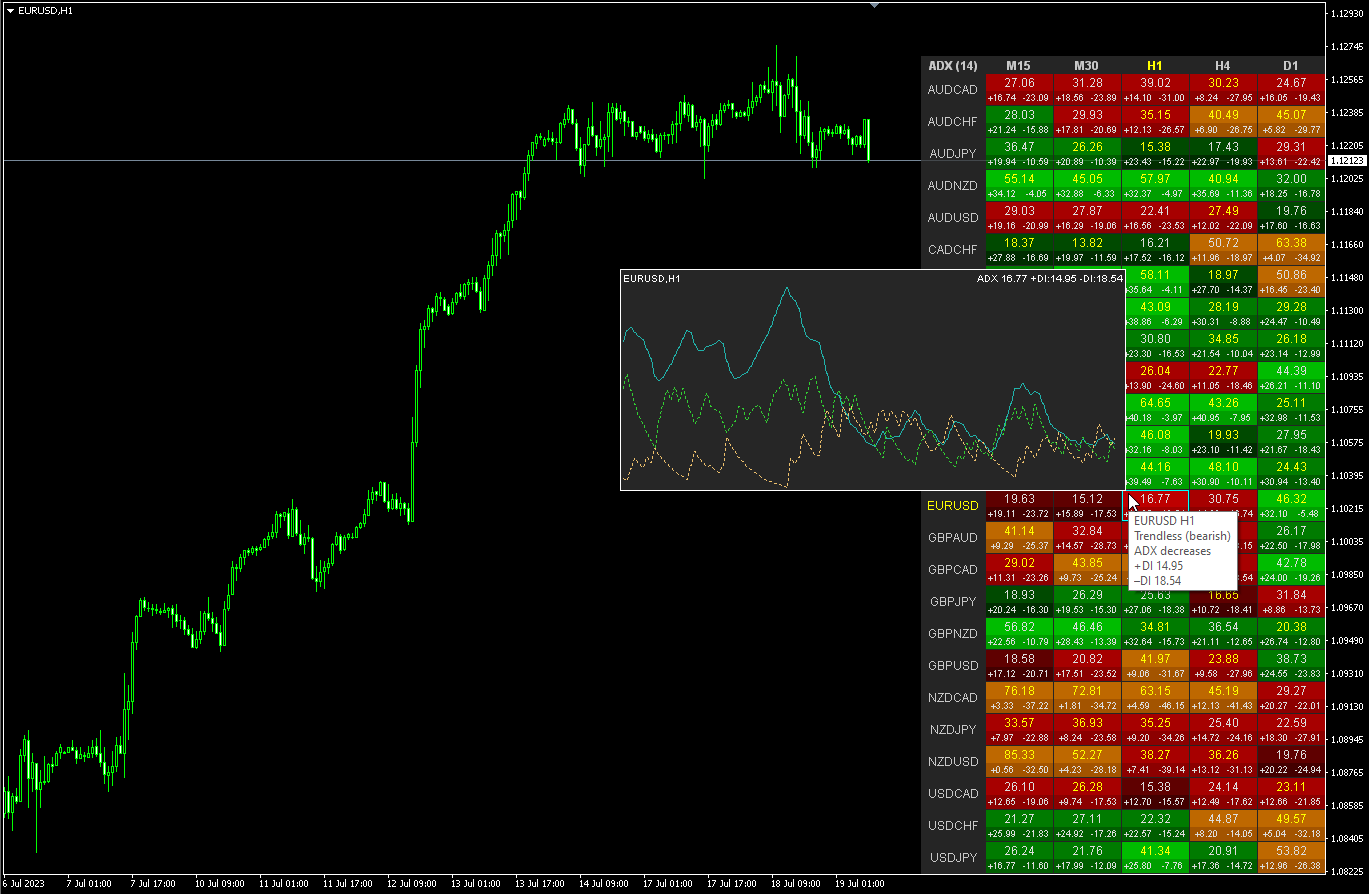
통화 강도 측정기(CSM)와 마찬가지로 대시보드는 지정된 통화가 포함된 쌍 또는 해당 통화가 기본 통화로 포함된 쌍을 자동으로 선택할 수 있습니다. 표시기는 "쌍 집합"에 지정된 모든 쌍에서 통화를 검색합니다. 다른 쌍은 무시됩니다. 그리고 이 쌍을 기반으로 이 통화에 대한 총 ADX가 계산됩니다. 그리고 그 통화가 얼마나 강하거나 약한지 알 수 있습니다.
차트에서 대시보드를 숨기는 키는 기본적으로 "D"입니다
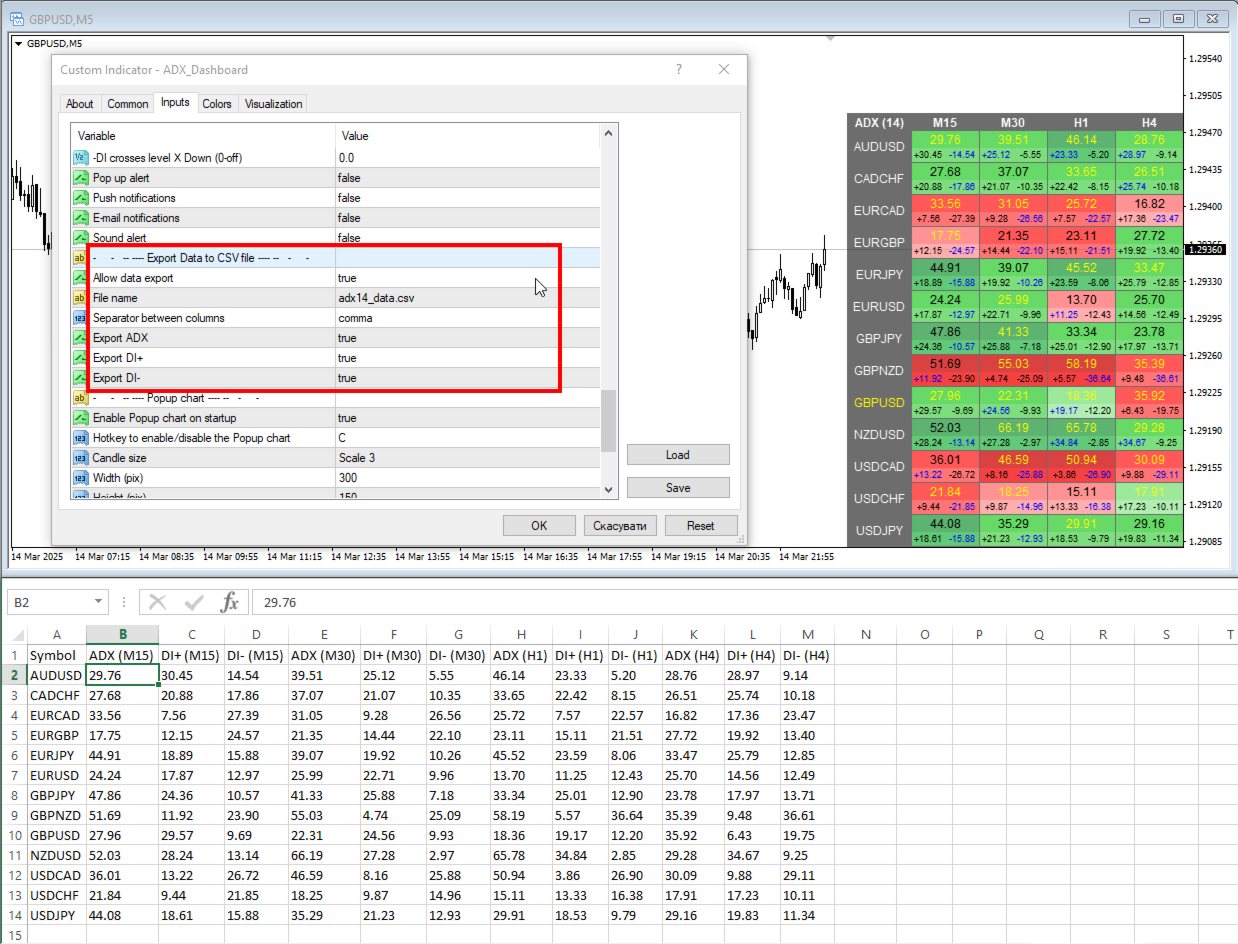
ADX 대시보드에서 CSV 파일로 데이터를 내보낼 수 있습니다. 파일은 터미널 폴더 \MQL4\Files에 저장됩니다.
데이터는 타이머 "매 (초)마다 대시보드 새로 고침"에 따라 기록됩니다.
Excel에서 열 때 저장된 파일을 업데이트하려면 "데이터 탭" - "텍스트에서 외부 데이터 가져오기"를 통해 열어야 합니다. 그러면 대시보드와 Excel에서 파일이 업데이트됩니다.
매개변수
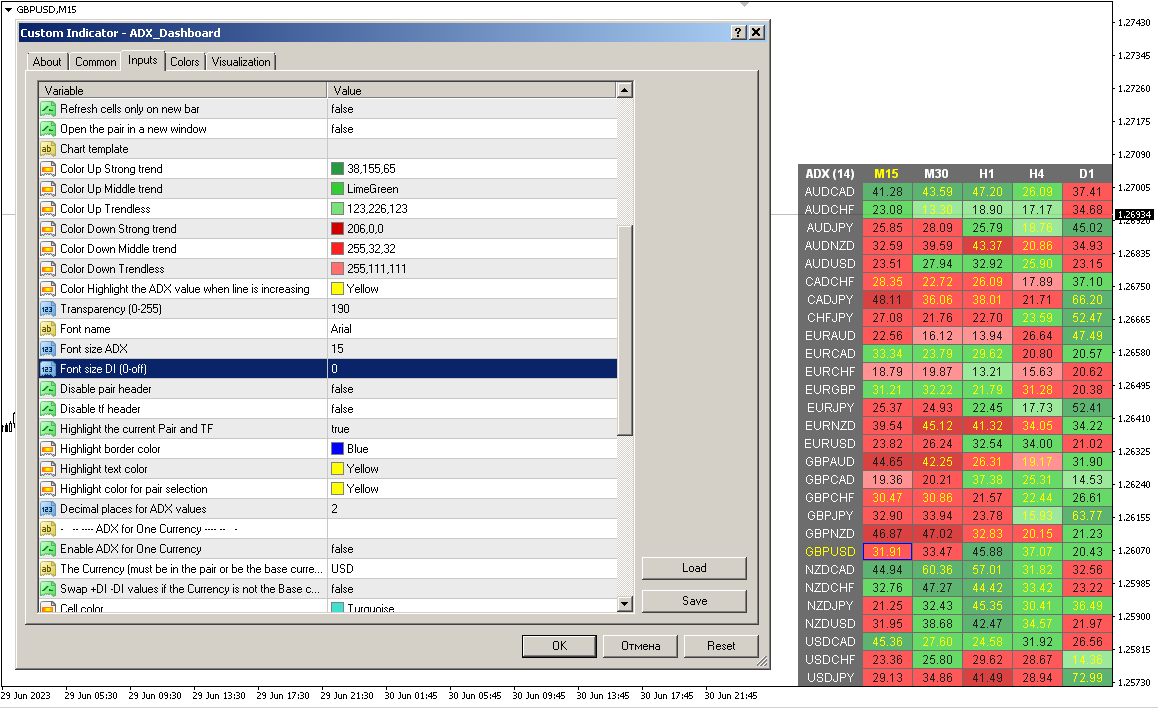
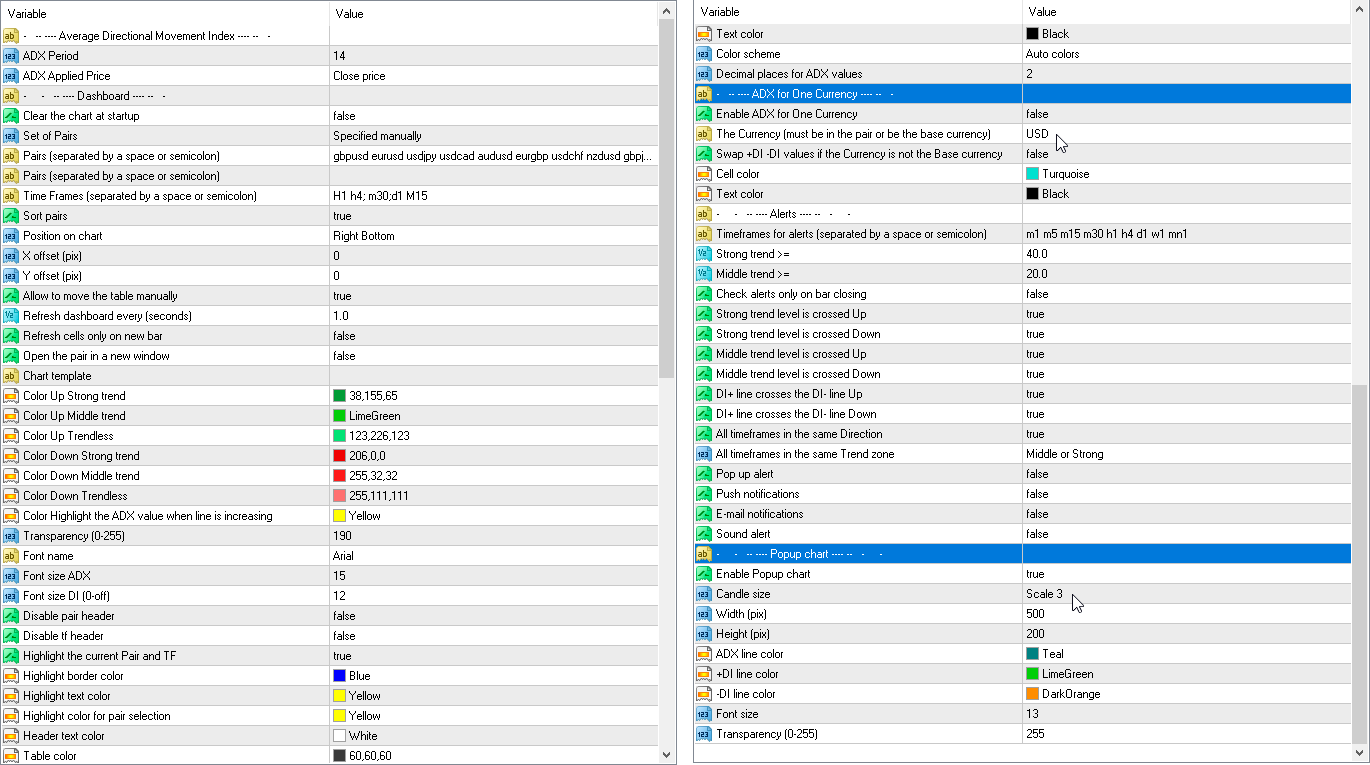
ADX Period — 평균 기간.
ADX Applied Price — 가격 유형.
Clear the chart at startup — 시작 시 차트를 지웁니다
Set of Pairs — 기호 집합:
— Market Watch — MT의 "Market Watch"에서 나온 쌍입니다.— Specified manually — "쌍" 매개변수에서 쌍을 수동으로 지정합니다.— Current pair — 현재 쌍만 표시합니다.
Pairs (separated by a space or semicolon) — 공백이나 세미콜론으로 구분된 기호 목록입니다. 통화 이름은 대소문자와 접두사/접미사를 유지하면서 브로커의 이름과 동일하게 작성해야 합니다.
Time Frames (separated by a space or semicolon) — 공백 또는 세미콜론으로 구분된 기간 목록(다중 기간)
Sort pairs — 쌍 목록을 정렬합니다.
Position on chart — 차트에 패널을 표시하는 모서리입니다.
X offset (pix) — X축을 따라 패널을 이동합니다.
Y offset (pix) — Y축을 따라 패널을 이동합니다.
Allow to move the table manually — 마우스로 테이블 이동을 허용합니다.
Refresh dashboard every (seconds) — 모든 쌍 및 기간에 대한 업데이트 기간입니다.
Refresh cells only on new bar — 셀 업데이트(및 경고)는 새 막대가 나타날 때만 발생합니다.
Open the pair in a new window — 클릭하여 새 차트 창에서 기호를 엽니다.
Chart template — 차트가 새 창에서 열리는 경우 차트 템플릿의 이름입니다.
색상 설정
Color Up Strong trend — 강한 추세가 있는 경우 셀 색상입니다.
Color Up Middle trend — 중간 추세인 경우 셀 색상입니다.
Color Up Trendless — 추세가 없는 경우 셀 색상입니다.
Color Down Strong trend — 강한 추세가 있는 경우 셀 색상입니다.
Color Down Middle trend — 평균 추세인 경우 셀 색상입니다.
Color Down Trendless — 추세가 없는 경우 셀 색상입니다.
Transparency (0-255) — 패널의 투명도입니다.
Font name — 글꼴 이름.
Font size ADX — 글꼴 크기 ADX.
Font size DI (0-off) — 글꼴 크기 DI(0-off).
경고
Timeframes for alerts (separated by a space or semicolon) — 경고가 전송될 기간 목록(공백 또는 세미콜론으로 구분)
Strong trend >= — 강한 추세의 수준
Middle trend >= — 중간 추세 수준입니다.
Check alerts only on bar closing — 바 폐쇄 후에만 수평 교차점을 확인하십시오.
Strong trend level is crossed Up — ADX가 강한 추세 수준을 교차하면 경고됩니다.
Strong trend level is crossed Down — ADX가 강한 추세 아래로 교차할 때 경고합니다.
Middle trend level is crossed Up — 중간 추세 수준이 위쪽으로 교차하면 경고가 발생합니다.
Middle trend level is crossed Down — 중간 추세 수준이 하향 교차되면 경고가 발생합니다.
DI+ line crosses the DI- line Up — DI+가 DI- 위쪽을 교차할 때 경고합니다.
DI+ line crosses the DI- line Down — DI+가 DI- 아래로 교차할 때 경고합니다.
All timeframes in the same direction — 모든 셀이 동일한 방향을 표시하면 경고합니다.
DI+ changes direction — DI+는 방향을 바꿉니다.
DI- changes direction — DI- 방향을 바꿉니다.
DI+ crosses level X (0-off) — DI+는 레벨 X(0-off)를 교차합니다.
DI- crosses level X (0-off) — DI-는 레벨 X(0-off)를 교차합니다.
Pop up alert — 팝업 경고.
Push notifications — 푸시 알림.
E-mail notifications — 이메일 알림.
Sound alert — 소리 경고.
Export Data to CSV fileAllow data export
File name
Separator between columns
Export ADX
Export DI+
Export DI-
팝업 차트
Enable Popup chart — 팝업 차트 활성화
Candle size — 양초 크기
Width (pix) — 너비(픽스)
Height (pix) — 높이(픽스)
Font size — 글꼴 크기
Transparency (0-255) — 투명도(0-255)


Another excellent piece of work from this talented programmer!
A thousand thanks, Taras!