MetaTrader 4용 기술 지표 - 56

This is a simple and efficient indicator based on market logic. The indicator creates a range chosen by a trader. Trader selects only two parameters. The first one is the number of candles that define the frame. The second one is the number of candles needed for confirmation frame. The indicator shows all situations in history and works with the actual movement of the market. The indicator works on all timeframes . You are not limited by use of different timeframes, the indicator is able to adap

Simple and powerful CSM (Currency Strength Meter) Currency strength meter is the indicator you need to identify the current actual trend based on a unique calculation, which is generally used as another fundamental analysis for those who are not capable of reading the fundamental clearly. Currency strength meter will read the current strength of related currency pair (Forex) where generally consist of AUD, NZD, CAD, CHF, JPY, EUR, GBP, and USD for the main major currency.
Feature Easy reading b
The Crossover Alert System is a highly configurable MT4 indicator which incorporates a fully automated alert system for potential trading signals generated by Stochastic Crossovers. The system has the following features: 'Touch' alert option - where the stochastics momentarily touch above or below the trader defined trigger thresholds 'Printed' alert option - where the stochastics have acually formed a crossover in the last chart period. Email alert option Configurable High and Low Trigger Zones
The Moving Average / Price Proximity Alert system is a highly configurable MT4 indicator which incorporates a fully automated alert system for monitoring a trader defined moving average in relation to price action. Automatically receive alerts when price action touches or crosses over a trader defined moving average Push alert capability Email alert options On screen pop up options Configurable alert module
Precision Alert Controls Traders can control: The minimum time between alerts in seconds

The Relative Momentum Index (RMI) was developed by Roger Altman, and introduced in his Feb 1993 article in Technical Analysis of Stocks & Commodities magazine. As its name suggests, Relative Momentum Index adds a momentum component to the traditional RSI, designed to increase reliability by decreasing spurious oscillations between defined overbought and oversold levels. This Relative Momentum Index indicator has 2 components. A change in RMI line color provides a warning signal for an upward or

ReLSOved indicator is primarily directed at traders using trading strategies based on the price action patterns. The indicator knows exactly where the rails go! The "rails" are the five patterns of the famous Price Action strategy - Rails, Outside bar (OVB), Reversal pivot points (PPR), Wide range bar (WRB) and Inside Bar False BreakOut - IB-FB, which is known as Fakey among the fans of Price Action trading. They can be used together or in various combinations (the display of each pattern is cus

The indicator displays Renko bars on the chart, uses their data to calculate and display the moving average, PriceChannel and generates buy/sell signals. Renko is a non-trivial price display method. Instead of displaying each bar within a time interval, only the bars where the price moved a certain number of points are shown. Renko bars do not depend on a time interval, therefore the indicator works on any timeframe without losing its efficiency. The PriceChannel indicator displays the upper, lo

The "Volumes Alert Push Mail" is an indicator for the MetaTrader 4, which is based on the standard Volumes indicator with functions for generating alerts, sending messages to email and mobile terminals.
Advantages of the "Volumes Alert Push Mail" indicator Highly customizable visualization.
Receiving signals in any way possible: emails, push-notifications and alerts.
Free technical support from the developer.
Parameters Volume - indicator value for sending the messages.
Bar - the setting accep
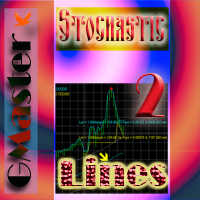
The Greed Master Stochastic 2 Lines indicator uses the Stochastic indicator. And based on the data on intersections with the levels , it plots two High and Low lines according to the rates for the change period of the Stochastic indicator. All parameters are set to default, but they can be adjusted if necessary. Also, the arrows show the High and Low price values for the specified period. If you correctly fill parameters of the account and exchange rate of the currency in the country the indicat

Two Period RSI + Alerts compares long-term and short-term RSI lines, and plots a fill between them for improved visualization. Fill is colored differently according to an uptrend (short period RSI above long period RSI) or a downtrend (short period RSI below long period RSI). Short-term RSI crossing long-term RSI adds a more robust trend confirmation signal than using single period RSI alone. This is a tool to help visualize and confirm RSI trends. We hope you enjoy!
Alerts Email, message, and

SuperTrend Alerts adds alerts to the widely popular SuperTrend indicator. As the name suggests, SuperTrend is a trending indicator which works best in trendy (not choppy) markets. SuperTrend is extremely popular for intraday and daily trading, and can be used on any timeframe. Place a call when the price closes above the SuperTrend line, and place a put when the price closes below the SuperTrend line. These crossovers are highlighted by non-repainting up/down arrows.
Alerts Email, message and s

Professional 0 Lag Moving Averages Indicator MAi Indicator is a complete of moving averages with no lag .
With MAi you can finally trade in real time with no lag, so your trading becomes more precise, realistic and more effectively.
Please see included averages and the combinations with “Hull” equation below in code section.
MAi indicator can run many instances , for all time frames at once, so you can test and compare results with different settings .
It is very fast and has like all our indica

The function of this indicator is to confirm or cancel a possible rupture of a roof or floor. Parameters: The periods serve to make the indicator functions faster or slower. You can modify the periods but the recommended ones are the ones that come by default or is 14-12. PeriodSentry : Number of Bars used for calculations (Recommended value 14). PeriodMedium : Number of average Bars used for calculations (Recommended value 12). BandSup : Superior Band (Recommended value 50). BandInf : Inferior

Professional 0 Lag MAs Trend Sensor Indicator MAtsi is a trend sensor indicator , where 2 MA-s operates simultaneously .
It is designed to cover a wider range of dynamic trends, where MAi is not so effective.
Included averages are described in MAi indicator code section.
MAtsi indicator can run many instances, for all time frames at once, so you can test and compare results with different settings.
It is very fast and has, like all our indicators, a built-in " slider history testing " technolog

Bid Ask Level is a very simple indicator but, at the same time, very powerful . Using the logic of the minimum and maximum of the previous periods is able to intercept the important levels of demand and supply. The indicator permits setting the numbers of history candles to read very important levels in the past and show them in the current chart. You can see these power levels with horizontal lines designed on the chart. The indicator also permits uploading many different levels (of different t

Professional Trend Convergence/Divergence Indicator TCD indicator is based on the Convergence/Divergence of Trend and shows you " up trend " (when trend grows) and " down trend " (when trend is falling).
In the middle is an adjustable "stop area" on which you cannot trade.
Briefly, the TCD shows you when to start or stop buy/sell .
TCD indicator can run many instances, for all time frames and includes all 0 lag MAs . (Please see MAi indicator code section)
With TCD your trading becomes more pre

Indicator for collecting and storing ticks from the real market. Ticks are available in offline mode. The tick chart works like the standard time charts in MetaTrader 4. All indicators work on the tick chart. It is good for finding "pins" and spikes before the news releases. The indicator is good for scalpers and scalper systems. Templates also work. Settings: Period. - number of the period for collecting ticks. Default value is 2. You cannot use the standard minutes 1, 5, 15, 30, 60(hour), 240(

AMD Trend Risk Reward is an indicator which belongs to the group of trend indicators. It provides the possibility to take the correct decisions about timely market entrances or exits. Trend horizontal can cause a lot of headaches to the traders and can be the reason of money loss. By automatic optimizing the settings of our AMD Trend Risk Reward indicator you can avoid most of them and save your money. How to choose the best chart? Press the button [O] on the chart. Indicator automatically optim

The indicator determines the inside bar and marks its High/Low. It is plotted based on the closed candles (does not redraw). The identified inside bar can be displayed on the smaller periods. You may set a higher period (to search for the inside bar) and analyze on a smaller one. Also you can see the levels for Mother bar.
Indicator Parameters Period to find Inside Bar — the period to search for the inside bar. If a specific period is set, the search will be performed in that period Type of ind
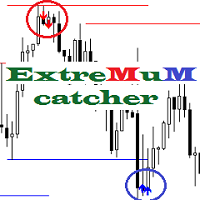
The Extremum catcher indicator analyzes the price action after breaking the local Highs and Lows, generates price reversal signals with the ability to plot the Price Channel. If you need the version for MetaTrader 5, see Extremum catcher MT5 . The indicator takes the High and Low of the price over the specified period - 24 bars by default (can be changed). Then, if on the previous candle the price broke the High or Low level and the new candle opened higher than the extremums, then a signal will

Professional Trend Indicator Ti indicator is based on its own oscillator and shows you trend changes .
Indicator includes adjustable Polynomial and MAs channels , Trend lines and Oscillator filter with whom you can adjust the spread of indicator.
You can run many instances, for all time frames at once, is very fast and has a built-in " slider history testing " technology and “ Error control ”.
Program operates in 2 automatic modes:
1. Slider mode
Turns on when attaching the indicator to the Cha

True Choppiness Direction determines if the market is choppy (trading sideways) or if it is trending, as well as the trend direction and strength (green=up, red=down, grey=no trend) . The underlying algorithm is designed to detect trend movements even in the presence of noisy market data, please see screenshots. Trend strength is indicated by taller or shorter red/green fill. Choppiness index is range-bound between -50 (very trendy) and +50 (very choppy). This is a custom algorithm designed by u
The indicator determines and plots price channels or lines, reading information from multiple timeframes (from current, second and third) simultaneously. Color and width of lines for each timeframe can be customized. It is also possible to set different distance between the Highs and Lows for plotting channels or lines.
Parameters History - maximum number of bars to plot channels or lines; Distance - minimum distance from one High (or Low) to another when plotting lines; Shift - shift for sever

FletBoxPush 표시기는 지정된 매개 변수에 따라 가격 변동의 평평한 영역을 결정합니다. 설정:
TimeFrames - 차트 기간 선택. FlatPips - 플랫을 결정하기 위한 포인트 제한 FlatBars - 플랫을 결정하기 위한 막대 수의 제한 CountBars - 가격 움직임을 분석하기 위한 기록의 막대 수, 0에서 기록의 모든 막대가 분석됩니다. 색상 - 플랫으로 정의된 가격대의 색상 PriceTag - 가격 라벨 추가 도면 경고 - 사용자 데이터가 포함된 대화 상자 표시 텍스트 - 경고에 대한 사용자 정의 텍스트 Send_Mail - "메일" 탭의 설정 창에 지정된 주소로 이메일을 보냅니다. 제목 - 이메일 헤더 Send_Notification - "알림" 탭의 설정 창에서 MetaQuotes ID가 지정된 모바일 터미널에 알림을 보냅니다.

RFX Market Speed is an indicator designed to measure a new dimension of the market which has been hidden from the most traders. The indicator measures the speed of the market in terms of points per second and shows the measurements graphically on the chart, and saves the maximum bullish and bearish speeds per each bar. This indicator is specially designed to help the scalpers of any market with their decisions about the short bias of the market. Note: The indicator uses real-ticks and CANNOT be

Super sniper is the indicator that you're looking for This indicator has an active signal that also able to send push notification to your mobile MetaTrader 4 (see the screenshot for tutorial), so you won't miss any signal during active market. The signal is very simple, " down arrow " for sell and " up arrow " for buy. There are several options as below _SEND_NOTIF_TO_MOBILE: to enable push notification to your mobile MetaTrader for signal _ALERT_SIGNAL: to enable alert signal _SHOW_EMA_TREND:
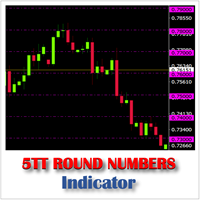
Like Support and Resistance levels, Round Numbers refer to price levels ending in one or more zeros, such as 125.00, 1.0350, 0.8750, 74.50, etc. These are psychological levels where financial institutions and traders expect price to either stall, retrace or breakthrough. On a price chart these figures are generally considered to rule off levels at the 50 and 100 mark. 5TT Round Numbers Indicator makes it absolutely easy for the trader to identify these levels on the chart without the laborious a

"The VIX Fix is a powerful indicator that detects market bottoms for any asset " The VIX (volatility index) is a ticker symbol of implied volatility of the S&P 500, calculated by the Chicago Board Options Exchange. VIX is a popular measure of market risk, and is one of the best measures of market bottoms that currently exists. Unfortunately, it only exists for the S&P 500... The VIX Fix was published by Larry Williams in 2007, and it synthesizes a VIX volatility index for any asset (not just the
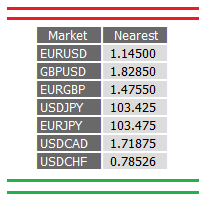
Price level alert is a software that gives you an overview of your all drawn levels (supports and resistances) for more than 10 markets in only one elegant table which you can see right in your chart. Price alert is not only this, it also sends you notification (alert) when a market has reached one of your predefined levels. Therefore, this is a must-have tool for all traders who want to cut the time sitting in front of a computer significantly and not to miss any trade.
Settings (inputs) Symbo

WaveTrend Momentum Oscillator is an upgrade to the popular and easy-to-use WaveTrend Oscillator. The WaveTrend Momentum Oscillator adds a momentum component to the original WaveTrend calculation, in order to provide faster and more accurate entry points during trendy market conditions. Do you prefer the original WaveTrend Oscillator? The WaveTrend Momentum Oscillator allows you to switch between momentum and original WT versions. Both provide valuable information depending on the market conditio

The main objective of the indicator is an accurate forecast of short-term trends. A rising channel is usually broken downwards and replaced with a falling one when confirmed by tick volumes, while a falling one is usually broken upwards and replaced with a rising one again when confirmed by tick volumes. Sometimes, upward and downward channels are replaced with flats. A channel width and duration are defined by the market situation and market phase (bullish or bearish). In our case, tick volumes
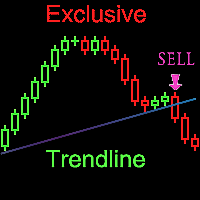
Every experienced trader knows that the trend lines should be paid attention in Forex trading. But plotting trend lines takes time, and there can be many of them on the chart as well... Yikes!!! Do you want to know how to easily and simply automate this process? Then read on. There is a solution - a smart and reliable indicator of trend lines - the Exclusive Trendline . All you need to do is attach the indicator to the chart, and it will draw all possible trend lines for you. You just have to ad

Professional Prediction Indicator Based on matching the history with selected pattern model and shows the most likely outcome.
Pi indicator includes Pattern line, Scanned_Past line, Matching_Pattern line, Future_Predicted line, adjustable Model Band , and some other controls.
This indicator is designed primarily for professional use and is very useful in the search for the probability of the results relating to the future.
Note : The results depend on model_band and past_bars . They are approxim

A ready-made trading system based on automatic construction and maintenance of Fibonacci levels for buying and selling on any instrument (symbol) and on any period of the chart. Determination of trend direction (14 indicators). The display of the trend strength and the values of the indicators that make up the direction of the trend. Construction of horizontal levels, support and resistance lines, channels. Choosing a variant for calculating Fibonacci levels (six different methods). Alert system

This indicator marks the long or short force of each candle. Green = long. Red = Short
Parameters: The periods serve to make the indicator functions faster or slower. We recommend to run faster periods 4-10 or slower periods 12-26. PeriodFast : Numbers of Bars used for the calculations of fast period (Recommended value 4) PeriodSlow : Numbers of Bars used for the calculations of slow period (Recommended value 10)

The function of this indicator is to indicate to us the degree of volatility that is having a specific section. As long as the volatility line does not cross with its mean it is indicative that the volatility continues, and as long as the price does not reverse the continuation should be guaranteed. The crossing below its average would indicate exhaustion or end of said section.
Parameters: The periods serve to make the indicator functions faster or slower. You can modify the periods but the re
The EW oscillator is an indicator for the MetaTrader 4 based on mathematical calculations on the price chart.
Distinctive features Generates minimum false signals. Excellent for identifying trend reversals. Perfect for scalping. Simple and easy indicator configuration. Suitable for working on the smaller timeframes (up to H4). Works on any financial instrument.
Recommended symbols EURUSD, EURGBP, USDCHF, AUDNZD, AUDCAD, GOLD.
Recommendations on usage The buy signal is formed when the level 20
This is the famous FX Sniper's T3 CCI indicator. It is a fixed version additionally containing search for classical and reverse (hidden) divergence. The classical divergence is displayed as a solid line, the reverse divergence is shown as a dotted line. Divergences are drawn in the indicator and on the chart (if you select the appropriate options).
Parameters
CCI Period — Commodity Channel Index indicator period CCI Type of price — price used for indicator calculation T3 Period — Sniper period
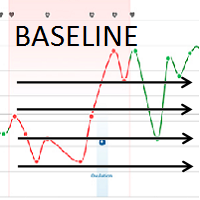
The Baseline Balance tool shows multiple pivot lines for short, mid and long time market cycles. Thus trader can easy identify local or global S/R (support/resistance) levels for better timing of investments and entries to the market. Due to the multifunctional menu directly on chart the settings is fast and accurate. Pivot lines are generated for H1, H4, Daily, Weekly, Monthly, Yearly timeshares. Menu on chart shows following settings: Line Display Settings Middle_Lines – shows middle calculati

Femade Indie Vs 1.0 is a simple but multi-currency monitoring Indicator created to instantly notify the trader when an attached currency pair is ready to buy, sell or give signal when such currency pair is getting ready for a big move either up or down. It does this by visual aids on the screen charts, sound and pop-up alerts. If it shows " Medium ", this means that the so called currency signal is almost gone but can still be traded provided the trader will not need a lot of pips which can be b

The indicator displays Renko bars on the chart, uses their data to calculate and display the Bollinger Bands, MACD oscillator and generates buy/sell signals. Renko is a non-trivial price display method, in which a bar within a time interval is shown on the chart only if the price has moved a certain number of points. Renko bars do not depend on a time interval, therefore the indicator works on any timeframe without losing its efficiency. When attached to a chart, the indicator checks for presenc

BarKhan BarKhan - 지표는 세 가지 디지털 이동 평균의 차이의 합으로 계산됩니다. 계산식은 다음과 같습니다. 디지털 이동 평균 #1과 #2의 차이는 디지털 이동 평균 #2와 #3의 차이로 합산됩니다. 표시기 설정 설명: MA_Period1 - 첫 번째 디지털 이동 평균의 기간 MA_Period2 - 두 번째 디지털 이동 평균의 기간 MA_Period3 - 세 번째 디지털 이동 평균의 기간 BarKhan - 지표는 세 가지 디지털 이동 평균의 차이의 합으로 계산됩니다. 계산식은 다음과 같습니다. 디지털 이동 평균 #1과 #2의 차이는 디지털 이동 평균 #2와 #3의 차이로 합산됩니다. 표시기 설정 설명: MA_Period1 - 첫 번째 디지털 이동 평균의 기간 MA_Period2 - 두 번째 디지털 이동 평균의 기간 MA_Period3 - 세 번째 디지털 이동 평균의 기간

The indicator displays Renko bars on the chart, plots a channel based on that data and generates buy/sell signals. Renko is a non-trivial price display method, in which a bar within a time interval is shown on the chart only if the price has moved a certain number of points. Renko bars do not depend on a time interval, therefore the indicator works on any timeframe without losing its efficiency. The channel is defined as the upper and lower boundaries of the price movement over the specified per
This is a colored multi-timeframe liner regression indicator. It is used for the analysis of price movements and market mood. The market mood is judged by the slope of the linear regression and price being below or above this line.
Purpose The indicator can be used for manual or automated trading within an Expert Advisor. Values of indicator buffer of the double type can be used for automated trading: Regression line of M1 period - buffer 0. Regression line of M5 period - buffer 1. Regression l
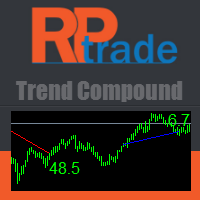
Trend Compound is a trend indicator using a mix of 3 internal other indicators. Please have a look at "how to test in the tester" at the bottom of this page before to test. It's designed to be used by anyone, even the complete newbie in trading can use it. Trend Compound does not repaint . Indications are given from close to close. Trend Compound can be used alone , no other indicators are required.
Trend Compound indicates Where to open your trades. When to close them. The potential quantity o

Risk Reward indicator is a very useful tool that allows you to observe in real time the performance risk of a trade. Its use is very simple, just drag it into the chart and see the Risk Reward percentage (for ex: 1:2). We have also included the possibility of extending/reducing the lines in order to observe the important price levels. You can change your levels clicking directly on lines and dragging the level to a new position. The levels will be set very fast with only a click. The indicator k
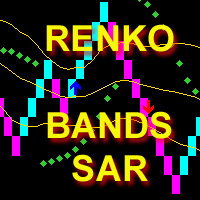
The indicator calculates and displays Renko bars using Bollinger Bands and Parabolic SAR data as well as provides buy/sell signals. Renko is a non-trivial price display method. Instead of displaying each bar within a time interval, only the bars where the price moved a certain number of points are shown. Renko bars do not depend on a time interval, therefore the indicator works on any timeframe without losing its efficiency. The buy signal is generated when the average line of Bands is directed

The indicator can help traders to assess in advance the number of Lots, Balance and Equity, if the price deviates from the current levels. The indicator will be useful for those who trade using grid strategies or Martingale.
Features The indicator belongs to the category of risk management . It will be useful for the traders who usually have a lot of open orders on one instrument. The indicator helps to assess in advance the account change that would happen in case of possible price change from

The Averaging indicator is designed for traders who trade using averaging techniques or from time to time need to exit a floating loss resulting from erroneous trades by averaging trade results. Averaging of results means closing trades by TakeProfit calculated by the indicator. The indicator takes into account the volume of opened positions! When the number or volume of trades is increased or reduced, the TakeProfit level is automatically recalculated! The recommended TakeProfit level is displa

The Open Line indicator is a simple indicator that tracks the opening levels of more time sessions. This version allows the user to check the opening levels using different time time frames. It is possible to add on the same chart different Open Lines to have more important horizontal levels. The colors and lines are fully customizable also for the label text. A simple indicator but very powerful to give you a proper orientation for your trading.
Input Values TimeFrame (to show the open price t
Market Hour Indicator is one the most useful indicators for the traders who trade in different markets. The indicator highlights the area in the chart during which a particular market is open. It operates on four different markets i.e. New York Stock Exchange, Australian Stock Exchange, Tokyo Stock Exchange and London Stock Exchange. The indicator is intended for use on M1, M5, M15, M30 and H1 time frames only.
Input Parameters NYSEMarket: Enable/Disable for NYSE market NYSEMarketOpeningTime: S
This is the linear regression indicator for basic indicators included in the standard package of the MetaTrader 4 terminal. It is used for the analysis of price movements and market mood. The market mood is judged by the slope of the linear regression and price being below or above this line. Regression line breakthrough by the indicator line may serve as a market entry signal. There is possibility of setting the color for bullish and bearish sentiments of the basic indicators as well as plottin
Octet 표시기는 다중 통화이며 동시에 56개 통화 쌍을 분석합니다. 모든 통화 쌍이 시장 개요에 있고 호가가 로드되는 것이 중요합니다. 지표는 총 7개의 다른 통화에 대한 특정 통화의 상승 또는 하락을 라인 형태로 보여줍니다. 지표 값은 백분율로 표시됩니다.
표시기 설정 설명 Type_Calculation - 통화의 성장 또는 하락 비율을 계산하는 세 가지 옵션 접두사 - 통화 쌍 지정에 접두사가 있을 때 사용됩니다(예: EURUSD.fxp, 접두사 = .fxp 설정). Show_AUD - 다른 7개 통화를 기준으로 AUD 통화에 대해 계산된 총 값을 표시합니다. Show_EUR - 다른 7개 통화를 기준으로 EUR 통화에 대해 계산된 총 값을 표시합니다. Show_GBP - 다른 7개 통화를 기준으로 GBP 통화에 대해 계산된 총 값을 표시합니다. Show_NZD - 다른 7개 통화를 기준으로 NZD 통화에 대해 계산된 총 값을 표시합니다. Show_CAD - 다른 7개

Strong Weak 다중 통화 표시기는 56개의 통화 쌍을 동시에 분석합니다.
AUD EUR GBP NZD CAD CHF JPY USD AUD SUMM EURAUD GBPAUD AUDNZD AUDCAD AUDCHF AUDJPY AUDUSD EUR EURAUD SUMM EURGBP EURNZD EURCAD EURCHF EURJPY EURUSD GBP GBPAUD EURGBP SUMM GBPNZD GBPCAD GBPCHF GBPJPY GBPUSD NZD AUDNZD EURNZD GBPNZD SUMM NZDCAD NZDCHF NZDJPY NZDUSD CAD AUDCAD EURCAD GBPCAD NZDCAD SUMM CADCHF CADJPY USDCAD CHF AUDCHF EURCHF GBPCHF NZDCHF CADCHF SUMM CHFJPY USDCHF JPY AUDJPY EURJPY GBPJPY NZDJPY CADJPY CHFJPY SUMM USDJPY USD AUDUSD EUR

The Hedging indicator is a trading tool, allowing to exit a floating loss that results from erroneous trades by using hedging of trade results. This tool also allows you to solve the problem of negative locking. Hedging of trade results means their simultaneous closing TakeProfit and Stop Loss calculated by the indicator. The indicator takes into account the volume of opened positions! When the number or volume of trades is increased or reduced, the TakeProfit and StopLoss levels are automatical

Eldorado MT4 is a new MetaTrader 4 indicator based on a digital filter, it has been developed by a professional trader. By purchasing this indicator, you will receive: Excellent indicator signals! Free product support. Regular updates. You can use it on any financial instrument (Forex, CFD, options) and timeframe. Simple indicator setup, minimum parameters. Signals for Position Opening: Open Buy when the channel goes up. Open Sell when the channel goes down. Recommended Usage It is recommended t

Colored indicator of the linear channel based on the Fibonacci sequence. It is used for making trading decisions and analyzing market sentiment. The channel boundaries represent strong support/resistance levels, as they are the Fibonacci proportion levels. Users can select the number of displayed lines of channel boundaries on the chart by means of the input parameters. Attaching multiple instances of the indicator to the chart with different calculation periods leads to displaying a system of c

AIS 올바른 평균 표시기를 사용하면 시장에서 추세 움직임의 시작을 설정할 수 있습니다. 지표의 또 다른 중요한 품질은 추세의 끝을 알리는 명확한 신호입니다. 표시기는 다시 그리거나 다시 계산되지 않습니다.
표시된 값 h_AE - AE 채널의 상한
l_AE - AE 채널의 하한
h_EC - 현재 막대에 대한 높은 예측 값
l_EC - 현재 막대에 대한 낮은 예측 값
표시기로 작업할 때의 신호 주 신호는 채널 AE와 EC의 교차점입니다.
l_EC선이 h_AE선 위에 있을 때 상승세가 시작될 수 있습니다.
하락추세의 시작은 h_EC선이 l_AE선 아래로 떨어지면서 예상할 수 있습니다.
이 경우 h_AE와 l_AE 라인 사이의 채널 너비에 주의해야 합니다. 그들 사이의 차이가 클수록 추세는 더 강해질 것입니다. 또한 AE 채널에 의한 로컬 고/저 달성에 주의를 기울여야 합니다. 이때 가격변동의 경향이 가장 강해진다.
사용자 지정 가능한 지표 매개변수 표시기 설정은 시간
Colored indicator of the linear channel. Plotting and calculation is based on the Keltner method. It is used for making trading decisions and analyzing market sentiment. The input parameters provide the ability to adjust the channel on the chart. Attaching multiple instances of the indicator to the chart with different calculation periods leads to displaying a system of channels on the chart. Various options for plotting the channel are shown in the screenshots.
Purpose The indicator can be use

Price Pressure indicator is capable to determine the total result of buy/sell pressure. The result is given in Average True Range (ATR) percent. Price Pressure analyze price action determining how much pressure is present for each candle. Buying or Selling pressure is cumulative, and the more bear/bull bodies and the larger the bodies, the more likely it is that the pressure will reach a critical point and overwhelm the bulls/bears and drive the market down/up. Strong bulls create buying pressur
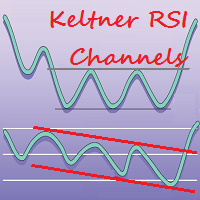
This is a color indicator of linear channel for RSI. The indicator and its calculations are based on Keltner's methodology. It is used for making trading decisions and analyzing market sentiment. Input parameters allow the user to customize the channel/channels. The indicator allows drawing two channels on a single chart of the RSI indicator. Possible options for channel drawing are shown in the screenshots.
Purpose The indicator can be used for manual or automated trading within an Expert Advi

Hi Traders, This useful product will Helps you to get 28 currencies power meter as indicator buffers for use in Expert Advisors and other Indicators . You can get them as buffers 0-27 for current candle. Buffers Value - This values are between -100 to +100 ("-" for Bearish Trend, "+" for Bullish Tread), For Ex. if EURUSD's Buffer is +37 it means it is in a bullish trend and bigger values is better for us. Time Frames - In all time frames you will get same values for each buffer (thy are not depe
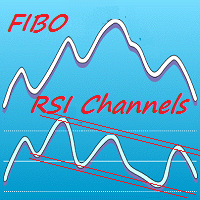
Colored indicator of the linear channels based on the Fibonacci sequence for the RSI. It is used for making trading decisions and analyzing market sentiment. The channel/channels boundaries represent strong support/resistance levels, as they are the Fibonacci proportion levels. Users can select the number of displayed lines of channel boundaries on the chart by means of the input parameters. Various options for using the indicator are shown in the screenshots. The middle of the channel is shown
Bollinger Bands (BB) + Relative Strength Index (RSI) + Alert
Many traders are interested in the Reversal Strategy. The indicators Bollinger Bands (BB) and the Relative Strength Index (RSI) are suitable for this strategy. The indicator offered here combines Bollinger Bands (BB) and the Relative Strength Index (RSI) to get pop-up and sound alerts. This supports you especially when trading multiple currency pairs. For this strategy a periodicity of for example >30 minutes could be appropriate.
T
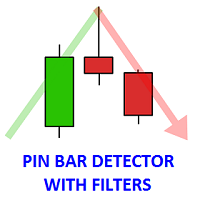
The indicator finds the Pin bars on the chart, perhaps, the most powerful Price Action pattern. The indicator has additional filters, and the user can: specify all parameters of the pin bar size as a percentage of the total candle size (minimum length of the large wick, maximum values of the short wick and body size). set the number of fractals for the last N bars, the Pin bar is based on, i.e. define the support/resistance levels. specify the required number of bearish/bullish bars before the P
Stochastic is the indicator used by traders the most. This version allows to extract the maximum amount of information without hassle of constantly switching between the timeframes and, thereby, greatly simplifies working with it. This is a standard Stochastic oscillator provided with an info panel displaying the current relative position of %K and %D lines on all timeframes. The info panel is intuitive and easy to use. The oscillator is especially useful in scalping techniques when you need to

The List swap is an indicator for the MetaTrader 4 platform, which allows to display swaps for all symbols (available in the Market Watch). When using the free demo version, you need to remember that the Strategy Tester of the MetaTrader 4 does not provide the ability to obtain data on other symbols. In the Strategy Tester, the swap information will be displayed only for the symbol the indicator is attached to. The indicator can be useful for traders utilizing the "Carry trade" strategy, as well
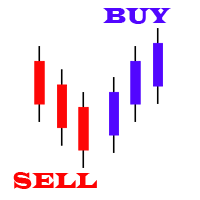
Price action is among the most popular trading concepts. Candlestick patterns are essential tools for every price action trader. A candlestick pattern is a one or sometimes multi-bar price action pattern shown graphically on a candlestick chart that price action traders use to predict.
Input Parameters On Alert - true/false (displays a message in a separate window). Patterns Reverse - true/false (allow displaying the backward candle patterns). Max Bar - numbers of bars.
Parameters in chart Can
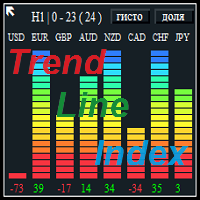
The Trend Line Index is a multi-currency indicator that shows the strength of a currency at the moment or for any period of history data.
Description of strategy and operation principle The indicator constantly analyzes 8 currencies or the ones that make up the 28 currency pairs . In the settings you can choose the period to analyze the movement you are interested in. To do this, select the timeframe, the number of the analyzed bars in the settings, as well as the number of the bar to start the

The indicator calculates and displays Renko bars using PSAR and CCI data as well as provides buy/sell signals. Renko is a non-trivial price display method. Instead of displaying each bar within a time interval, only the bars where the price moved a certain number of points are shown. Renko bars do not depend on a time interval, therefore the indicator works on any timeframe without losing its efficiency. The buy signal is generated when the CCI indicator crosses the 100 level upwards, and the PS
MetaTrader 플랫폼 어플리케이션 스토어에서 MetaTrader 마켓에서 트레이딩 로봇을 구매하는 방법에 대해 알아 보십시오.
MQL5.community 결제 시스템은 페이팔, 은행 카드 및 인기 결제 시스템을 통한 거래를 지원합니다. 더 나은 고객 경험을 위해 구입하시기 전에 거래 로봇을 테스트하시는 것을 권장합니다.
트레이딩 기회를 놓치고 있어요:
- 무료 트레이딩 앱
- 복사용 8,000 이상의 시그널
- 금융 시장 개척을 위한 경제 뉴스
등록
로그인
계정이 없으시면, 가입하십시오
MQL5.com 웹사이트에 로그인을 하기 위해 쿠키를 허용하십시오.
브라우저에서 필요한 설정을 활성화하시지 않으면, 로그인할 수 없습니다.