MetaTrader 4용 기술 지표 - 24
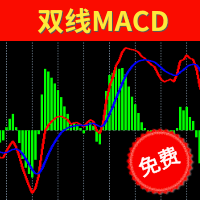
Two Lines MACD Many people who conduct technical transactions on MT4 like to use MACD to judge the turning or continuation of the market. When everyone uses the MACD indicator that comes with MT4, they find that the indicator is a single-line MACD, and the histogram seems to be similar to the past. The MACD that I understand does not match. In order to provide traders with a perfect trading experience, we especially provides free two-line MACD indicators for all traders! The single line in the
FREE

IceFX Heatmap is a special indicator that shows the places where the price has been staying and ranging over the past few days. These sites will be displayed in a "Heatmap style", with which you can clearly see the main formed bands. The main rates (where the price has "lingered/stayed" much) are indicated in bright colors (in case of black-and-white view) or red color (in case of color view).
Settings Days - the number of days the heat(map) is calculated for. Resolution - resolution rate. 10 =
FREE

RSI Signal Scanner The primary trend of the stock or asset is an important tool in making sure the indicator's readings are properly understood. For example, some of the technical analysts, have promoted the idea that an oversold reading on the RSI in an uptrend is likely much higher than 30%, and an overbought reading on the RSI during a downtrend is much lower than the 70% level. This indicator notifies you of RSI important levels breakouts (30% and 70%) by searching among the symbols and chec
FREE

Stochastic with Trend Filter: Precision Signals This is a powerful and easy-to-use indicator designed for traders who want more reliable signals from the classic Stochastic oscillator. How It Works: This indicator improves on the standard Stochastic by adding a powerful trend filter. It uses an Exponential Moving Average (EMA) to determine the overall direction of the market. The indicator will only generate a "buy" signal when both the Stochastic crossover is bullish and the price is above the
FREE
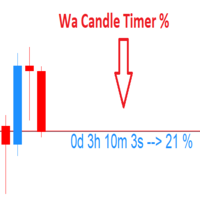
Wa Candle Timer Percentage MT4 is an indicator which shows the user how much time is remaining until the next candle will form. The percentage of the evolution of the current candle is also displayed. The user can set the percentage that the candle timer will change the color. These are the settings: 1- The percentage that the candle timer will change the color. 2- Color of Candle Timer when it's BELOW the percentage set by the user. 3- Color of Candle Timer when it's ABOVE the percentage set b
FREE
Highly configurable Trader Dynamic Index (TDI) indicator.
Features: Highly customizable alert functions (at levels, crosses, direction changes via email, push, sound, popup) Multi timeframe ability (higher and lower timeframes also) Color customization (at levels, crosses, direction changes) Linear interpolation and histogram mode options Works on strategy tester in multi timeframe mode (at weekend without ticks also) Adjustable Levels Parameters:
TDI Timeframe: You can set the lower/higher ti
FREE

FUNDING DEVIL INDICATOR has been developed by traders for traders and is not another combination out of existing indicators or a "magic, solve all situations" tool.
PASS THE FUNDED ACCOUNTS WITH IT.
It is the answer for beginners and experienced traders about the misleading concepts of the mainstream, causing 90% of retail traders, never making a living out of trading.
Successful traders are "following the smart money" and do NOT try to catch every move from start to end. Consistent traders
FREE

Advanced ideas of the popular MACD indicator: It detects and displays classic and reverse divergences (three methods of detecting divergences). It uses different color to highlight an uptrend and a downtrend. Two methods of determining a trend: а) MACD crosses the 0 level (classic signal); б) MACD crosses its own average (early signal). This is a multi-timeframe indicator: it can display MACD data from other timeframes. Two methods of drawing: classic histogram and line. It generates sound and v

Volatility Limit Trend Indicator (VLT), an original indicator by this developer, is a trend indicator based on setting a fixed volatility limit as a percentage of price. Volatile price is allowed to wander between two channel lines defining the fixed volatility about a central line. The price crossing one of the channel lines defines an exceeding of the allowed volatility, and ushering in one of two situation : either a continuation or a reversal of trend. The first buffer of the indicator (not
FREE

Trend Reversal pro is a histogram type indicator that give long and short signals, the indicator can be traded on its own with following entry rules . Buy Rule, histogram gives green bar. Sell Rule, histogram gives red bar. This indicator doesn't repaint or back paint, this indicator signals are not delayed. -------------------------------------------------------
FREE

Latest Changes in 1.6 : Added Signal Modes input. Mode 1 : HPF positive go long blue, HPF negative go short red. Mode 2 : slow envelope only, HPF above upper envelope go long blue, HPF below lower envelope go short red. Mode 3 : HPF above both upper envelopes - go long blue, HPF below both lower envelopes go short red. Mode 4 : Go long blue if HPF crosses above upper slow, but fast upper should be below slow upper at the time, exit when HPF crosses below upper fast, reverse logic for short red
FREE
Range-Bound & Reversal Strategies Dashboard (MT4) Trade clean reversals with confidence.
This MT4 indicator scans 20 major instruments in real time and pinpoints high-probability range and mean-reversion opportunities—then lays everything out in a simple, professional dashboard. Why traders love it 10 Proven Setups in One Tool
Support/Resistance bounce, Bollinger mean reversion, RSI OB/OS, MACD turn, Stochastic OB/OS, CCI extremes, Daily Pivot S/R, Keltner touch, Donchian extremes, and Envelop
추세 상관 강도 (TCS) 지표: 외환 추세 분석의 우위 추세 상관 강도 (TCS) 지표 는 추세 강도를 측정하는 방식을 재정의하는 최첨단 도구로, 평균 방향 지수(ADX)와 같은 기존 지표에 비해 상당한 이점을 제공합니다. 방향성 움직임에 의존하는 ADX와 달리, TCS는 종가와 선형 시계열 간의 상관 관계 를 계산하여 추세 강도를 독특하게 정량화합니다. 이 혁신적인 접근 방식은 외환 트레이더에게 강력한 추세를 식별하고 활용하기 위한 매우 정밀한 방법을 제공합니다. TCS를 선택하는 이유? 추세를 일찍 포착하고 핍을 극대화하세요: TCS는 단순히 반응하는 것이 아니라 예측합니다. 시간이 지남에 따라 가격이 얼마나 선형적으로 움직이는지 측정하여 놀라운 정확도로 새로운 추세를 식별하는 데 도움이 됩니다. 주간 차트에서 TCS 값이 45 이상으로 상승하는 것 은 중요한 시장 움직임이 진행 중이라는 강력한 신호입니다. 기존 전략에 TCS를 통합하여 더 일찍 거래에 진입하고 더 많은 핍을
FREE

For traders, monitoring price movements is a constant activity, because each price movement determines the action that must be taken next. This simple indicator will helps traders to display prices more clearly in a larger size. Users can set the font size and choose the color that will be displayed on the chart. There are three color options that can be selected to be displayed on the chart.
FREE

Indotrend is a Smart indicator to detects the Trend and also view support & resistance, multiple timeframe to get validate the trend. it can be use for Forex,Index,Metal,Stock and Crypto. Parameters: Alerts - show popup alert message on Metatrader Hi Lo H1 Timeframe - Show LIne Hi/Low Price base on H1 timeframe Show Fibonaci level - Show Fibonaci retracement level
Show Support Resistance, - Show Support & Resistance H1 timeframe.
FREE
Pip Movement Alert MT4로 시장 모멘텀을 앞서 나가세요. 이 다목적 다중 통화 인디케이터는 여러 심볼에서 정확한 핍 움직임을 추적하고 트레이더에게 알리기 위해 설계되었으며, 외환, 주식, 암호화폐, 상품 거래에 이상적입니다. Forex Factory와 Reddit의 r/Forex와 같은 거래 커뮤니티에서 찬사를 받고 있으며, Investopedia와 TradingView의 논의에서도 갑작스러운 시장 변화를 감지하는 능력으로 주목받고 있어, 빠른 가격 움직임을 활용하려는 트레이더에게 필수적인 도구입니다. 사용자들은 핍 기반의 중요한 움직임(예: 10핍 단위)을 최대 95%의 신뢰도로 식별하며, 실시간 알림을 활용하여 변동성 급등을 포착함으로써 거래 타이밍이 20-30% 개선되었다고 보고합니다. 주요 이점에는 다중 통화 모니터링, 사용자 정의 가능한 핍 임계값, 지속적인 차트 분석 없이 추적을 단순화하는 경량 디자인이 포함되어 스캘퍼, 데이 트레이더, 스윙 트레이더에게
FREE

Features:
This is a slope indicator for TMA Bands indicator. It calculates slope of the center line. It supports 3 types of TMA Bands: TMA True (Non-repaint) Fast Line TMA (Repaints) TMA+CG (Repaints) It will help you determine whether price is Trending or Ranging based on the Threshold you set. Download extra TMA Indicators for strategy here: https://www.mql5.com/en/blogs/post/758718
How It Works: You can set the Slope Threshold for indicating Buy/Sell heightened levels. Suppose we set Thresh
FREE

Get ready to transform your trading with Absolute Edge Reversal ! This smart indicator is your new secret weapon for spotting high-probability entry and exit points right on your chart. Forget complex, cluttered analysis—we cut straight to the signal so you can act fast and trade with confidence. Why You Need Absolute Edge Reversal Absolute Edge Reversal isn't just another signal line; it's a dynamic momentum system designed for precision. It combines multiple strength calculations with trend f
FREE

Trend Alchemist: Turn Market Chaos into Trading Gold! Are you tired of conflicting signals and getting caught on the wrong side of the trend? The Trend Alchemist indicator cuts through the noise to give you clear, high-probability entry and exit points. This powerful system combines the reliable trend filtering of Multiple Exponential Moving Averages (EMAs) with the precise timing of the Stochastic Oscillator . It doesn't just show you the trend; it confirms the market alignment and pinpoints t
FREE

MACD is well known indicator that still can be use for prediction where price will go next few minutes, hours or even weekly With colored bar of Macd, your eyes can easily catch when color is changed based what market price movement to find any early trend on market. here is the parameter of the indicator: TF_MACD , default is 1 Hour , this mean you can see clearly MACD of 1 Hour TimeFrame on Lower TimeFrame. InpPrice , default is Price Close , this is original MACD parameter from Metaquotes st
FREE

Transform your trading approach with reliable bullish and bearish patterns This indicator evaluates volatility and price directionality simultaneously, which finds the following events. Decisive and sudden price movements Large hammers/shooting stars patterns Strong breakouts backed by most market participants Indecisive but volatile market situations It is an extremely easy to use indicator... The blue histogram represents the bullish impulse The red histogram represents the bearish impulse The
FREE

The purpose of this new version of the MT4 standard indicator provided in your platform is to display in a sub-window multiple timeframes of the same indicator. See the example shown in the picture below. But the display isn’t like a simple MTF indicator. This is the real display of the indicator on its timeframe. Here's the options available in the FFx indicator: Select the timeframes to be displayed (M1 to Monthly) Define the width (number of bars) for each timeframe box Alert pop up/sound/ema
FREE

The Fibonacci indicator automatically displays the Fibonacci retracement levels, representing significant support and resistance. The range for calculating the indicator can be taken from the previous day, week, month, year or user-specified session.
Levels 100 % (High) of the range from the previous session. 0 % (Low) of the range from the previous session. 76,4 % of the range from the previous session. 61,8 % of the range from the previous session. 50 % of the range from the previou
FREE

Variable Index Dynamic Average (VIDYA) developed by Tushar Chande by default is contained in MT5 but not in MT4 platform and it is a dynamic EMA (Exponential Moving Average) that adjusts its Length (LB Period) automatically in response to Market Volatility originally measured through the Chande Momentum Oscillator(CMO). CMO value is used as the ratio to the smoothing factor of EMA ( The New Technical Trader by Tushar Chande and Stanley Kroll, John Wiley and Sons, New York, 1994). The higher th
FREE

Purpose: The function of this indicator is to draw 3 moving averages (MA's) lines on the main MT4 price chart. The MA's are from 3 different timeframes specified by the user independent of the chart that is currently displayed. When you toggle your chart view through different time frames, the 3 MA's will continue to display the MA lines for the time frames specified in the properties. Example: The default settings map out three 50 bars MA's for H4, D1 and W1 time frames. During intraday tradi
FREE

This scanner is monitoring the entire market for trade opportunities for all symbols and for all time frames. You don't have to look to all the charts, for all symbols and for all time frames. This scanner will alert you on your computer, or on your mobile, when a trade opportunity has been found. You never have to miss a trade opportunity! This indicator is designed to scan all pairs and symbols, for all time frames, to find a cross of the MACD main and signal line. MACD Definition
The

Stochastic RSI makes a stochastic calculation on the RSI indicator. The Relative Strength Index (RSI) is a well known momentum oscillator that measures the speed and change of price movements, developed by J. Welles Wilder.
Features Find overbought and oversold situations. Sound alert when overbought/oversold level is reached. Get email and/or push notification alerts when a signal is detected. The indicator is non-repainting. Returns buffer values for %K and %D to be used as part of an EA . (s
FREE

지표의 목적:
오라클 플로우는 기술적 지표와 필터를 조합하여 매수/매도 시장 진입 시점을 식별하도록 설계되었습니다. 이 지표는 차트에 화살표를 표시하여 추세 반전 또는 지속 가능성을 나타냅니다.
주요 사용 요소:
지수 이동 평균(EMA):
- 두 기간 사용: 빠른(Faster)과 느린(Slower) - 움직임의 강도를 확인하는 교차점을 식별하는 데 사용됩니다.
RSI(상대 강도 지수):
- 추세 강도 평가. 50 수준을 넘을 때 신호가 생성되어 강세/약세 우위 변화를 나타냅니다.
불 파워와 베어 파워:
- 강세와 약세 사이의 불균형을 판단하여 신호 필터링을 강화합니다.
볼린저 밴드:
- 채널 외부 가격 움직임을 확인합니다.
변동성 필터링:
지표는 캔들의 평균 범위(고가-저가)를 계산하여 진입점을 정교화합니다.
신호 형성 조건:
매수 신호(파란색 아래쪽 화살표):
빠른 EMA가 느린 EMA 위에 위치하여

This automated AK Edge Scalping Indicator can be employed to oversee trades and identify optimal entry points for all time frames and both buying and selling when the price starts trending upwards or downwards. It is designed to recognize zones for Sell/Buy trades by utilizing the Moving Average and the MACD. Additionally, it incorporates the Average True Value to fine-tune the Stop Loss and the Take Profit. It can be effectively used in conjunction with other strategies to facilitate prompt en
FREE

You've probably heard about the Dow trend Theory, where higher highs and lows indicate an uptrend, and lower highs and lows indicate a downtrend. This indicator determines this trend based on the Dow Theory. You just need to enter a number representing the number of candles between extremes. The optimal solution is the number 3, unless you want to have the trend from M5 but you're on M1, then you need to multiply this number by 5. Check various combinations to trade with the trend. In the scree
FREE
Altopium Trend is an indicator that identifies short-term trends. The signals it generates can be used to open long or short positions or can be integrated with other indicators/strategies. This is a trend indicator, be careful during narrow sideways phases. I recommend using it as a short-term trend indicator, complemented by other indicators that show the best times to enter the market.
Wait for the bar to close to confirm the signal.
FREE

젠트레이드는 전문가 수준으로 도약하는 발판입니다. 일관성, 명확성, 그리고 정밀성을 제공하는 지표로, 신호가 사라지거나 로직이 손상되지 않고 안정적으로 거래할 수 있습니다.
재추첨 없음. 절대. 매수 및 매도 신호는 현재 캔들에서 즉시 생성되며 영구적입니다. 보이는 것이 현실입니다.
변하지 않는 로직. 과거 신호는 삭제되거나 변경되지 않습니다. 테스트 결과가 실제 거래와 일치한다는 확신을 가지고 과거 기록을 분석할 수 있습니다.
지연 없음. 캔들 형성 초기에 신호가 즉시 나타나 최적의 가격에 진입할 수 있는 귀중한 이점을 제공합니다.
진정한 추세 반전: 주요 플레이어의 모멘텀이 변화하는 순간을 정확하게 파악하여 움직임의 시작점에서 바로 거래를 시작할 수 있습니다.
모멘텀 판독: 이 시스템은 가격 변동의 속도와 강도 변화를 정확하게 추적합니다.
다단계 모듈러 필터링: 스마트 시스템은 시장 노이즈와 허위 신호를 걸러냅니다. 수익성이 높고 즉시 실행 가능한
FREE

The Investment Castle Chances indicator will show signals on the chart for entering a buy or sell trade. There are 2 types of signals for each direction as follows: Buy / Sell (Orange colored candlesticks) Strong Buy (Green colored candlesticks) / Strong Sell (Red colored candlesticks) You may place a buy trade once you see the Buy arrow or vise versa, or you might prefer to wait for a further confirmation “Strong Buy” / “Strong Sell”. This indicator works best with the high time frames H1, H
FREE

Break Even Line by MMD
The Break Even line is a useful indicator for people using strategies that allow simultaneous trades in both directions, such as the MMD methodology. This indicator is useful when playing statistical models and averaging positions in accumulation and distribution zones. The indicator draws levels by summing positions in three groups: positions included in BUY, positions included in SELL and all positions included.
Functionality description:
Show BUY BELine - shows or
FREE
** All Symbols x All Timeframes scan just by pressing scanner button ** *** Contact me to send you instruction and add you in "RSI scanner group" for sharing or seeing experiences with other users.
Introduction RSI divergence is a main technique used to determine trend reversing when it’s time to sell or buy because prices are likely to drop or pick in the charts. The RSI Divergence indicator can help you locate the top and bottom of the market. This indicator finds Regular divergence for pul

지표는 차트에 중요한 기술 수준을 표시합니다. 이 수준은 가격 움직임에 대한 지지 또는 저항 역할을 합니다.
가장 중요한 수준은 100 점과 50 점의 배수입니다. 25포인트의 배수로 레벨을 표시할 수도 있습니다.
가격이 수준에 도달하면 경고 또는 푸시 알림이 표시됩니다.
MT5용 버전 https://www.mql5.com/ko/market/product/69740 설정 Show Levels 100 pips - 100핍의 배수로 레벨 표시 Show Levels 50 pips - 50핍의 배수로 레벨 표시 Show Levels 25 pips - 25핍의 배수로 레벨 표시 Color Levels 100 pips - 100핍으로 나눌 수 있는 수준의 선 색상 Color Levels 50 pips - 50핍으로 나눌 수 있는 수준의 선 색상 Color Levels 25 pips - 25핍으로 나눌 수 있는 레벨의 선 색상 Send Alert - 알림 보내기 Send Push - 푸시
FREE
The indicator can be used with any time frame and forex pair. One easy to use parameter in the indicator will allow you to adapt the signals to any forex pair and time frame you want to trade.
The Arrows DO NOT REPAINT !
Information Panel: We've equipped this indicator with a user-friendly Panel. one side of the panel, the time frame is displayed, while on the other side, the currency pair is shown. Below that, the direction of the trend is identified, showing whether it is an uptrend or a d

How To Trade
Execute your trades in 3 Easy Steps!
Step 1: Trade Setup Entry Buy in Line color Blue Touch on line color Red. Entry Sell in Line color Blue Touch on line color Green. Success Rate ≥ 80% 100:20 depend your experience and fast your take. Step 2: Set Stop Loss Stop loss BUY ----> You can not put stoploss with a fixed price, your speed in determining the closing request------>Line color Blue Touch on line color Green. Stop loss SELL ----> You can not put stoploss with a fixed price, yo
FREE

Indicator Description If you need to know future volatility for trading, this indicator is what you need! With the Predictor of the ATR you trading system will be more perfect. This indicator predicts future volatility, and does it quite well. Prediction accuracy is up to 95% at a distance of up to 5 bars into the future (on the period H1). The average forecast accuracy is about 85%, the number of predicted bars is limited by your imagination only. There are five methods used for prediction. The
FREE

Check my p a id tools they work perfect please r ate Adjustable PIN BAR indicator is usefull tool alowing to search for pin bars you wish to find on the price chart, it has 2 parameters to filter out what type of pin bars you wish to search for: 1) MinTailProc 75% (default) which means to show pin bars that has minimum size of the Nose (Tail) as 75% of full candle size. If Upper Nose (Tail) size of the candle is minimum 75% of the candle size fully than candle is painted in RED. If Lower Nose
FREE

Function Indicate Buy Sell Signals Indicate Strength of Buy Sell Signals This system is for both type of traders (Short & Long Term) Instead of Other Calculations, Parabolic Sar & Awesome are also used In Any time frame this can be use. What is in for Trader? Trading Switch: Short Term & Long Term Finally, we all knows that Forex Trading needs completely concentrate & proper cash management, So I never promising that my program will never give you loss but I tried well to provide good and respo
FREE

This scanner is monitoring the entire market for Ichimoku trade opportunities for all symbols and for all time frames. You don't have to look to all the charts, for all symbols and for all time frames. This scanner will alert you on your computer, or on your mobile, when a trade opportunity has been found. You never have to miss a trade opportunity! This indicator is designed to scan all pairs and symbols, for all selected time frames, to find a Tenkan and Kijun Cross or a breakout of the Ich

Parabolic MA Pro - Système de Trading Avancé Détectez les retournements de tendance avec précision grâce à notre système unique combinant SAR Parabolique et Moyenne Mobile ! CARACTÉRISTIQUES RÉELLES SYSTÈME HYBRIDE INNOVANT SAR Parabolique calculé sur la Moyenne Mobile (au lieu du prix direct) Filtrage des faux signaux grâce à la double validation Algorithme exclusif de retournement de tendance ALERTES PRÉCISES Notifications sonores aux points de retournement Détection automati
FREE

Indicators are for trend followers!
A trading system constructed by three moving averages. Trade with the trend and let profits run.
Strongly recommend trend indicators, automatic calculation of wave standard and MT5 version of automatic calculation of wave standard Necessary for traders: tools and indicators Waves automatically calculate indicators, channel trend trading Perfect trend-wave automatic calculation channel calculation , MT4 Perfect trend-wave automatic calculation channel
FREE

DiverX is a powerful and versatile divergence indicator developed for the MetaTrader 4 platform. It detects both Regular and Hidden Divergences based on five popular technical indicators: RSI (Relative Strength Index) , RVI (Relative Vigor Index) , Stochastic Oscillator, CCI (Commodity Channel Index) , and MACD (Moving Average Convergence Divergence) . The indicator plots results directly on the main chart, providing visual lines, arrows, and labels for easy analysis.
FREE
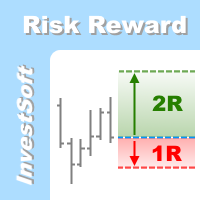
This is the forex visual orders tool & forex position size (lot) calculator with intuitive panel. Risk Reward Ratio Indicator works on all kind of symbols: currency pairs, indices, metals, commodities, cryptocurrencies, etc.
If you want to make sure that Risk Reward Ratio Indicator works on your favorite symbols contact us ( visit our profile ) and ask for 7-day free trial to test this tool without limits. If you want to place orders easier, faster and more intuitive? If you like to mark trad

Indicator (includes Volume Profile + Order Blocks) - a revolutionary indicator that combines two of the most powerful concepts of modern technical analysis: volume profiles and institutional players' order blocks. This tool allows you to see what is hidden from most traders and gives you a significant advantage in the market.
Key benefits of the indicator: Visualization of "smart money": Clearly shows the areas of concentration of large players, highlighting areas with maximum volume in bright

Arrow Indicator (Buy/Sell Alerts) – Simple Yet Powerful Tool! Product Version: 1.01 Indicator Type: Trend Reversal Signals Timeframes Supported: All (Recommended: H1, H4, D1) Key Features: Buy Signal: Green upward arrow () appears below the candle Sell Signal : Red downward arrow () appears above the candle Accurate Trend Reversal Detection – Based on tried and tested SMA strategy. ️ Clean Chart View – Minimalist, non-i
FREE

Resistance and Support is an easy to use indicator to apply horizontal lines of resistance and support. There are two windows for adding levels. When you press the button, a line appears on the price chart. It is possible to double-click this line with the mouse to activate and move it, thereby changing the indicator readings. In the indicator menu there is a choice of possible alerts - no alert, alert on touching the level an alert for closing the candle after the level.
FREE

"Sentiments of traders" in the financial markets is a topic that has been of interest to us for a long time. In time, we could not find the right formula to define these sentiments. We went through many stages in the search for the right methodology - from taking data from external sources to calculate open positions of buyers and sellers to calculating tick volumes, but still we were not satisfied with the results. The calculation of open positions of buyers and sellers from external sources ha
Please read before you purchase : - We don't have buyer's detail when purchase was made. In order to get the bonuses, you need to contact me via product comment ( not product review). That way I will contact you back via mql message asking for email. - Please make sure you enable receiving message from non-friend list, otherwise I cannot message you for email. This indicator is not just about Smart Money Concept, with lots of features which I believe could help you understand the concept. Not on
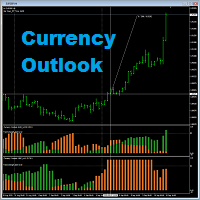
Currency Outlook is an indicator that can help us "Trade the right pair in the right direction and at the right time". This indicator analyzes prices of all cross currency pairs of the selected currency and report the result to us in form of double colours histogram diagram. The maximum height of the histogram diagram of the indicator is 100. The indicator is exclusively programming for AUD, CAD, CHF, EUR, GBP, JPY, NZD and USD. It can work in any timeframe in MT4. A feature for calculating trad

Macd Predictor Macd's main chart indicator If you like this indicator , Dinapoli Levels Expansion and Retracement Demo is a helpful tool: https://www.mql5.com/en/market/product/35884
1. You can determine the price at which the MACD will change from buy to sell, and vice versa. It is the cousin of the oscillator predictor. If you know a position at the time, then the exact price, current and next (future) columns will need to reach the MACD crossover. You can also see how far the market has to
FREE

Metatrader 4의 R Show Ticks 표시기는 기본 거래 창에서 실시간으로 위/아래 틱을 보여줍니다.
주요 테이크 아웃 흰색 화살표는 상승세입니다. 빨간색 화살표는 다운틱입니다. 표시기는 원하는 통화 쌍 및 시간 프레임에 대해 작동합니다.
표시기 사양 거래 플랫폼: Metatrader 4(MT4)용으로 개발됨
통화 쌍: 모든 통화 쌍에서 작동합니다.
시간 프레임: 모든 시간 프레임에서 작동
입력 매개변수: 기호, 스타일, 색상을 입력합니다.
지표 유형: 데이터
지표의 입력 및 매개변수를 편집하는 방법은 무엇입니까? 지표가 첨부된 차트에서 마우스 오른쪽 버튼을 클릭합니다. 드롭다운 메뉴에서 지표 목록을 클릭합니다. 목록에서 지표를 선택하고 편집을 누릅니다. 이제 지표를 편집할 수 있습니다. 마지막으로 확인 버튼을 눌러 업데이트된 구성을 저장합니다.
아래 그림은 트레이딩 차트에서 작동하는 Forex 차트 mt4 표시기의 R Show Ticks를 보여줍니다.
FREE

Downloads missing data for all currency pairs available in market watch. Very useful for backtesting EAs and strategies and downloading all history at once instead of individually. This products downloads data for the Ultimate Sniper Dashboard and can work with any other products. The indicator will run until all the historical data for the selected currency pairs have been downloaded. The indicator has multiple options: 1. Download data for single pair 2. Download for current pair only 3. Downl
FREE

The volume weighted average price (VWAP) is a trading benchmark used by traders that gives the average price a security has traded at throughout the day, based on both volume and price. VWAP is calculated by adding up the dollars traded for every transaction (price multiplied by the number of shares traded) and then dividing by the total shares traded. You can see more of my publications here: https://www.mql5.com/en/users/joaquinmetayer/seller
FREE

STOCH AND RSI ALERT https://www.mql5.com/en/users/earobotkk/seller#products (I have created a dashboard from this product, please take a look by clicking here ) (I have also created an EA from this product, NOW user can go automation, click here ) P/S: If you like this indicator, please rate it with 5 stars in the review section, this will increase its popularity so that other users will be benefited from using it. This indicator notifies and draws an arrow on the chart whenever the main sto
FREE

Range Filter - BreakOut EA
What is the Range Filter? The Range Filter is an innovative tool designed to smooth out market noise and highlight meaningful price movements. Rather than focusing on every small fluctuation, the Range Filter eliminates insignificant activity, allowing traders to see trends more clearly. The idea comes from the QQE’s volatility filter, but instead of applying it to RSI, this approach is applied directly to price action. Here’s how it works: A smoothed average of t
FREE
BinaryPin is an indicator developed and adapted specifically for trading short-term binary options. The indicator's algorithm, before issuing the signal, analyzes many factors, such as market volatility, searches for the PinBar pattern, calculates the probability of success when making a deal. The indicator is set in the usual way. The indicator itself consists of an information window where the name of the trading instrument is displayed, the probability of making a successful transaction, the
FREE

** All Symbols x All Time frames scan just by pressing scanner button ** *** Contact me to send you instruction and add you in "Divergence group" for sharing or seeing experiences with other users. Introduction MACD divergence is a main technique used to determine trend reversing when it’s time to sell or buy because prices are likely to drop or pick in the charts. The MACD Divergence indicator can help you locate the top and bottom of the market. This indicator finds Regular divergence for pul

개요 True Strength Index(TSI) 지표는 MT4의 별도 창에 표시되는 모멘텀 오실레이터입니다. 모멘텀(MTM)과 그 절대값을 두 번의 지수 이동평균(EMA)으로 부드럽게 처리한 뒤, 그 비율에 100을 곱해 산출합니다. TSI는 시장 추세의 강도와 전환점을 시각적으로 파악하는 데 유용합니다. 주요 기능 이중 EMA 부드러움 처리로 노이즈 감소 및 깨끗한 선 형태 제공 신호 EMA 오버레이로 진입·청산 타이밍 보조 –100에서 +100 범위 자동 스케일링 0 및 ±50 레벨 라인 표시로 가독성 향상 Fast EMA, Slow EMA, Signal EMA 기간을 자유롭게 설정 가능 설치 방법 MT4에서 “파일” → “데이터 폴더 열기”를 선택합니다. TSI.mq4 파일을 MQL4\Indicators 폴더에 복사합니다. MT4를 재시작하거나 “네비게이터” 창에서 우클릭 후 “새로 고침”을 선택합니다. 차트 상단 “삽입” → “사용자 지정” → “TSI”를 차례로 클릭한 후
FREE

Are you tired of plotting fibonacci retracements or extensions manually? This indicator displays fibonacci retracements or extensions automatically, calculated from two different price points, without human intervention or manual object anchoring. [ Installation Guide | Update Guide | Troubleshooting | FAQ | All Products ] Easy to use Manual anchoring is not needed Perfect for price confluence studies The indicator evaluates if retracements or extensions are needed Once drawn, you can manually
FREE
Stop Guessing, Start Confirming: Introducing Signal Sentinel Are you tired of signals that leave you hanging? The Signal Sentinel indicator is your ultimate weapon against market uncertainty, designed to deliver high-probability trading setups directly to your chart. We've combined the power of two MACDs with a long-term EMA filter to ensure you only trade in the strongest, most confirmed trends. This isn't just another indicator; it's a complete confirmation system that acts as your guard agai
FREE

Discover the Power of Trend Strength Pro Unlock a new level of clarity in your trading with Trend Strength Pro , the ultimate tool for visualizing market momentum. Stop guessing and start seeing the true strength of a trend with a single glance. Our elegant and intuitive indicator helps you make smarter, more confident trading decisions. Key Advantages & Features Instantly See Trend Strength : Our color-coded histogram tells you whether the trend is getting stronger or weaker. Green means moment
FREE

Oscillator Dominator: The Advanced Edge in Your Trading Tired of lagging indicators and mixed signals? The Oscillator Dominator is a powerful, proprietary indicator designed to cut through market noise and pinpoint high-probability trading opportunities. It doesn't just use a standard Relative Strength Index (RSI); it elevates it by applying a Moving Average (MA) to the price first, creating a smoother, more responsive momentum measure—what we call RSIOMA . This means you get clearer signals, f
FREE
**Squeeze Box Indicator** Squeeze Box is a powerful technical analysis indicator developed for the MetaTrader 4 platform, designed to support day trading strategies. This indicator analyzes market movements to detect bullish and bearish breakout signals, enabling traders to capture trends early. With its customizable features and user-friendly interface, it is ideal for both novice and experienced traders.
### Features and Functions - **Bullish and Bearish Signals**: Identifies market break
FREE

정확한 거래 분석을 손끝에서: 차세대 거래 분석 소프트웨어 시중에 나와 있는 일반적인 거래 분석 소프트웨어는 종종 시간별 또는 주별 손익 비율 통계만 제공하여 더 정확한 거래 분석의 필요성을 충족하지 못합니다. 그러나 실제 거래 시장에서는 매일마다 고유한 상황이 발생합니다. 월요일은 조용하고, 수요일은 3배의 오버나이트 금리로 활발하며, 금요일은 주요 데이터 발표로 인해 매우 활발합니다. 분명히 매일 통계 분석을 수행하는 것은 과학적이지 않으며, 주 단위로 분석하는 것이 더 합리적입니다. 그러나 주간 차트는 각 날의 통계적 조건만을 보여주고 시간별 변화를 포착할 수 없습니다. 또한 특정 상품은 롱 포지션과 숏 포지션 간에 상당한 차이를 보이며, 이는 현재 거래 분석 소프트웨어에는 없는 별도의 분석이 필요합니다.
시간 단위가 너무 거친 것 외에도 기존 거래 분석 소프트웨어는 전략 필터링 측면에서도 부족합니다. 한 상품에 여러 전략이 동시에 실행될 수 있기 때문에 상품 이름만으로 필
FREE

이 표시기는 다른 차트 표시기에 상대적인 채널을 생성합니다: 표시기 + ATR 및 표시기 - ATR . 가격이 기준선보다 너무 많이 올랐는지 알 때 유용합니다. ATR 레벨은 승수로 조정할 수 있습니다. 이 버전은 MT4 제한 사항 중 일부를 피하기 위해 MT5 버전보다 더 복잡합니다. 기준선의 이름 , 매개변수 (쉼표로 구분된 문자열) 및 버퍼 를 도입해야 합니다. 기준선이 하나 의 버퍼에만 필요한 모든 값을 가지고 있는지 확인하십시오(또는 둘 이상의 인스턴스를 넣어야 할 수도 있음).
기준선의 문자열 매개변수는 지원되지 않으며 , 어떤 값이 도입되더라도 항상 기본값이 사용됩니다. 열거자의 경우 위치를 사용합니다(대부분의 경우 0부터 시작). 예를 들어 MA 모드의 경우: sma=0; 에마=1; smma=2; lwma=3
이점으로 이 표시기는 원래 기준선도 표시하므로 동일한 표시기에 3개의 선이 모두 표시됩니다. 특별한 이름 태그가 있는
FREE

GTAS S-Trend is a momentum indicator that helps to determine trends using combination of MACD, RSI and moving averages. This indicator was created by Bernard Prats Desclaux, proprietary trader and ex-hedge fund manager, founder of E-Winvest.
Description The indicator oscillates between -65 and +65 with a neutral zone between -25 and +25 around a 0 equilibrium line. S-Trend between -25 and +25 indicates congestion zones with a bullish bias between 0 and +25, and a bearish bias between 0 and -25.
FREE

The Bullish and Bearish Engulfing Pattern Screener for MetaTrader 4 is a powerful tool designed for traders looking to identify key reversal patterns in the financial markets. This indicator scans price charts for bullish and bearish engulfing patterns, which signal potential trend reversals. Key Features: Real-time Scanning : Continuously analyzes price data to provide instant alerts when engulfing patterns are detected. Customizable Settings : Allows users to adjust parameters to fit their tra
FREE
MetaTrader 플랫폼 어플리케이션 스토어에서 MetaTrader 마켓에서 트레이딩 로봇을 구매하는 방법에 대해 알아 보십시오.
MQL5.community 결제 시스템은 페이팔, 은행 카드 및 인기 결제 시스템을 통한 거래를 지원합니다. 더 나은 고객 경험을 위해 구입하시기 전에 거래 로봇을 테스트하시는 것을 권장합니다.
트레이딩 기회를 놓치고 있어요:
- 무료 트레이딩 앱
- 복사용 8,000 이상의 시그널
- 금융 시장 개척을 위한 경제 뉴스
등록
로그인
계정이 없으시면, 가입하십시오
MQL5.com 웹사이트에 로그인을 하기 위해 쿠키를 허용하십시오.
브라우저에서 필요한 설정을 활성화하시지 않으면, 로그인할 수 없습니다.