MetaTrader 4용 무료 기술 지표

원미닛 골드 는 거래량·가격·추세 필터링 기반의 화살표 진입 신호로, 트레이더가 시장의 올바른 방향을 잡고 기회를 창출하도록 돕습니다. 왜 원미닛 골드를 선택해야 할까요? TP-SL. 각 신호에 TP와 SL 오브젝트가 차트에 나타나며, ATR TP-SL과 고정 포인트 TP-SL 두 가지 방식 제공. 통계 패널. 지정된 히스토리 바에서 승패 통계, 현재 승률, 연승·연패 기록 및 총 순이익을 표시. 높은 조정성. 기본 설정은 최적화되어 있으나, 사실상 무한한 기간·조합 가능. 5가지 규칙이 모두 충족되어야 신호가 검증됨. 리페인트 없음. 다른 지표와 달리, 본 지표는 혼란 없는 경험을 제공 — 화살표와 모든 기능은 절대 리페인트 되지 않습니다! -------------------------
FREE
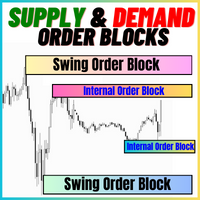
공급 및 수요 주문 블록:
"공급 및 수요 주문 블록" 인디케이터는 외환 기술 분석에 중요한 스마트 머니 개념을 기반으로 한 정교한 도구입니다. 이는 공급 및 수요 영역을 식별하고, 기관 트레이더가 중요한 흔적을 남기는 핵심 영역을 집중 조명합니다. 판매 주문을 나타내는 공급 영역과 구매 주문을 나타내는 수요 영역은 트레이더가 가격 움직임의 잠재적인 반전이나 둔화를 예상하는 데 도움을 줍니다. 이 인디케이터는 브레이크아웃 오브 스트럭처 (BoS)와 페어 밸류 갭 (FVG) 구성 요소를 결합한 똑똑한 알고리즘을 사용합니다. BoS는 시장 교란을 감지하고, 잠재적인 주문 블록을 지적하는 반면, FVG는 정확성을 향상시키기 위해 공정 가치 갭을 고려합니다. 이 도구는 이러한 조건을 시각적으로 나타내어 트레이더가 결정을 내리는 데 도움을 줌으로써 잠재적인 주문 블록을 강조하고 시장 역학 및 전환점에 대한 통찰력을 제공합니다. 사용자 친화적인 디자인으로 다양한 기술 지식 수준의 트레이더에
FREE

Crystal Volume Profile Auto POC (MT4) — 자동 POC 볼륨 프로파일 개요
Crystal Volume Profile Auto POC 는 MetaTrader 4용으로 설계된 가볍고 최적화된 인디케이터입니다. 가격대별 거래량 분포를 시각화하며, 가장 많은 거래량이 발생한 가격 수준인 POC(Point of Control)를 자동으로 표시합니다. 이를 통해 숨겨진 지지/저항 구역, 누적/분배 구간 및 기관 투자자의 활동을 쉽게 식별할 수 있습니다. MetaTrader 5 버전도 제공됩니다: Crystal Volume Profile Auto POC (MT5) . 주요 기능 자동 POC 탐지 동적 볼륨 프로파일 (차트 가시 영역 또는 사용자 정의 범위) 고정 프로파일 옵션 (세부 영역 분석) 히스토그램 크기, 색상 및 라인 스타일 완전 사용자 정의 가능 각 캔들마다 실시간 자동 업데이트 Reset VP, Hide VP 버튼 내장 라이트/다크 차트 테마 지원 사
FREE
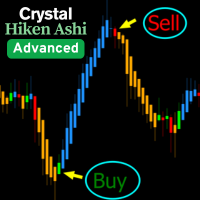
Crystal Heikin Ashi – 고급 시각화 Heikin Ashi (MT4 버전) 개요 Crystal Heikin Ashi for MetaTrader 4 는 전문적인 Heikin Ashi 지표로, 차트 시각화를 개선하고 프라이스 액션 트레이더, 스캘퍼, 분석가에게 명확성을 제공합니다.
이 MT4 버전은 순수한 Heikin Ashi 캔들에 중점을 두며, 가볍고 최적화된 성능을 제공합니다. 참고: 추세 기반 색상 및 고급 모멘텀 감지는 MT5 버전에서 제공됩니다:
MT5 버전 → https://www.mql5.com/en/market/product/142042 주요 기능 (MT4) 네이티브 Heikin Ashi 캔들. 상승/하락 색상 사용자 지정 가능. 기본 캔들 숨기기 옵션. 라이트/다크 테마 지원. 긴 데이터에서도 빠른 처리 속도. 가격 흐름과 반전을 명확히 표시. 파라미터 캔들 스타일: 표준. 차트 테마: 라이트/다크. 적합 대상 프라이스 액션 트레이더. 스캘퍼. MT4에서
FREE
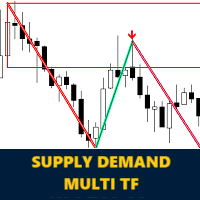
MetaTrader 4용 Koala 공급 수요 지표 소개 (긍정적이든 부정적이든 귀하의 리뷰나 피드백을 공유하여 다른 트레이더가 귀하의 경험을 통해 이익을 얻을 수 있도록 해주세요.) : 코알라 공급 및 수요 지표에 오신 것을 환영합니다. 이 지표는 끊임없는 공급 및 수요 지역을 식별하기 위해 설계되었습니다. 이 지표는 트레이더가 시장을 지역 영역으로 볼 수 있도록 도와주며 가격이 어떻게 강력한 지역을 존중하는지 확인할 수 있습니다. 또한 이 지표는 지역 내에서 형성된 가격 행동 신호를 보여줄 수도 있습니다. 코알라 트레이딩 솔루션 채널 에 가입하여 모든 코알라 제품에 대한 최신 소식을 확인하십시오. 가입 링크는 다음과 같습니다: https://www.mql5.com/en/channels/koalatradingsolution https://www.mql5.com/en/blogs/post/755700
!중요 : 이 제품에는 무료 전문가 고문 (EA)가 포함되어 있습니다. 구매 후
FREE

트렌드 캐처 (The Trend Catcher): 알림 인디케이터가 포함된 트렌드 캐처 전략은 트레이더가 시장의 추세와 잠재적인 진입 및 청산 지점을 식별하는 데 도움이 되는 다기능 기술 분석 도구입니다. 시장 상황에 따라 적응하는 동적 트렌드 캐처 전략을 특징으로 하며, 추세 방향을 명확하게 시각적으로 보여줍니다. 트레이더는 개인의 선호도와 위험 허용 범위에 맞게 매개변수를 사용자 지정할 수 있습니다. 이 인디케이터는 추세 식별을 돕고, 잠재적 반전 신호를 제공하며, 트레일링 스탑 메커니즘으로 작동하고, 실시간 알림을 통해 신속한 시장 대응을 가능하게 합니다. 기능: 추세 식별: 상승 및 하락 추세를 신호로 표시합니다.
추세 반전: 캔들 색상이 상승에서 하락으로 또는 그 반대로 변할 때 잠재적 반전을 알립니다.
실시간 알림: 새로운 추세가 감지되면 알림을 생성합니다. 추천: 통화쌍: EURUSD, AUDUSD, XAUUSD…
시간 프레임: M5, M10, M15, M30, H1.
FREE
MT4 버전: https://www.mql5.com/en/market/product/125756 MT5 버전: https://www.mql5.com/en/market/product/157655
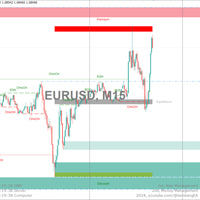
이 올인원 지표는 실시간 "시장 구조"(내부 및 스윙 BOS/CHoCH), 주문 블록, 프리미엄 및 할인 구역, 동일 고가 및 저가 등 다양한 정보를 표시하여 트레이더가 널리 사용되는 가격 변동 방법론을 사용하여 차트를 자동으로 마크업할 수 있도록 지원합니다. 공정가치 갭 스크립트 출시 이후, 커뮤니티로부터 동일 카테고리에 더 많은 기능을 추가해 달라는 요청을 많이 받았습니다.
"시장 구조"는 유동성을 더욱 정확하게 파악하고 시장에서 최적의 관심 지점을 찾으려는 가격 변동 트레이더들 사이에서 비교적 최근에 사용되지만 널리 사용되는 용어입니다. 기관 시장 참여자들이 주문을 어디에 넣었는지(매수 또는 매도 유동성) 파악하는 것은 가격 변동에 기반한 더욱 실용적인 진입 및 청산 시점을 찾는 매
FREE

트레이딩 세션 시간 인디케이터:
"트레이딩 세션 시간 인디케이터"는 외환 시장의 다양한 거래 세션에 대한 이해를 높이기 위해 설계된 강력한 기술 분석 도구입니다. 이 시스템에 통합된 인디케이터는 도쿄, 런던 및 뉴욕을 포함한 주요 세션의 개장 및 마감 시간에 대한 중요한 정보를 제공합니다. 자동 시간대 조정을 통해 이 인디케이터는 전 세계 트레이더를 대상으로 하여 고유의 거래 일정을 최적화하고 저활동 시간을 피할 수 있습니다. 시장 심리, 피크 변동성 시기 및 중첩 세션에 대한 통찰력을 제공하여 일중 트레이더가 전략과 일치하는 정확한 결정을 내릴 수 있도록 지원합니다. 사용자 정의 가능한 디스플레이를 통해 사용자 경험을 개인화할 수 있으며, 해당 데이터를 활용한 스마트 트레이딩 계획은 향상된 거래 결과를 가져올 수 있습니다. 저활동 시간을 인식하여 과다 거래를 피하고 품질 높은 기회에 집중함으로써 트레이더가 이 인디케이터를 통해 거래 여정을 최적화할 수 있습니다.
특징:
-
FREE

캔들 타이머 카운트다운은 현재 막대가 닫히고 새 막대가 형성되기까지 남은 시간을 표시합니다. 시간 관리에 사용할 수 있습니다.
MT5 버전은 여기 !
기능 하이라이트 현지 시간이 아닌 서버 시간을 추적합니다. 구성 가능한 텍스트 색상 및 글꼴 크기 기호 일일 변동의 선택적 시각화 CPU 사용량을 줄이기 위해 최적화
입력 매개변수
일별 편차 표시: 참/거짓 텍스트 글꼴 크기 텍스트 색상
여전히 질문이 있는 경우 다이렉트 메시지로 저에게 연락하십시오. https://www.mql5.com/ko/users/robsjunqueira/
이것이 우리가 지속적으로 발전 할 수있는 유일한 방법이기 때문에 개선을위한 제안에 부담없이 문의하십시오. 또한 당사의 다른 지표 및 전문 고문에 대해 알아보십시오. 다양한 유형의 자산을 거래할 수 있는 다양한 상품이 있음을 알 수 있습니다.
FREE

MT5 버전 Golden Hunter 는 수동으로 시장을 거래하는 트레이더를 위해 개발되었습니다. 3가지 지표로 구성된 매우 강력한 도구입니다. 강력한 진입 전략: 통화 쌍의 변동성을 측정하고 시장 추세를 식별하는 지표로 구성됩니다. LSMA: 가격 데이터를 평활화하고 단기 추세 파악에 유용합니다. Heikin Ashi: 지표가 차트에 연결되면 일본 캔들은 Heikin Ashi 캔들로 변경됩니다. 이러한 유형의 양초는 가격 정보를 부드럽게 하여 강력한 추세를 파악할 수 있도록 합니다.
형질 다시 칠하지 마십시오
이 표시기는 새 데이터가 도착해도 값을 변경하지 않습니다
스프레드가
매우 낮고 변동성이 큰 거래 쌍(EURUSD, GBPUSD, BTCUSD…). 범위(범위) 쌍을 사용하는 것은 권장되지 않습니다
기간
M5
거래
시간 시장에서 더 많은 움직임이 있고 스프레드가 낮은 시간대에 거래하는 것이 좋습니다
Buffers Buy Buffer: 9 / Sell Buff
FREE
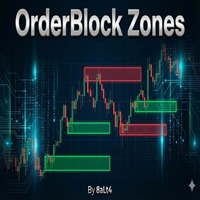
개요 OrderBlock Zone은 시장에서 기관 거래 구역(Order Blocks)을 자동으로 탐지하고 시각화하는 고급 MetaTrader 4 지표입니다. 대형 플레이어(은행, 헤지 펀드)가 남긴 흔적을 추적하여 잠재적인 지지선과 저항선을 식별합니다.
주요 기능 자동 오더블록 탐지 프랙탈 기반 분석: 36기간(사용자 정의 가능) 프랙탈 분석으로 강력한 반전 지점 식별 불 & 베어 존: 녹색 화살표 상승, 빨간색 화살표 하락 오더블록 표시 Engulfing Pattern 지원: 삼키기 캔들 패턴을 인식하여 더 강력한 신호를 생성합니다 시각적 도구 자동 레벨 라인: 각 OrderBlock에 대한 상한선 및 하한선 컬러 존: Bull(녹색) 및 Bear(빨간색) 구역이 명확히 구분됩니다 Engulfing Highlight: 삼키기 패턴을 파란색/주황색 사각형으로 강조 표시 깔끔한 인터페이스: 그리드가 자동으로 닫히고, 최적화된 보기를 위해 차트가 왼쪽으로 이동 사용자 정의 가능
FREE
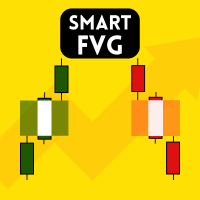
Smart FVG 인디케이터 MT4 – MetaTrader 4를 위한 고급 Fair Value Gap 탐지 Smart FVG 인디케이터 MT4는 MetaTrader 4 차트에서 Fair Value Gap(FVG)을 전문적으로 탐지하고, 모니터링하며, 알림까지 제공하는 도구입니다. ATR 기반 필터링과 시장 구조를 인식하는 로직을 결합하여 노이즈를 줄이고, 유동성 환경에 맞게 자동으로 적응하며, 매매 의사결정에 중요한 불균형 구간만 남겨 줍니다.
주요 장점 정확한 FVG 탐지: 단순한 캔들 갭이 아닌 실제 시장 비효율 구간을 식별합니다. ATR 기반 정밀도: 다양한 상품과 시간 프레임에서 저품질 신호를 걸러내는 적응형 민감도. 실시간 유효성 추적: 가격이 해당 구간을 메우거나 돌파하면 존이 자동으로 연장·조정·삭제됩니다. 사용자 정의 가능한 시각화: 색상, 선 스타일, 채우기 옵션을 템플릿에 맞게 자유롭게 설정 가능. 실질적인 알림: 새로 생성된 FVG, 메워진 FVG, 무효화된
FREE

우리의 지지 또는 저항 수준은 시장의 가격 움직임이 반전되고 방향이 바뀌면서 시장에 고점 또는 저점(스윙 포인트)을 남길 때 형성됩니다. 지원 및 저항 수준은 거래 범위를 개척할 수 있습니다. 지표는 지표 세트에 정의된 X개의 막대( 기간 )를 기반으로 스윙 하이 및 스윙 로우를 식별합니다.
참고: 가격 조치 표시기가 마음에 들면 하나의 추세 표시기(추세 스크리너, 추세선, 강한 추세 및 추세 반전 신호 등)를 모두 사용해 보십시오. 그것을 얻으려면 , 여기를 클릭하십시오
주요 특징들 기술적 분석의 핵심 개념은 저항이나 지지 수준이 무너지면 그 역할이 역전된다는 것입니다. 가격이 지원 수준 아래로 떨어지면 그 수준은 저항이 될 것입니다. 가격이 저항선 위로 올라가면 종종 지지선이 됩니다. 수평 지원 및 저항 수준은 이러한 수준의 가장 기본적인 유형입니다. 그들은 단순히 수평선으로 식별됩니다.
차트의 녹색 레벨은 저항 레벨입니다. 차트의 빨간색 레벨은 지원 레벨입니다.
우리의
FREE
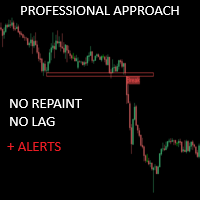
크리티컬 존은 보다 정확한 시장 진입을 원하는 수동 트레이더를 위해 특별히 개발되었습니다. 이 인디케이터는 고급 알고리즘을 사용해 차트에서 가장 관련성이 높은 지지선과 저항선, 돌파 및 재테스트를 계산하여 관심 영역을 감지합니다. 이 지표는 잠재적으로 수익성 있는 매수/매도 기회가 감지되면 경고 및 알림을 보내도록 구성할 수 있어 트레이더가 화면/ MT5 버전 앞에 있지 않아도 거래 기회를 놓치지 않고 파악할 수 있습니다.
특징 다시 칠하지 않음 이 표시기는 새 데이터가 도착해도 값이 변경되지 않습니다 거래 쌍 모든 외환 쌍 계절성 모든 계절성
매개변수 ===== 지지 및 저항 구성 =====
계산을 위해 볼 막대 // 지지 및 저항 수준을 계산하기 위해 현재 막대에서 거꾸로 된 막대 범위
===== 조건 =====
브레이크아웃 // 브레이크아웃 감지를 켜거나 끕니다.
재테스트 // 재테스트 감지를 활성화 또는 비활성화합니다.
===== 지지 및 저항 스타일
FREE

Over 100,000 users on MT4 and MT5 Blahtech Candle Timer displays the remaining time before the current bar closes and a new bar forms. It can be used for time management Links [ Install | Update | Training ] Feature Highlights
The only candle timer on MT4 with no stutter and no lag S electable Location Tracks server time not local time Multiple colour Schemes Configurable Text Customisable alerts and messages Optimised to reduce CPU usage Input Parameters Text Location - Beside / Upper
FREE

지원 및 저항 수준 찾기 도구:
지원 및 저항 수준 찾기는 거래에서 기술적 분석을 향상시키기 위해 설계된 고급 도구입니다. 동적 지원 및 저항 수준을 갖추고 있어 차트에서 새로운 키포인트가 펼쳐짐에 따라 실시간으로 적응하여 동적이고 반응이 빠른 분석을 제공합니다. 독특한 다중 시간대 기능을 통해 사용자는 원하는 시간대에서 다양한 시간대의 지원 및 저항 수준을 표시할 수 있으며, 5분 차트에 일일 수준을 표시하는 등 세밀한 시각을 제공합니다. 역사적 데이터 세트를 포함한 스마트 알고리즘을 사용하여 다른 S&R 지표와 차별화되는 포괄적인 분석을 보장합니다. 수준을 감지할 때 다중 매개변수 계산을 사용하여 정확성을 높입니다. 사용자는 지원 및 저항 수준의 색상을 개별적으로 사용자 정의하여 개인화된 시각적 경험을 만들 수 있습니다. 도구에는 가격이 중요한 수준에 접근할 때 거래자에게 알림 기능이 포함되어 시기적절한 결정을 돕습니다. 숨기기 및 표시 버튼과 수준의 가시성을 빠르게 전환하기
FREE

이 프로젝트를 좋아한다면 5 스타 리뷰를 남겨주세요. Volume-weighted average price는 총 거래량에 거래된 값의 비율입니다.
특정 시간대에 거래. 평균 가격의 측정입니다.
주식은 거래 수평선에 거래됩니다. VWAP는 종종 사용됩니다.
투자자의 거래 벤치 마크는 가능한 한 수동으로
실행. 이 지시자로 당신은 VWAP를 당길 수 있을 것입니다: 현재 날. 현재 주. 현재 달. 현재 분기. 현재 년. 또는: 이전 날. 이전 주. 지난 달. 이전 분기. 이전 연도.
FREE

주요 목적:"핀 바"는 금융 시장 차트에서 핀 바를 자동으로 감지하도록 설계되었습니다. 핀 바는 특징적인 몸체와 긴 꼬리를 가진 촛불로,추세 반전 또는 교정을 신호 할 수 있습니다.
작동 원리:표시기는 차트의 각 촛불을 분석하여 촛불의 몸,꼬리 및 코의 크기를 결정합니다. 미리 정의 된 매개 변수에 해당하는 핀 막대가 감지되면 표시기는 핀 막대의 방향(강세 또는 약세)에 따라 위 또는 아래 화살표로 차트에 표시합니다.
매개 변수: 꼬리의 길이와 핀 바의 몸체 크기 사이의 최소 비율을 정의합니다. "코"와 핀 바의 꼬리 사이의 최대 허용 비율을 설정합니다. 화살표 크기-표시된 핀 막대와 차트에서 핀 막대를 가리키는 화살표 사이의 거리를 정의합니다. 신청:"핀 바"표시기는 잠재적 인 추세 반전 지점을 식별하고 시장 또는 가까운 위치에 진입하기 위해 신호를 생성하는 데 사용할 수 있습니다. 올바르게 사용하고 다른 기술 지표 및 분석 방법과 결합하면이 지표는 거래 결과를 향상시킬 수
FREE

MT4 버전: https://www.mql5.com/en/market/product/125434 MT5 버전: https://www.mql5.com/en/market/product/157662
MT4 어시스턴트: https://www.mql5.com/en/market/product/107986
랠리 베이스 랠리(RBR), 드롭 베이스 랠리(DBR), 드롭 베이스 드롭(DBD), 랠리 베이스 드롭(RBD), 공정가치 갭(FVG)/불균형, 히든 베이스
"수요 공급 MT4" 지표를 소개합니다. 역동적인 금융 시장을 정확하고 자신 있게 탐색할 수 있는 최고의 도구입니다. 이 최첨단 지표는 트레이더가 수요와 공급 동향에 대한 실시간 통찰력을 제공하여 정보에 기반한 의사 결정을 내리고 거래 잠재력을 극대화할 수 있도록 세심하게 설계되었습니다. 주요 기능: 자동화된 존 식별: 이 지표는 고급 알고리즘을 사용하여 가격 차트에서 주요 수요 및 공급 존을 자동으로 감지하고 표시합니다. 이러한
FREE

The "Gold Trader Pro Indicator" is an advanced technical analysis tool for the MetaTrader 4 platform, designed to help you make informed trading decisions about gold. Using a combination of moving averages, RSI, ADX, MACD, and volume analysis, this indicator provides clear trading signals across multiple timeframes, including M5, M15, M30, H1, H4, and D1. My indicators for free. I only ask that leave your feedback to help me improve them or as a thank you. Have a good trade! Main Features Multi
FREE
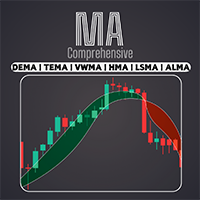
전문 종합 이동평균 지표로 EMA, SMA, WMA 등 다양한 이동평균을 이용할 수 있습니다. 고유한 트레이딩 스타일/ MT5 버전에 맞게 이동평균을 완벽하게 조합하여 기술적 분석을 사용자 지정할 수 있습니다.
특징
서로 다른 설정으로 두 개의 이동평균을 활성화할 수 있습니다. 차트 설정을 사용자 지정할 수 있습니다. 교차 이평선 또는 이평선과 교차한 가격에 따라 캔들 스틱의 색상을 변경할 수 있습니다. 교차 이평선 또는 교차 가격 발생 시 알림 전송.
포함된 이동평균 유형 SMA --------------------> (Simple) EMA --------------------> (Exponential) SMMA [RMA] ----------> (Smoothed) WMA -------------------> (Linear Weighted) DEMA ------------------> (Double EMA) TEMA ------------------>
FREE

비교할 수 없는 공정가치 갭 MT4 지표(FVG)로 전에 없던 거래를 경험해보세요.
동급 최고로 평가받고 있습니다. 이 MQL5 시장 지표는 평범함을 넘어
트레이더들에게 시장 동향에 대한 탁월한 수준의 정확성과 통찰력을 제공합니다. EA 버전: WH Fair Value Gap EA MT4
SMC 기반 지표: WH SMC Indicator MT4 특징:
동급 최고 공정가치 갭 분석. 다중 시간대 지원. 맞춤형. 실시간 알림. 사용자 친화적 완벽함 원활한 호환성 이익:
비교할 수 없는 정밀성: 가장 뛰어난 공정가치 갭 지표를 손쉽게 파악할 수 있다는 사실을 알고 자신감을 가지고 결정을 내리세요. 최적화된 위험 관리: 자산의 실제 공정가치를 활용해 시장 조정을 파악하고 탁월한 정확성으로 위험을 관리합니다. 최고의 다재다능함: 데이 트레이딩, 스윙 트레이딩, 장기 투자 등 원하는 거래 스타일에 맞춰 지표를 맞춤 설정하세요. 다양한 시간대와 상
FREE
이 VWAP은 간단한 VWAP이지만 가격이 VWAP 라인에 도달하거나 VWAP 라인을 통과 할 때 알리는 알림이 통합되어 있습니다. 이 지표는 MetaTrader 4 (MT4)용 전통적인 VWAP 지표입니다. 기본 매개 변수는 일반적인 VWAP과 동일하지만 VWAP 계산 및 최적화를 수행할 수 있습니다. 가격이 VWAP에 닿거나 VWAP을 통과 할 때 경고, 휴대 전화 알림, 이메일 또는 소리 이벤트로 알림을받을 수 있습니다. MetaTrader 4용 VWAP 고정 지표 . 매개 변수: VWAP 주기 VWAP은 특정 시간 범위 내에서 계산됩니다. 전통적인 VWAP은 매일 새로운 분석을 시작하지만이 지표에서는이 옵션이 기본으로 제공되며 VWAP을 계산하기 위해 원하는 기간을 선택할 수 있습니다. 이는 M1에서 작동하더라도 H1에 대한 VWAP 계산을 시각화할 수 있음을 의미하며 H1에서의 각 새로운 막대에서 갱신됩니다. 이 계산 재시작은 선택한 시간 주기에 따라 발생합니다. 그러나 현
FREE

The Fair Value Gap (FVG) is a price range where one side of the market liquidity is offered, typically confirmed by a liquidity void on the lower time frame charts in the same price range. Price can "gap" to create a literal vacuum in trading, resulting in an actual price gap. Fair Value Gaps are most commonly used by price action traders to identify inefficiencies or imbalances in the market, indicating that buying and selling are not equal. If you're following the ICT Trading Strategy or Smart
FREE
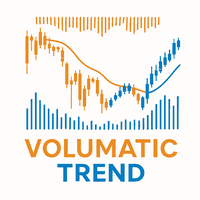
Volumatic Trend is a powerful, trend-following indicator that merges directional analysis with real-time volume behavior. By combining adaptive trend logic and volume overlays, it gives traders a detailed snapshot of market conviction and potential turning points. From instant trend shift detection to volume-weighted candle visuals, this tool brings deeper context to price movement. MT5 Version - https://www.mql5.com/en/market/product/136211/ Join To Learn Market Depth - https://www.mql5.com/
FREE
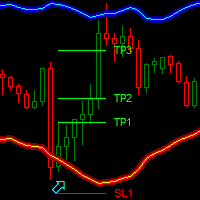
Dark Bands is an Indicator for intraday trading. This Indicator is based on Counter Trend strategy but use also Volatility. We can enter in good price with this Indicator, in order to follow the inversions on the current instrument.
Key benefits
Easily visible take profit/stop loss lines Reliable bands lines with futuristic colors, and Intuitive directional arrows Useful statistics , which indicate the win rate of the signals Plus Package available, leave a feedback to receive
FREE

The Area of Interest (AOI) Indicator is a powerful tool designed to help traders identify key market zones where price reactions are highly probable. This indicator specifically highlights two critical zones: Seller AOI (Area of Interest) : This zone represents areas where sellers are likely to enter the market, often acting as resistance. When the price approaches or touches this zone, it signals that a potential sell-off could occur. Buyer A OI (Area of Interest) : The BOI zone identifies re
FREE

MT5 version | Owl Smart Levels Indicator | Owl Smart Levels 전략 | FAQ
Fractals Indicator 는 Bill Williams 의 저자 거래 전략 요소 중 하나입니다. 가격 차트에서 가격 반전 지점을 검색하고 결과적으로 지원 및 저항 수준을 검색하는 데 사용됩니다. Full Fractals Indicator 는 거의 모든 거래 터미널의 툴킷에서 사용할 수 있는 개선된 Fractals입니다. 유일한 차이점은 프랙탈을 만들기 위해 기본 양초의 왼쪽에 5개의 양초와 오른쪽에 2개의 양초를 사용한다는 것입니다(그림 1 참조). 기본 구성 외에도 Full Fractals는 가격이 한동안 멈춘 수준을 찾습니다. Telegram 채팅: @it_trader_chat 새로운 Expert Advisor Prop Master - 트레이딩 터미널에서 테스트해보세요 https://www.mql5.com/ko/market/pro
FREE

무료이지만 고급 제품 개요 Turbo Trend는 트레이더가 시장 트렌드를 식별하고 이에 따라 행동할 수 있도록 도와주는 강력한 지표입니다. 이 지표는 고급 이동 평균과 거래량 분석을 결합하여 트렌드 방향에 대한 명확한 신호를 제공합니다. Turbo Trend는 시장 상황을 상승 추세 , 하락 추세 및 중립 추세의 세 가지 명확한 상태로 분류하여 쉽게 구별할 수 있는 색상 코딩된 선과 캔들 강조 표시를 사용하여 의사 결정을 단순화합니다. mql5 커뮤니티에서 Koala Trading Solution 채널 에 가입하여 Koala 제품에 대한 최신 뉴스를 확인하세요. 가입 링크는 아래에 있습니다: https://www.mql5.com/en/channels/koalatradingsolution 다른 좋은 무료 도구 방문하기: FVG 인디케이터 : https://www.mql5.com/en/market/product/108907 Turbo Trend 기반 EA가 현재 시장에서 이용
FREE

Crystal Smart Volume 개요 Crystal Smart Volume은 MT4용으로 개발된 고급 거래량(Volume) 및 델타(Delta) 분석 지표입니다.
이 인디케이터는 일반적인 가격 움직임 뒤에 숨겨진 기관 트레이더의 거래 활동을 시각적으로 파악할 수 있도록 설계되었습니다.
Smart Money Concepts (SMC) , Volume Spread Analysis (VSA) , 그리고 Delta 논리 를 결합하여 가격과 거래량의 상호 작용을 정밀하게 분석합니다.
이 도구는 Buying Climax(매수 클라이맥스) , Selling Climax(매도 클라이맥스) , Weak Candle(약한 캔들) , High-Volume Reversal(고거래량 반전) 등의 핵심 이벤트를 감지하여, 트레이더가 잠재적 전환점을 높은 정확도로 식별할 수 있게 합니다. 또한, TBR (Trap Break Reversal) , STBR (Sweep Trap Break Reversal)
FREE
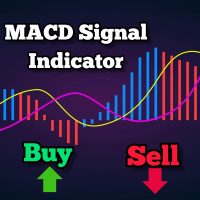
이것은 MACD를 기반으로 한 추세 추종 지표로, 200 MA를 기준으로 상위에 있을 때 매수 신호를 제공하고 하위에 있을 때 매도 신호를 제공합니다. MACD가 제로 라인을 교차할 때 신호가 생성됩니다. 이 지표는 또한 서포트 및 레지스턴스 레벨을 표시하며 이는 손절로 사용될 수 있습니다. 조절 가능한 매개 변수에는 MA 기간, MACD 빠른 EMA, 느린 EMA 및 서포트-레지스턴스 간격이 포함됩니다. 최근 양봉의 최저점과 최고점에 플로팅됩니다. 기본 설정: SR 간격: 10 MA 기간: 200 빠른 EMA: 24 느린 EMA: 26 알람 기능도 포함되어 있습니다. 이러한 값의 수정은 더 빈번하거나 덜 빈번한 신호로 이어질 수 있으며 가장 효과적인 구성을 결정하기 위해 테스트하는 것이 권장됩니다. 1 또는 4시간 프레임이 권장되지만 어떤 시간 프레임에서도 작동할 수 있습니다. 이 지표는 Forex, 주식, 상품 등을 포함한 모든 거래 도구에서 작동합니다. 다른 제품도 여기에서 확
FREE

PPR 및 Engulfing 은 MetaTrader 4 (MT4) 거래 플랫폼의 통화 차트에서 "PPR" 및 "Engulfing" 패턴을 식별하도록 설계된 독특한 기술 지표입니다. 이러한 패턴은 잠재적인 추세 반전 또는 지속을 나타낼 수 있으며, 트레이더에게 시장 진입 및 퇴출을 위한 귀중한 신호를 제공합니다. 주요 특징: 자동 패턴 감지 : 지표는 PPR 및 Engulfing 패턴을 자동으로 식별하고 차트에 화살표로 표시합니다. 시각적 신호 : 녹색 위쪽 화살표는 매수 지점을 나타내고, 빨간색 아래쪽 화살표는 매도 지점을 나타냅니다. 사용자 정의 가능한 화살표 색상 : 사용자는 지표 설정을 통해 강세 및 약세 신호의 화살표 색상을 선택할 수 있습니다. 모드 선택 : 세 가지 작동 모드 – PPR만, Engulfing만, 또는 두 패턴을 동시에 분석합니다. 사용 방법: 차트에 추가 : 지표를 원하는 통화 쌍 또는 금융 상품의 차트에 적용합니다. 신호 분석 : 차트에서 화살표의 출현을
FREE
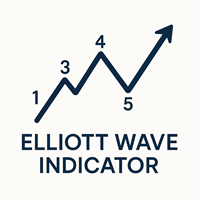
MetaTrader 4용 엘리엇 파동 이론 지표 엘리엇 파동 이론 지표는 전문적인 외환 시장 개념을 기반으로 설계되었습니다. 이 지표는 시장 구조를 파동으로 그려 1~5번 상승 및 하락 파동을 카운트합니다. 사용자는 파동 구조를 시각적으로 이해하고 새로운 번호가 생성될 때 알림을 받을 수 있습니다. 이 지표는 메인 파동과 서브 파동, 두 가지 유형을 지원하며 각각을 다른 색상으로 표시하거나 비활성화할 수 있습니다. 주요 기능 이중 파동 감지 : 메인 파동과 서브 파동을 동시에 감지하여 시장 움직임을 종합적으로 표시합니다. 자동 파동 번호 지정 : 고점 및 저점을 기반으로 1~5번 파동을 자동으로 표시합니다. 맞춤형 설정 : 메인 및 서브 파동에 대해 깊이, 편차, 되돌림 비율을 개별적으로 조정할 수 있습니다. 알림 시스템 : 특정 파동 번호에 도달할 때 알림을 받을 수 있습니다. 지표 설정 히스토리 제한 : 처리할 최대 캔들 수: 최대 분석 캔들 수를 설정합니다 (기본값: 1000)
FREE
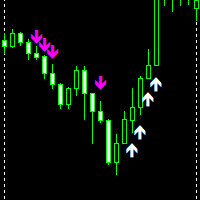
Up down Non-repaint is an MT4 indicator made to give accurate signals without disappearing. Magenta/Pink Arrow is your sell signal. white Arrow is your buy signal. indicator works on all pairs and timeframes 1 minute to Monthly timeframe. indicator is made for scalping do not hold trades for too long once arrows show the same direction you can add more entries all the best.!!
FREE

이 지표는 시장 반전 시점을 예측하는 가장 인기 있는 하모닉 패턴을 식별합니다. 이러한 하모닉 패턴은 외환 시장에서 지속적으로 반복되는 가격 형성이며 향후 가능한 가격 움직임을 제안합니다 / 무료 MT5 버전
또한 이 보조지표에는 시장 진입 신호와 다양한 이익실현 및 손절매 신호가 내장되어 있습니다. 하모닉 패턴 지표는 자체적으로 매수/매도 신호를 제공할 수 있지만 다른 기술 지표를 사용하여 이러한 신호를 확인하는 것이 좋습니다. 예를 들어, 매수/매도하기 전에 추세의 방향과 모멘텀의 강도를 확인하기 위해 RSI 또는 MACD와 같은 오실레이터를 사용하는 것을 고려할 수 있습니다.
이 인디케이터의 대시보드 스캐너: ( Basic Harmonic Patterns Dashboard )
포함된 하모닉 패턴 가틀리 버터플라이 박쥐 게 Shark Cypher ABCD
주요 입력 Max allowed deviation (%): 이 매개변수는 하모닉 패턴의 형성에 허용되는 허용 오차
FREE

멀티타임프레임 수급 히스토그램 (Multi-Timeframe Supply Demand Histogram)
설명:
멀티타임프레임 수급 히스토그램은 강력하고 깔끔한 지표로, H4와 D1과 같은 여러 시간대에서 시장의 수요와 공급 강도를 보여줍니다. 이 지표는 매수자나 매도자가 우세할 때를 히스토그램으로 시각화하여, 트레이더가 주요 시장 압력 영역을 빠르게 식별할 수 있게 합니다. 주요 기능: H4 & D1 히스토그램: 상위 시간대의 시장 강도를 명확하게 시각화. 히스토그램 변화 알림: 수요나 공급이 변할 때 선택적 알림 제공. 차트 혼잡 최소화: 가장 중요한 신호에만 집중. 맞춤형 표시: 시간대별 히스토그램 켜기/끄기 가능, 알림 선택적. 추천 15분 차트: 일중 스윙 트레이딩에 최적. 최적 조합: Ultimate Scalpers Zone 지표와 함께 사용할 때 다중 확인 진입에 최적. 장점: 높은 확률의 지지 및 저항 구간을 빠르게 식별 가능. 여러 시간대에서 시장 모멘텀을 한눈에
FREE
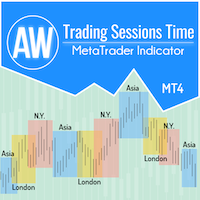
거래자가 시장 성과에 대한 데이터를 쉽게 얻고 거래 전략을 더 잘 수립할 수 있도록 거래 세션 지표를 개발했습니다. 다양한 거래소의 개장 시간은 시장 활동 및 거래량에 영향을 미치므로 거래에 영향을 미칩니다. 이러한 요소는 다양한 상품의 변동성과 거래 기회를 결정합니다. AW 거래 세션 표시기는 아시아, 런던 및 뉴욕 시장의 거래 시간을 표시합니다. 거래자는 더 나은 경험을 위해 다양한 시간대를 표시하거나 숨길 수 있습니다. 차트에서는 세션 종료까지의 시간과 거래 세션 규모를 확인할 수 있습니다. 차트의 데이터 표시에는 다양한 스타일의 거래 차트에 적합한 유연한 그래픽 조정 기능이 있습니다.
더 많은 제품 -> 여기
장점:
아시아, 런던, 뉴욕 거래 세션을 표시합니다. 필요한 경우 세션 크기를 숫자로 표시하고, 켜져 있으면 거래 세션이 끝날 때까지의 시간을 표시합니다. 거래 세션을 개별적으로 비활성화할 수 있습니다. 차트의 사용자 정의 가능한 세션 테두리 스타일 필요한 경우
FREE
This index is based on the secondary development of supertrend, adding the combination index of Ma mean line user-defined algorithm, NRP, MTF three index weighted realization function.
There are two colors in the batch marking, orange for short and green for long.
Supertrend index is the first artificial intelligence indicator in the whole network --- signal light trading strategy.
It imitates the uncertain concept judgment and reasoning thinking mode of human brain. For the description
FREE

The Market Sessions indicator is a popular tool among forex and stock traders for visually representing global trading sessions on a price chart. It highlights the time periods for major trading sessions — such as the Asian (Tokyo) , European (London) , and American (New York) sessions — directly on the chart. This helps traders identify when markets open and close, allowing for better decision-making based on session-specific trading behavior. - Asian Session (Default: 00:00-09:00) - Lo
FREE
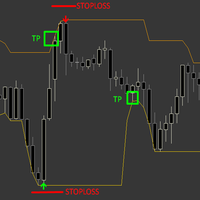
The Sure Reverse Channel is a dynamic non repaint trend indicator with entry arrows, the indicator focuses on catching a reverse swing in the market by using channel and price action formula, the indicator comes with built-in money management . HOW TO TRADE : Open buy trade when buy arrow pops up and set your SL below arrow, for TP you have TP which is opposite band. Open sell trade when sell arrow pops up and set your SL above arrow, for TP you have TP which is opposite band. band.
Why is
FREE
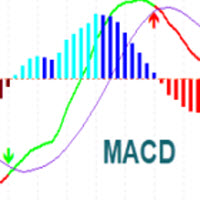
MACD Indicator It has MACD line, Signal line, and Histogram. The Histogram has 4 colors based on Direction Above and Below the Zero Line, showing its movement direction as simple as possible. Allows Show MACD & Signal Line, Show Change In color of MACD Line based on cross of Signal Line. Show Dots at Cross of MacD and Signal Line, Turn on and off Histogram. Enjoy your trading experience, and feel free to share your comments and reviews.
If you are interested in this indicator, you might
FREE

Special offer : ALL TOOLS , just $35 each! New tools will be $30 for the first week or the first 3 purchases ! Trading Tools Channel on MQL5 : Join my MQL5 channel to update the latest news from me Supertrend Fakeout 지표는 기존의 Supertrend 지표를 개선한 버전으로, 더 신뢰할 수 있는 추세 신호를 제공하도록 설계되었습니다. Fakeout Index Limit 와 Fakeout ATR Mult 와 같은 고급 기능을 통합하여 단기 가격 변동이나 시장 노이즈로 인해 발생하는 잘못된 추세 반전을 필터링하는 데 도움을 줍니다. MT5 버전에 대해 자세히 알아보기: Supertrend Fakeout MT5 다른 제품 보기: 모든 제품 작동 원리 Supertrend Fakeout 지표는
FREE
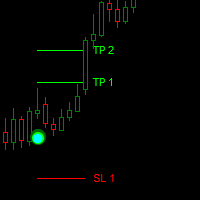
Dark Point is an Indicator for intraday trading. This Indicator is based on Trend Following strategy, also adopting the use of the atr to determine the right volatility. We can enter in good price with this Indicator, in order to follow the strong trend on the current instrument. If you love Dark Point, consider adding some power: Dark Power
Key benefits
Easily visible take profit/stop loss lines Intuitive directional points/arrows by colors Useful statistics , which indicate the win ra
FREE

기본 렌코 지표는 명확하고 간결한 시장 관점을 찾는 트레이더를 위한 강력한 도구입니다. 이 인디케이터는 추세 시각화를 단순화할 뿐만 아니라 반전에 대한 정확한 알림을 제공하여 거래에서 전략적 우위를 제공합니다 / 무료 MT5 버전
특징 완전 사용자 지정 가능: 고급 사용자 지정 옵션으로 비즈니스 선호도에 맞게 지표를 조정할 수 있습니다. 색상부터 박스 크기 설정까지 차트에 정보가 표시되는 방식을 완벽하게 제어할 수 있습니다. 반전 알림: 반전 알림: 반전 알림을 통해 시장 방향의 잠재적 변화에 대해 가장 먼저 알아보세요. 이를 통해 정보에 입각한 시기적절한 결정을 내려 수익을 극대화하고 손실을 최소화할 수 있습니다.
입력 Size of the boxes: 박스 크기(포인트 기준) Bullish box colour: 상승 박스 색상 Bearish box colour: 약세 상자 색상 Box opacity: 불투명도(0~100 사이)입니다. 불투명도가 낮아질수록
FREE
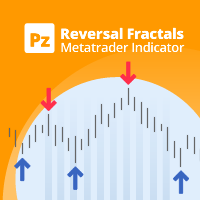
이것은 거의 10년 전에 처음으로 출판된 나의 유명한 지표인 Reversal Fractals의 최신 버전입니다. 그것은 프랙탈의 가격 구조를 조사하여 시장에서 가능한 반전 지점을 결정하고 이미 기본 또는 기술 평가 모델을 가지고 있는 포지션 트레이더에게 타이밍을 제공합니다. [ 설치 가이드 | 업데이트 가이드 | 문제 해결 | 자주하는 질문 | 모든 제품 ] 반전 프랙탈은 긴 추세를 시작할 수 있습니다 표시기는 다시 칠하지 않음
모든 종류의 경고를 구현합니다. 사용자 정의 가능한 색상 및 크기 이 표시기는 반응적이거나 지연되는 신호입니다. 왜냐하면 aa 프랙탈은 그 형성에서 가장 높거나 낮은 중간 막대인 홀수의 막대 형성이고, 표시기는 프랙탈의 모든 막대가 닫힐 때 그려지기 때문입니다. 그러나 기존의 방향성 편향이 있는 트레이더는 이 지표가 초기 진입점을 선택하는 데 매우 유용하다는 것을 알게 될 것입니다. 이 지표는 요약된 신호 지표나 완전한 거래 시스템이 아닙니다. 그런 식으로
FREE

Simple QM Pattern is a powerful and intuitive trading indicator designed to simplify the identification of the Quasimodo (QM) trading pattern. The QM pattern is widely recognized among traders for effectively signaling potential reversals by highlighting key market structures and price action formations. This indicator helps traders easily visualize the QM pattern directly on their charts, making it straightforward even for those who are new to pattern trading. Simple QM Pattern includes dynamic
FREE

A trend indicator based on the Hull Moving Average (HMA) with two periods. The Hull Moving Average is an improved variant of the moving average, which shows the moment of trend reversal quite accurately. It is often used as a signal filter. Combination of two types of Hull Moving Averages makes a better use of these advantages: HMA with a slow period identifies the trend, while HMA with a fast period determines the short-term movements and signals in the trend direction.
Features The movement d
FREE

It is FREE on EURUSD chart. All Symbols version! Contact me for any questions Introduction The breakout and retest strategy is traded support and resistance levels. it involves price breaking through a previous level. The break and retest strategy is designed to help traders do two main things, the first is to avoid false breakouts. Many false breakouts start with a candlestick that breaks out of a level but ends with an immediate candlestick that brings the price back into the level. The
FREE

외환 시장 프로필(줄여서 FMP) 이것이 아닌 것 :
FMP는 일반적인 문자 코드 TPO 표시가 아니며 전체 차트 데이터 프로필 계산을 표시하지 않으며 차트를 기간으로 분할하여 계산하지도 않습니다.
그것이 하는 일:
가장 중요한 것은 FMP 표시기가 사용자 정의 스펙트럼의 왼쪽 가장자리와 사용자 정의 스펙트럼의 오른쪽 가장자리 사이에 있는 데이터를 처리한다는 것입니다. 사용자는 마우스로 표시기의 양쪽 끝을 당기기만 하면 스펙트럼을 정의할 수 있습니다. 표시기 오른쪽 가장자리가 라이브 막대로 당겨지고 더 멀리(미래로) 표시되면 표시기가 "라이브"로 간주됩니다(새 막대로 업데이트됨). 표시기는 첨부된 차트에 "앵커" 개체를 놓은 다음 해당 앵커를 하드 드라이브의 파일과 연결합니다. 이렇게 하면 차트 또는 지표가 닫힐 때까지 다시 시작해도 설정이 유지되어 차트에서 계속 FMP를 실행할 수 있습니다. FMP 지표는 하나의 차트에서 여러 인스턴스를 실행할 수 있으며 이름을 지정할 수
FREE

설명 (MT4)
이 지표는 캔들이 볼린저 밴드 외부로 벗어난 후 가격이 다시 내부로 재진입하는 순간을 탐지하며, 잘못된 신호를 줄이기 위해 선택적으로 RSI 확인을 결합합니다.
Buy ReEntry 신호는 가격이 하단 밴드 아래로 내려갔다가 다시 내부로 복귀할 때 생성되며, 선택적으로 RSI가 과매도 상태에서 벗어났음을 확인합니다.
Sell ReEntry 신호는 가격이 상단 밴드 위로 상승했다가 다시 내부로 복귀할 때 생성되며, 선택적으로 RSI가 과매수 상태에서 벗어났음을 확인합니다.
신호는 차트 위에 화살표로 표시되며, 시각적 명확성을 위해 고점/저점 바깥쪽에 약간 오프셋되어 그려집니다. 주요 특징 볼린저 밴드의 수동 계산 (단순 이동평균 + 표준편차). 유효한 재진입을 확인하기 위한 선택적 RSI 필터 (과매도/과매수 탈출). 외부 이동 후 밴드 내부로 가격이 재진입할 때 생성되는 Buy/Sell ReEntry 신호. 매수와 매도 신호를 구분한 화살표 시각화. 완전히 구성 가
FREE

기본 캔들 패턴 인디케이터를 사용하면 주요 캔들 패턴을 그 어느 때보다 쉽게 식별할 수 있습니다. 해머, 이브닝 스타, 삼백수형 등 다양한 패턴을 차트에서 한 눈에 확인할 수 있습니다. 직관적인 인터페이스와 명확한 시각적 신호를 통해 빠르고 정확하게 거래 기회를 식별할 수 있습니다 / MT5 버전
이 보조지표용 대시보드 스캐너: ( Basic Candlestick Patterns Dashboard )
특징 정확성 : 주요 캔들 패턴을 자동으로 식별하여 수동 검색이 필요 없습니다. 사용자 지정 : 사용자 지정: 트레이딩 스타일에 맞게 트레이딩 선호도에 따라 매개변수를 조정할 수 있습니다.
하모닉 패턴 포함 상승 패턴 Hammer Inverse hammer Bullish engulfing Morning star 3 White soldiers 약세 패턴 Hanging man Shooting star Bearish engulfing Evening star 3 Black crows
FREE
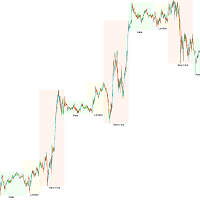
트레이딩 세션 KillZone — 시장 타이밍의 힘을 해방시키다
성공적인 트레이더들은 하나의 진실을 알고 있습니다: 타이밍이 전부라는 것. 각 트레이딩 세션은 다른 활동성, 변동성, 그리고 기회를 제공합니다. 이러한 변화를 명확히 파악하고 활용할 수 있도록 Trading Session KillZone 인디케이터를 만들었습니다. 이 인디케이터는 아시아, 런던, 뉴욕 세션의 활발한 시간을 강조 표시하여 시장이 가장 살아 있는 시점을 완벽하게 보여줍니다. 특정 세션 표시/숨기기, 세션 이름 추가/제거, 색상 변경, 차트에서 보이는 KillZone 개수 설정까지 자유롭게 커스터마이즈할 수 있습니다. 프로 팁: KillZone 트레이딩의 힘을 극대화하려면 올바른 브로커도 필요합니다. 그래서 저는 IC Markets 를 추천합니다. 신뢰할 수 있는 ECN 브로커로, 초저스프레드(0.0핍부터), 번개 같은 체결 속도, 깊은 유동성을 제공합니다. IC Markets와 함께라면 이 인디케이터가
FREE

Introducing our exciting new Price Retest indicator! Get instant alerts when the price retests, giving you a powerful edge in your trading strategy. Remember to do your own analysis before making any moves in the market. MT5 Version - https://www.mql5.com/en/market/product/118159/ Join To Learn Market Depth - https://www.mql5.com/en/channels/suvashishfx
Here’s a detailed explanation of how the Price Retest indicator works, its components, and how you can incorporate it into your trading str
FREE
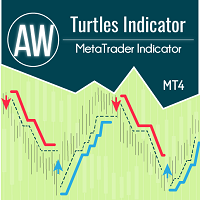
이 지표는 Turtle 시스템에 따라 작동하며 일반적으로 20개와 55개 양초의 시간 간격을 가정합니다. 특정 시간 간격에 걸쳐 추세가 모니터링됩니다. 지지선이나 저항선이 무너지는 순간 진입이 이루어집니다. 출구 신호는 동일한 시간 간격의 추세와 반대 방향의 가격 돌파입니다. 장점:
상품: 통화쌍, 주식, 상품, 지수, 암호화폐 기간: 기본적으로 D1이며 모든 기간 작업에도 적합합니다. 거래시간 : 24시간 내내 자금 관리 전략: 거래당 위험은 1% 이하 추가 주문을 사용할 경우 각 추가 포지션에 대한 위험은 0.25%입니다. MT5 indicator version -> HERE / AW Turtles EA MT4 -> HERE / More products -> HERE 참가 규칙: 1) 단기 입학: 진입 조건은 20일 최고가 또는 최저가를 돌파하는 것입니다.
이전 신호가 성공하면 거래를 건너뜁니다.
메모! 이전 거래가 수익으로 종료된 경우 해당 항목을 건너뜁니다
FREE
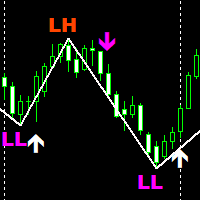
SMC Traders is a non-repaint indicator that is based on Price Action The indicator uses current market structure to predict future reversals. The indicator can be used with our free Market structure zig zag which can be found here: https://www.mql5.com/en/market/product/91579 Please note to find the HH AND HL CLINK ON LINK ABOVE Timeframes: 15 minutes for scalping 1 Hour for swing trading Purple Arrow look for sells in conjunction with LL White Arrow look for buys in conjunction with HL
FREE

차트에 수동으로 피보나치 레벨을 그리는 데 지쳤습니까? 거래에서 주요 지지선과 저항선을 식별할 수 있는 편리하고 효율적인 방법을 찾고 계십니까? 더 이상 보지 마세요! 자동 피보나치 수준 을 수행하는 최고의 MetaTrader 4 지표인 DrawFib Pro를 소개합니다. 차트에 그림을 그리고 이러한 수준이 위반되면 적시에 경고를 제공합니다. DrawFib Pro를 사용하면 거래 전략을 강화하고 시간을 절약하며 정보에 입각한 결정을 내릴 수 있습니다. 내 피보나치 기반 지표: WH Advanced Gartley Pattern MT4 || WH Price Wave Pattern MT4 주요 특징들:
자동화 피보나치 그리기. 사용자 정의 가능 매개변수 . 정확한 그리고 믿을 수 있는. 실시간 경고. 사용자 친화적 인터페이스. DrawFib Pro는 효율적이고 신뢰할 수 있으며 사용자 친화적인
FREE

MT4 시장 구조 변화 및 공정 가치 갭(FVG) 지표 이 MT4 지표는 시장 구조 변화와 공정 가치 갭(FVG)을 식별하여 트레이더에게 잠재적인 거래 기회를 제공합니다. 모바일 알림을 통해 이러한 이벤트를 사용자에게 경고하여 변화하는 시장 상황에 신속하게 대응할 수 있도록 합니다. 주요 특징: 시장 구조 변화 감지: 스윙 고점/저점 돌파와 평균 대비 유의미한 캔들 몸통 크기를 기반으로 강세 및 약세 시장 구조 변화를 식별합니다. 차트의 위/아래 화살표로 시각화됩니다. 공정 가치 갭(FVG) 식별: 최근 3개 캔들의 가격 움직임을 기반으로 강세 및 약세 FVG를 감지합니다. FVG는 차트에서 색칠된 사각형으로 강조 표시됩니다. 모바일 알림: 시장 구조 변화와 FVG 형성 모두에 대한 실시간 모바일 알림을 수신하여 잠재적인 거래 설정을 놓치지 않도록 합니다. 사용자 정의 가능한 매개변수: 관찰 기간 (Lookback Period): 스윙 고점/저점 계산을 위한 관찰 기간을 조정하여
FREE

"Ppr PA" is a unique technical indicator created to identify "PPR" patterns on the currency charts of the MT4 trading platform. These patterns can indicate possible reversals or continuation of the trend, providing traders with valuable signals to enter the market.
Features: Automatic PPR Detection: The indicator automatically identifies and marks PPR patterns with arrows on the chart. Visual Signals: Green and red arrows indicate the optimal points for buying and selling, respectively. Ar
FREE

Auto Fibo 는 수동 거래를 향상시키기 위해 개발된 지표입니다. 자동으로 황금 비율을 그려 시간을 절약하고 거래를 촉진합니다. 지표를 그래프에 부착하면 정확한 황금 비율이 자동으로 그려지므로 임계점을 찾아야 하는 수고를 덜 수 있습니다. 인터페이스는 컴퓨터에 따라 밴드의 대략적인 고점과 저점으로 조정됩니다. 이 표시기는 대부분의 시작 및 끝 지점 선택 오류를 수정합니다. 각 밴드에 대해 정확한 가격이 표시됩니다. 警告 私はMQL5.com으로 私のEAを販売するだけ입니다.もし誰かが私のEAを売ってくれと連絡してきたら、それはああにの金が また、もしあなたが私のEAを 外部のウェブサイトから購入した場合、それ는 偽의 바 죤으로 あ り, original의 ゝ と 同じ よ に は 動作 ないこ
FREE

이동 평균 수렴 발산(MACD) 거래 전략은 추세와 흐름 방향의 변화를 식별하는 데 사용되는 인기 있는 기술 분석 도구입니다. MACD는 12기간의 지수 이동 평균(EMA)에서 26기간의 EMA를 빼서 계산됩니다. "신호 선"이라고 불리는 9기간의 EMA는 MACD 위에 표시되어 매수 및 매도 신호를 트리거로 작용합니다. MACD 선이 신호 선 위에 있으면 매수 트렌드로 간주되고, 신호 선 아래에 있으면 매도 트렌드로 간주됩니다. 거래자들은 종종 이 정보를 사용하여 잠재적인 매수 및 매도 기회를 파악합니다. MACD는 다양한 방식으로 사용될 수 있는 다재다능한 지표입니다. 일반적으로 사용되는 몇 가지 방법은 다음과 같습니다. 교차: MACD 선이 신호 선 위로 크로스되면 매수 교차가 발생하고, MACD 선이 신호 선 아래로 크로스되면 매도 교차가 발생합니다. 발산: MACD가 새로운 고점을 형성하면서 기초 자산이 그렇지 않은 경우 매수 발산이 발생하고, MACD가 새로운 저점을 형성
FREE

Title: SMC Structure for EURUSD Description: This indicator is designed to map market structures based on Smart Money Concepts (SMC). It identifies Swing Structure, Internal Structure, Order Blocks, and Fair Value Gaps (FVG). The tool is optimized for performance to manage resources efficiently on the MetaTrader platform. Key Features: 1. Market Structure Mapping Identifies Major Swing Structure with BOS (Break of Structure) and CHoCH (Change of Character). Displays Internal Structure to visual
FREE

Trading doesn’t have to be complicated. With the right visual guidance, market decisions become clearer, calmer, and more confident.
Nebula Arrow is designed to help traders focus on what truly matters: high-quality entries based on refined market behavior. Just load it on your chart and let the arrows guide your trading decisions. Trade With Confidence We believe that simplicity is power. Nebula Arrow was created after extensive market observation and practical research, transforming complex
FREE

The indicator analyzes the volume scale and splits it into two components - seller volumes and buyer volumes, and also calculates the delta and cumulative delta. The indicator does not flicker or redraw, its calculation and plotting are performed fairly quickly, while using the data from the smaller (relative to the current) periods. The indicator operation modes can be switched using the Mode input variable: Buy - display only the buyer volumes. Sell - display only the seller volumes. BuySell -
FREE

MT5 버전 | Trend Monitor VZ 표시 | Owl Smart Levels 표시 | Owl Smart Levels 전략 | FAQ 엘리엇 웨이브 이론은 가격 차트에 파도의 시각적 모델에 의존하는 금융 시장의 프로세스의 해석이다. 평가 가능한 지그재그 표시기는 시장의 파동 구조를 표시하며,이는 거래 결정을 내리는 데 사용할 수 있습니다. 평가 가능한 지그재그 표시등이 더 안정적이며 종종 고전적인 지그재그 표시와 같은 방향을 변경하지 않습니다,오해의 소지가있는 상인. 이 지표파의 건설에 도형의 사용을 통해 달성된다. Telegram 채팅: @it_trader_chat 새로운 Expert Advisor Prop Master - 트레이딩 터미널에서 테스트해보세요 https://www.mql5.com/ko/market/product/115375
평가 가능한 지그재그는 주로 추세 지표입니다. 그것은 상인이 거래해야하는 주요 방향을 설정하지만 시장 진입의 지표
FREE

MACD indicator in MetaTrader 4/5 looks different than MACD does in most other charting software. That is because the MetaTrader 4/5 version of MACD displays the MACD line as a histogram when it is traditionally displayed as a line. Additionally, the MetaTrader 4/5 version computes the Signal line using an SMA, while according to MACD definition it is supposed to be an EMA. The MetaTrader 4/5 version also does not compute a true MACD Histogram (the difference between the MACD/Signal lines). This
FREE
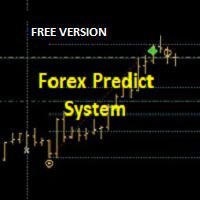
Hi Trader, ================================================================================ If you like my indicator, please do not hesitate to give a review and/or comment. Thank you! ================================================================================
This indicator draws trade entry zone and target levels based on the levels of the previous day.
A blue zone (BUY) or red zone (SELL) is drawn and two targets. The optimal trade entry value is also indicated.
A second gray zone is
FREE

Wave Reversal Indicator - determines the direction of trend waves and price reversals.
The indicator shows wave movements and trend directions. It gives recommendations where to follow the trader, helps to follow the trading strategy.
It is an addition to an intraday or medium-term strategy.
Almost all parameters are selected for each time frame and are changed automatically, the only parameter for manual adjustment is the wavelength.
Works on various trading instruments and timeframes, recomme
FREE
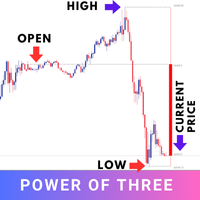
The "Power of Three" (PO3) is a concept developed by the Inner Circle Trader (ICT) to illustrate a three-stage approach used by smart money in the markets: Accumulation, Manipulation, and Distribution . ICT traders view this as a foundational pattern that can explain the formation of any candle on a price chart. In simple terms, this concept is effective for any time frame, as long as there's a defined start, highest point, lowest point, and end. MT5 - https://www.mql5.com/en/market/product/124
FREE

TrendSeeker 대시보드 ― 고확률 트레이드를 위한 스마트 시장 필터 TrendSeeker 대시보드 는 횡보장을 피하고 H4 타임프레임 에서 고품질 트렌드 종목에만 집중할 수 있도록 설계된 강력한 다중 심볼 시장 분석 도구입니다. 대시보드는 사용 가능한 모든 심볼을 지속적으로 스캔하며, 각 종목을 다음과 같이 분류합니다: 상승 추세 (Trending UP) 하락 추세 (Trending DOWN) 횡보장 / 거래 비추천 (Ranging / No-Trade) EMA를 통한 추세 방향, ADX를 통한 추세 강도, ATR을 통한 변동성을 결합하여 TrendSeeker는 실제 모멘텀이 존재하는 시장과 거래를 피해야 하는 시장을 즉시 시각화합니다. TrendSeeker 사용법 단독 도구로 사용 TrendSeeker는 시장 스캐너이자 방향성 바이어스 대시보드로 단독 사용이 가능하며, 다음을 수행할 수 있습니다: 트렌드 종목을 한눈에 확인 낮은 확률의 횡보장 회피 거래 전 명확한 방향성 구축
FREE

This indicators automatically draws the Trend Channels for you once you've dropped it on a chart. It reduces the hustle of drawing and redrawing these levels every time you analysis prices on a chart. With it, all you have to do is dropped it on a chart, adjust the settings to your liking and let the indicator do the rest. Get an alternative version of this indicator here: https://youtu.be/lt7Wn_bfjPE For more free stuff visit: https://abctrading.xyz
Parameters 1) Which trend do you want t
FREE
트레이딩 전략과 기술 지표를 판매하기에 가장 좋은 장소가 왜 MetaTrader 마켓인지 알고 계십니까? 광고나 소프트웨어 보호가 필요 없고, 지불 문제도 없습니다. 모든 것이 MetaTrader 마켓에서 제공됩니다.
트레이딩 기회를 놓치고 있어요:
- 무료 트레이딩 앱
- 복사용 8,000 이상의 시그널
- 금융 시장 개척을 위한 경제 뉴스
등록
로그인
계정이 없으시면, 가입하십시오
MQL5.com 웹사이트에 로그인을 하기 위해 쿠키를 허용하십시오.
브라우저에서 필요한 설정을 활성화하시지 않으면, 로그인할 수 없습니다.