MetaTrader 4용 기술 지표 - 28

Hypothetical trend line display
Distance from the trend line
Can be used in all symbols
Can be used in all time frames
An interesting indicator for predicting small waves
The greater the distance from the trend line, the more likely it is to return to the trend line
Settings:
The first three(osic 1,2,3):
are the same as the settings of the zigzag indicator
The bigger these numbers are, the bigger the trend lines and the longer the trend
Back Show:
The number of candles displayed
Clr1,2:
The
FREE

Long Term trend analyzer according to proprierty Algorithm and multiple EMA. Works best on H1-H4 Time Frame. We are using this indicator in our Main Fund. Ready to use.
- Setup in any Pair, Equity - H1-H4 Timeframe - Best during main Trading times like Asian-European-American Time - NON REPAINTING
Analyze long term trend. Comes with Alarm, Notifications, Push Signals. Get a signal and enter the Markets.
FREE

Price Difference 표시기는 시가와 종가의 차이를 보여줍니다. 별도의 창에 표시되는 표시는 현재 막대의 시가와 이전 막대의 종가 간의 차이입니다. 왼쪽 상단의 보드는 현재 막대의 시가와 종가의 차이입니다.
설정 Count_Bars - 표시기 데이터를 표시할 막대 수, 0에서는 사용 가능한 모든 막대에 표시됩니다. 표시 - 디지털 값 표시를 활성화합니다. _fontsize - 별도의 창에 있는 표시기의 글꼴 크기. color_up - 별도의 창에 있는 표시기에 대한 양수 값의 색상. color_dn - 별도의 창에 있는 표시기에 대한 음수 값의 색상. color_txt - 스코어보드의 마침표 이름 색상. _angle - 별도의 창에서 표시기에 대한 텍스트의 경사 각도. 0 - 별도의 창에서 표시기에 대한 텍스트의 자동 증가.
FREE

Simulator for Risk / Reward ratio calculator We-RiskReward is a MT4 indicator made by the We-Trading team to simulate an order with Risk / Reward calculator.
Horizontal Lines This indicator show you 3 horizontal lines that are: Open line Take Profit line Stop Loss line You can move the lines and you will see R/R and Lots calculation in real time. You can use it to simulate Long and Short positions.
Indicator parameters As input parameters you need to check only the Risk for trade. For e.g. you
FREE

Pullback Viewer is designed to show valid pullback points in a bearish or bullish trend.
What is considered a valid pullback?
A valid pullback needs to have a body close outside the previous candle high (in a bearish trend ) or previous candle low (in a bullish trend ). If the candle wicks out the previous candle, it's not a valid pullback.
Pullback must liquidate the previous candle with a clean candle body close.
When is this indicator useful?
It's useful to understand and
FREE

Unleash Your Trading Potential with Momentum Strength Signal! Tired of lagging indicators and confusing market noise? Momentum Strength Signal is the cutting-edge tool built to give you a decisive edge by focusing on what truly drives prices: pure market force . This isn't just another average indicator; it's a dynamic system that identifies the exact moment a trend begins and confirms its validity, helping you enter and exit trades with confidence. Why You Need This Powerhouse Indicator: Preci
FREE

제품 제목 Smart Momentum (MT4) – SmartView 시리즈의 일부 간단한 설명 MetaTrader 플랫폼에서 독특한 사용자 경험을 제공하는 Momentum 지표입니다. 이전에 사용할 수 없었던 고급 기능을 제공하며, 더블 클릭으로 설정 열기, 삭제하지 않고 지표 숨기기/표시하기, 지표 창을 전체 차트 크기로 표시하기 등의 기능을 포함합니다. SmartView Indicators 시리즈의 나머지 부분과 원활하게 작동하도록 설계되었습니다. 개요 SmartView 시리즈는 혁신적인 기능을 통해 MetaTrader 플랫폼의 지표에 독특하고 독특한 사용자 경험을 제공하여 지표 관리를 더 빠르고 쉽게 만듭니다. 각 지표는 차트에 스마트 제어 패널이 장착되어 있어 필수 정보를 표시하고 모든 중요한 기능에 빠르게 액세스할 수 있습니다. 이전에 사용할 수 없었던 고유한 기능 SmartView 시리즈는 지표 작업을 더 쉽고 빠르게 만드는 고급 기능을 제공합니다: 더블 클릭으로 설정
FREE

제품 제목 Smart CCI (MT4) – SmartView 시리즈의 일부 간단한 설명 MetaTrader 플랫폼에서 독특한 사용자 경험을 제공하는 CCI 지표입니다. 이전에 사용할 수 없었던 고급 기능을 제공하며, 더블 클릭으로 설정 열기, 삭제하지 않고 지표 숨기기/표시하기, 지표 창을 전체 차트 크기로 표시하기 등의 기능을 포함합니다. SmartView Indicators 시리즈의 나머지 부분과 원활하게 작동하도록 설계되었습니다. 개요 SmartView 시리즈는 혁신적인 기능을 통해 MetaTrader 플랫폼의 지표에 독특하고 독특한 사용자 경험을 제공하여 지표 관리를 더 빠르고 쉽게 만듭니다. 각 지표는 차트에 스마트 제어 패널이 장착되어 있어 필수 정보를 표시하고 모든 중요한 기능에 빠르게 액세스할 수 있습니다. 이전에 사용할 수 없었던 고유한 기능 SmartView 시리즈는 지표 작업을 더 쉽고 빠르게 만드는 고급 기능을 제공합니다: 더블 클릭으로 설정 열기: 지표 목록을
FREE

4H Open Line Indicator - Settings Overview This custom indicator is used to draw and visualize the opening price , midline , and high/low ranges of 4-hour candles on smaller timeframes. It's particularly useful for intraday traders who want to see higher-timeframe levels. Indicator Inputs and Descriptions Parameter Value Description OpenLineColor White Color of the line indicating the open price of the 4H candle. OpenLineWidth 1 Width of the open price line. OpenLineStyle Solid Line style
FREE

The Stochastic RSI indicator (StochRSI) is essentially an indicator of an indicator. It is used in technical analysis to provide a stochastic calculation to the RSI indicator. This means that it is a measure of RSI relative to its own high/low range over a user defined period of time. The Stochastic RSI is an oscillator that calculates a value between 0 and 1 which is then plotted as a line. This indicator is primarily used for identifying overbought and oversold conditions.
FREE

In the indicator there are EUR, USD, CAD, AUD, NZD,JPY, GBP ,CHF.
The Currency Index Project is Forex study. Many people do not know the theoretical basis that drives currency exchange rates to move on the market. With this set of tools you will be able to have a more complete view of the entire market by analyzing not only the single currency of an exchange, but all the exchange rates that make up that currency by looking at a single window! The study assumes that all forex currencies are lin
FREE

Summary This indicator is based on RSI and Momentum indicators. It also considers moving averages of these two indicators. The three indicators have adjustable settings. The arrows do not repaint since the indicator only uses confirmed values and waits for the candle to close before painting an arrow. The indicator is also able to alert when arrows appear. There are 3 types of alerts - Popup, Email and Mobile Push Notifications. The arrows can be used in the EA and the inputs can also be optimiz
FREE

Monitors the current trend, gives signals for an uptrend, downtrend and weakening of the current trend. Colors the situation on the market with the appropriate color. Tool - any. Timeframe - any. Advantages The indicator does not repaint its signals. There are alert signals. Easy to use. Flexible settings. Suitable for trading any financial instruments. Settings Name Description Fast parameter The value of the fast parameter in the indicator (Should be less than the slow one). Slow parameter The
FREE

Overview:
The Coloured Parabolic SAR Indicator is a visually enhanced trading tool designed to make trend-following and trade identification easier. This customizable indicator provides clear visual cues with color-coded signals for bullish (buy) and bearish (sell) trends directly on your MT4 chart. Key Features: Color-Coded Signals : Lime green "o" symbol for Buy signals. Red "o" symbol for Sell signals. Customizable Inputs : Adjustable Step and Maximum parameters to fine-tune the Parabolic SA
FREE

Wavetrend Oscillator Indicator — Version 1.0 The Wavetrend Oscillator is a momentum-based technical analysis tool. It is designed to highlight potential momentum shifts, areas that may be overbought or oversold, and the prevailing bias when confirmed by a higher timeframe filter. How it works WT1 and WT2 Lines : Crossovers between these lines are used to indicate changes in momentum. WT1 crossing above WT2 suggests bullish conditions. WT1 crossing below WT2 suggests bearish conditions. WT3 High
FREE

The " Multi Kernel Regression " is a versatile trading indicator that provides graphical interpretations of market trends by using different kernel regression methods. It's beneficial because it smoothes out price data, creating a clearer picture of price movements, and can be tailored according to the user's preference with various options.
What makes this indicator uniquely versatile is the 'Kernel Select' feature, which allows you to choose from a variety of regression kernel types, such as
FREE

This indicator identifies pinbar candlesticks on the chart and displays an arrow as a trade signal based on the candlestick pattern. It offers user-friendly features, including push notifications and other types of alerts. It is most effective for identifying entry points or potential reversals at premium or discount prices. Additionally, it works on any time frame.
FREE

The VMA is an exponential moving average that adjusts its smoothing constant on the basis of market volatility. Its sensitivity grows as long as the volatility of the data increases. Based on the Chande's Momentum Oscillator, the VMA can automatically adjust its smoothing period as market conditions change, helping you to detect trend reversals and retracements much quicker and more reliable when compared to traditional moving averages.
FREE

X-axis lines prevail in grid manner, ruled by Average True Range. There’s an inevitable change in specific periods of time of this matter! The Average True Range (ATR) indicator is not directly based on volume; instead, measures volatility in price movements. This indicator original in its revealing customization, stretches, expand, shrink, and evolve with 4 timely choices of grid states! MATR means “multiplying average true range” in which grandeurs the grid pip-distant levels, seeming to g
FREE

MP Price Change Indicator is a tool to calculate the price movement by percentage. The Value of this indicator can be adjusted to look back of the percent of price change within certain timeframes. This is a powerful tool when used by other indicators as well, such as ATR and ADR, for understanding price fluctuations and tolerance in different strategies. ___________________________________________________________________________________ Disclaimer:
Do NOT trade or invest based upon the analysi
FREE

Have you ever wanted to be able to catch a trend just as it is beginning? This indicator attempts to find the tops and bottoms of a trend. It uses in-built indicators and studies their reversal patterns. It cannot be used on its own it requires Stochastic(14) to confirm signal. Red for sell, Blue for buy. There are no parameters required just attach to a chart and it is ready to go. Check out other great products from https://www.mql5.com/en/users/augustinekamatu/seller A Winning Trading Stra
FREE

The indicator uses the Chester W. Keltner's channel calculation method, modified by the well-known trader Linda Raschke. Due to the modification, the calculated channel contains a much more complete overview of the price movements, which allows increasing the probability of an accurate prediction of the upcoming price movement. Unlike the classic Keltner method, the base line of the channel is plotted based on the Exponential Moving Average, and the Average True Range is used to calculate the up
FREE

All traders should know the trend before making their decision when placing the buy or sell orders. The first step always starts with supply and demand , rising and falling channels , trend lines, engulfing candles etc. All the above contribute to what is called “Price Action” and that is the best and most reliable way in trading and catching the trend and making profits, without stress. The Investment Castle Trend Line Indicator will automatically draw the trend lines on the MT4 for you. An
FREE

제품 제목 Smart Bollinger Bands (MT4) – SmartView 시리즈의 일부 간단한 설명 MetaTrader 플랫폼에서 독특한 사용자 경험을 제공하는 Bollinger Bands 지표입니다. 이전에 사용할 수 없었던 고급 기능을 제공하며, 더블 클릭으로 설정 열기, 삭제하지 않고 지표 숨기기/표시하기, 지표 창을 전체 차트 크기로 표시하기 등의 기능을 포함합니다. SmartView Indicators 시리즈의 나머지 부분과 원활하게 작동하도록 설계되었습니다. 개요 SmartView 시리즈는 혁신적인 기능을 통해 MetaTrader 플랫폼의 지표에 독특하고 독특한 사용자 경험을 제공하여 지표 관리를 더 빠르고 쉽게 만듭니다. 각 지표는 차트에 스마트 제어 패널이 장착되어 있어 필수 정보를 표시하고 모든 중요한 기능에 빠르게 액세스할 수 있습니다. 이전에 사용할 수 없었던 고유한 기능 SmartView 시리즈는 지표 작업을 더 쉽고 빠르게 만드는 고급 기능을 제공합니
FREE
동적 채널. 채널 너비는 가격 움직임에 따라 자동으로 변경됩니다. 채널의 중간에서 편차가 클수록 경계가 넓어집니다. 표시기는 사용자가 설정 한 차트 섹션("기간"매개 변수)의 움직임에 맞게 조정됩니다. 따라서 가격이 주어진 간격으로 급격한 변동을 한 경우 채널이 확장되어 더 강한 변동을 기대합니다. 즉,그 매개 변수는 항상 현재 시장 상황에 해당합니다.
이 채널은 과거 데이터 분석을위한 것이 아닙니다! 그 조작성을 확인하려면 테스터에서 실행!
채널은 이전의 움직임에 따라 넓어지고 좁아집니다. 이러한 움직임은"기간"매개 변수에 따라 다릅니다. "기간"=200 을 설정하면 채널이 마지막 200 바의 움직임에 맞게 조정됩니다. 채널의 위쪽 및 아래쪽 경계는"기간"에 대한 이전 움직임의 가장 큰 편차에 따라 접근하거나 멀리 이동합니다. 따라서 가격이 중간 선에서 더 일찍 이탈할수록 채널이 더 넓어지고 더 조용한 움직임으로 채널이 좁아집니다. 동시에,채널의 본질은 동일하게 유지하고있다.
FREE
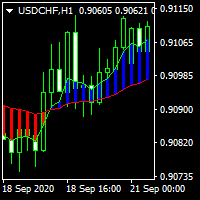
............................................hi................................................ .........................its a simple indicator of movings ............................
.........................a diffrent show of moving averages.......................... ...............can select period , shift , mode and applied price.................. ............many traders use movings for find market movement.................
...........................it can helpfull for finding trends.......
FREE

Esse indicador mede o 1º Canal de referencia e a 1º Zona Neutra * configurar o canal macro para verificar a frequencia MAIOR H1 H4 1D * configurar o canal micro para verificar a frequencia Menor 1M 5M 15M Como instalar o Indicador fimathe. E uma pré mentoria tem uma estrategia Secreta bonus nesse video . assitao o video para enteder as logicas que podemos iniciar com esse indicador.
https://www.youtube.com/playlist?list=PLxg54MWVGlJzzKuaEntFbyI4ospQi3Kw2
FREE

The purpose of this new version of the MT4 standard indicator provided in your platform is to display in a sub-window multiple timeframes of the same indicator. See the example shown in the picture below. But the display isn’t like a simple MTF indicator. This is the real display of the indicator on its timeframe. Here's the options available in the FFx indicator: Select the timeframes to be displayed (M1 to Monthly) Define the width (number of bars) for each timeframe box Alert pop up/sound/ema
FREE

Free informative Indicator-helper. It'll be usefull for traders who trade many symbols or using grid systems (Averaging or Martingale). Indicator counts drawdown as percent and currency separate. It has a number of settings: Count deposite drawdown according equity value and send e-mail or notifications to user if DD more than set; Sending e-mail when max open orders reached; Shows price and remaining pips amount before MarginCall on current chart and Account generally; Display summary trade lot
FREE

New Support and Resistance Indicator with Probabilities and Alerts Description: Maximize your profits with the newest Support and Resistance indicator! Our indicator automatically calculates support and resistance levels based on 24-hour analysis periods and provides detailed probabilities for each level. Additionally, you can set up custom alerts to be notified when the price touches specific levels, directly on your mobile device. Features: Support and resistance analysis based on hourly data
FREE

This indicator calculates gann support and resistance prices with use gann pyramid formulation and draw them on the chart. And If you want, Indicator can alert you when the current price arrive these pivot levels. Alert Options: Send Mobil Message, Send E-mail, Show Message and Sound Alert Levels: S1, S2, S3, S4, S5, R1, R2, R3, R4, R5 Inputs: GannInputPrice: Input price for gann pyramid formulation. GannInputDigit: How many digit do you want to use for calculation formula. (The number and the
FREE
Unleash Your Trading Potential with Trend Whisperer! Tired of lagging indicators and confusing signals? The Trend Whisperer is a state-of-the-art, adaptive trading system designed to give you a clearer view of the market and pinpoint high-probability entries and exits. This isn't just another moving average—it's an intelligent indicator that uses a powerful dynamic ATR bands and an EMA filter to cut through market noise and deliver sharp, confirmed signals. Key Advantages: Get Ahead of the Crow
FREE

Divergence Reader - индикатор который поможет Вам идентифицировать на графике дивергенцию и конвергенцию.
Настройки Type - выбор типа сигнала (дивергенция, конвергенция, оба сигнала); Minimum length of divergence (Candle) - минимальная длинна сигнала (в свечах); MACD SETTINGS - настройки индикатора МАСD; Важно! Индикатор не рисует графику на истории! Для визуальной проверки индикатора рекоммендую использовать тестер.
FREE

Индикатор сглаженного Stochastic Oscillator (xStoh)
Входные параметры: xK Period - K период xD Period - D период xSlowing - замедление xMethod - метод усреднения (0-SMA | 1-EMA | 2-SMMA | 3 - LWMA) xPrice field - тип цены (0 - Low/High | 1 - Close/Close) Принцип работы
Индикатор перерассчитывает стандартный технический индикатор Stochastic Oscillator (дважды усредняет получаемые значения iStochastic).
FREE

Introducing the Professional Arka STM Signal Indicator
With Arka Candle Close Time – 100% Free Version Fast, Accurate, and Unmatched in Identifying Trading Opportunities
This indicator is the result of combining advanced price action analysis with specialized market algorithms, delivering clear, timely, and profitable signals. Completely Free – No Installation or Usage Limits
️ An automated trading bot, fully synchronized with it, is also ready to run. The Power of ARKA STM Si
FREE
멀티 타임프레임 지원, 사용자 정의 가능한 시각적 신호 및 고도로 구성 가능한 알림 시스템을 갖춘 고급 Elder's Force Index (EFI) 지표입니다.
기능: 사용자 정의 가능한 색상과 코드가 있는 시각적 신호 마커(화살표 및/또는 수직선) 구성 가능한 트리거(방향 변경, 레벨 교차, 피크/밸리)가 있는 세 개의 독립적인 신호 버퍼 각 신호에 대한 고도로 사용자 정의 가능한 알림 기능(이메일, 푸시, 사운드, 팝업) 구성 가능한 알림 타이밍(종가 후, 종가 전 또는 둘 다) 멀티 타임프레임 기능(상위 및 하위 타임프레임) MTF 디스플레이를 위한 선형 보간 및 기타 평활화 방법 히스토그램 또는 라인 그리기 모드 네 가지 색상 모드(단순 색상, 방향만, 레벨이 있는 방향, 레벨만) 사용자 정의 가능한 색상과 스타일이 있는 조정 가능한 레벨 최대 바 계산 제한으로 성능 최적화 EA 통합을 위한 iCustom 버퍼 액세스(Signal 1, Signal 2, Signal 3,
FREE
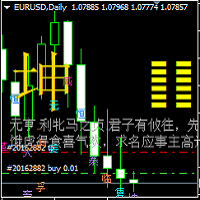
Zhouyi Yijing 64 hexagram hexagram change indicator
1. Hexagram indicator description: (1) This 64 hexagram hexagram change indicator is based on the Yin-Yang transformation thought of the "Book of Changes" philosophy in ancient Chinese culture, integrating the results of the long and short game of each candle K-line period of the financial trading K-line chart, using China's oldest prediction coding method, in the form of the 64 hexagrams of the Book of Changes, combining the Yin-Yang of each
FREE

본 지표는 시장 분석의 정확성, 신뢰성, 그리고 다양성을 중시하는 트레이더를 위해 설계되었습니다. 간단한 인터페이스와 고급 신호 생성 로직을 결합하여 초보자와 숙련된 시장 참여자 모두에게 필수적인 도구입니다.
I. ️ 주요 장점: 절대적인 신호 신뢰성 본 지표의 주요 가치는 알고리즘의 무결성에 있으며, 이는 많은 도구의 주요 문제인 신호 재작성(redrawing)을 제거합니다.
신호 재작성 없음: 본 지표는 새로운 데이터가 나타나거나 시간대가 변경될 때 이전 신호가 삭제, 변경 또는 재작성되지 않도록 보장합니다.
즉각적인 고정: 모든 거래 신호(매수/매도)는 현재 캔들의 종가에 생성되고 영구적으로 고정됩니다. 실제 거래에서 이를 통해 신호가 변경되지 않을 것이라는 절대적인 확신을 보장합니다.
단일 활성화: 각 거래 신호는 정확히 한 번만 발동됩니다. 명확하고 반복되지 않는 조치 지침을 받게 됩니다.
II. 활용도 및 유연성 이 지표는 다양한 거래 스타일과 시장에
FREE

This indicator allows you to overlay three different moving averages on the chart simultaneously. Each of these moving averages has additional settings such as: -Time frame
-Shift
-MA method
-Applied price
Using this indicator, you can easily set up three moving averages and find the one that suits you the best. You can also use this indicator to determine the trend when the moving averages cross.
FREE
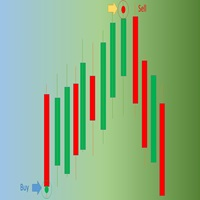
Wave_Entry_Alerts_In_EUR.mq4 is a custom indicator developed by Azad Gorgis for MetaTrader 4. This indicator is designed to provide alerts based on ZigZag patterns, specifically tailored for trading on the (EUR/USD) symbol.
Key Features: - Chart Window Indicator: The indicator is designed to be displayed on the main chart window. - Arrow Signals: The indicator generates arrow signals on the chart, indicating potential reversal points based on ZigZag patterns. - Customizable Parameters: Traders
FREE

Spin is an intrinsic form of angular momentum carried by elementary particles, composite particles (hadrons), and atomic nuclei.
Spin is one of two types of angular momentum in quantum mechanics, the other being orbital angular momentum. The orbital angular momentum operator is the quantum-mechanical counterpart to the classical angular momentum of orbital revolution and appears when there is periodic structure to its wavefunction as the angle varies.For photons, spin is the quantum-mechanical
FREE
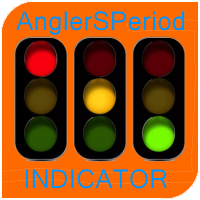
The oscillator indicator " AnglerSPeriod " is one of a series of three calculators of the angular deviation of the price chart of a trading instrument.
INPUT PARAMETER: DRAWs =128 - Number of bars to display the indicator in the chart history; PeriodIND =14 - calculation period of the indicator in the number of bars.
The values of the indicator indicators are degrees . The presence of a Strong price Movement begins with a value of +-45 degrees, and can not exceed +-90 degrees. A Good Trading
FREE
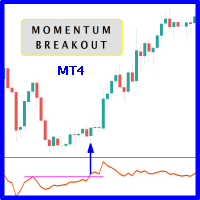
When prices breakout resistance levels are combined with momentum oscillator breaks out its historical resistance levels then probability emerges to record farther prices. It's strongly encouraged to confirm price breakout with oscillator breakout since they have comparable effects to price breaking support and resistance levels; surely, short trades will have the same perception. Concept is based on find swing levels which based on number of bars by each side to confirm peak or trough and in tu
FREE

Key Price Levels Indicator Indicator that shows the highs and lows for the significant price levels for past periods that could be potentially considered as reaction levels. The indicator displays the following price levels: Yesterday high and low The day before yesterday high and low Two days back high and low Last week high and low Last month high and low Last three month high and low (Quarter) Last year high and low
FREE

This indicator uses the Zigzag indicator to identify swing highs and swing lows in the price chart. Once it has identified the swing highs and swing lows, it can use them to determine potential support and resistance levels. A support level is formed when the price drops and bounces back up from a swing low, indicating that there is buying pressure at that level. A resistance level is formed when the price rises and reverses downward from a swing high, suggesting selling pressure at that leve
FREE
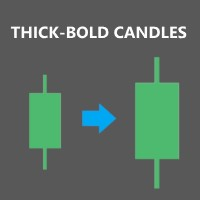
Description: Expand the width of your candles horizontally in MT4 to improve visibility when zooming in or out of the chart. Once attached to the chart, the indicator will automatically double the size of the candles compared to their normal value. Main indicator inputs: Body: size of the candle body Wick: size of the candle wick Additionally, you have the option to change the color of the candle body. We hope you find this free and useful indicator enjoyable!
FREE
Moving average cross over notification !
How to use Add NotifyMaCross indicator into the chart. Set Moving average line one and two. Wait the notification when moving average cross over Support for development : https://www.buymeacoffee.com/itwetrade
Check out all indicator and expert advisor here https://www.mql5.com/en/users/thanksmybot/seller ------------------------------------- Como usar
Adicione o indicador NotifyMaCross ao gráfico.
Defina a linha média móvel um e dois.
Agua
FREE

I was looking for a lean symbol changer. I could not find any. Normally other products hide lot's of screen space. So I developed a very lean symbol changer Just click on the 2 currencies you want to combine. The order does not matter. If you miss some pairs, you can add up to 5 custom symbols. Please make sure, your broker support your custom symbols. Drag an drop the panel with the green button.
In future I plan to include suffix and prefix als well.
FREE

Velvet RSI is intended for use with the Velvet advanced ordering layer. It is a modified version of the RSI indicator provided by Metaquotes and all of the data it displays is accurate and verified, when it is detected by the ordering layer. In order to place orders with the Velvet RSI indicator, the ordering layer must be installed and running. Ordering from the Velvet RSI indicator requires that "Velvet Ordering Layer" ( found here ), version 1.0 or higher, be installed and running. When de
FREE
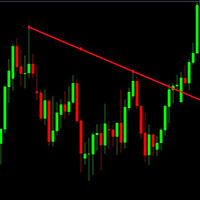
This is just a simple indicator that show Alert when the Current candle Close Above the Trendline. Previous candle do not affect the Alert. The indicator is tied to the Trendline so if the Trendline is accidentally deleted, the Alert will not work. The indicator will draw another Trendline if the current Trendline is deleted. Removing the indicator will removed the Trendline. There are 4 type of Alert to set: Popup Alert, Signal Alert, Push Notification, Comment.
FREE

This indicator shows the direction of the trend and trend change. Ganesha Trend Viewer is a trend indicator designed specifically for gold and can also be used on any financial instrument. The indicator does not redraw. Recommended time frame H1. Ganesha Trend Viewer is perfect for all Meta Trader symbols. (currencies, metals, cryptocurrencies, stocks and indices..) MT5 Version here!
Parameter setting
MA Short Period ----- Moving Average short period MA Long Period ----- Moving Average lon
FREE
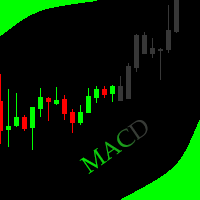
This indicator allows to hide MACD oscillator (on all MT4 timeframes) from a date define by the user, with a vertical line (Alone) or a panel (with "Hidden Candles"). Indicator Inputs: Fast EMA Period Slow EMA Period Signal SMA Period Apply To Information on "MACD" indicator is available here: https://www.metatrader4.com/en/trading-platform/help/analytics/tech_indicators/macd ************************************************************* Hey traders!! Give me your feeds! We are a community h
FREE

This indicator is designed based on the Moving Origin indicator
When the moving origin indicator breaks the price, this indicator gives a signal
It is useful for better viewing of signals and analysis on them
Attributes: Can be used in all symbols Can be used in all time frames Too many signals Simple and quick settings Easy way to work
Settings: period: like moving average settings alarmShow: If you want to receive an alert in Metatrader after receiving the signal, enable this setting
alarmS
FREE
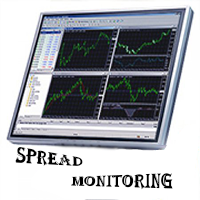
Spread Monitoring is a unique product for analyzing a spread. Unlike most similar indicators, Spread Monitoring uses ticks rather than bars allowing you to detect abnormal spread expansions. Features
Works on ticks rather than bars. Simple and easy indicator configuration. Works on all timeframes. Works on any financial instrument. No repainting.
Parameters
Total - number of displayed ticks. clrSpread - indicator line color.
FREE

Indicador "Supply and Demand Channels" para MetaTrader: Potencia tu Trading con Claridad y Precisión El indicador "Supply and Demand Channels" para MetaTrader es una herramienta avanzada diseñada para brindar a los traders una visión nítida y precisa de las zonas clave de oferta y demanda en el mercado. Basado en el principio fundamental de la ley de oferta y demanda, este indicador ofrece una interpretación gráfica única de las fuerzas que impulsan los movimientos de precios. Características De
FREE

The RSI Arrows MTF indicator is based on the RSI indicator. Represents input signals in the form of arrows. It has 6 types of calculation. All signals are generated on the current bar of the selected period.
Signals do not redraw in the first 4 modes! But it is possible to redraw in cases of a sharp change in market movement.
All signals in MTF mode correspond to signals of the period specified in MTF. It is maximally simplified to use both for trading with only one indicator and for using t
FREE
Unleash Smarter Trading with the Smart Signal Generator Tired of guesswork in your trading? The Smart Signal Generator is your new essential tool, designed to simplify your strategy and give you a powerful edge. This isn't just another indicator—it's a system built to provide you with high-probability entry signals, saving you time and boosting your confidence. Key Advantages & Features Intelligent Signal Generation : Our system goes beyond basic crossovers. It uses a built-in EMA filter to conf
FREE

지표는 차트에 중요한 기술 수준을 표시합니다. 이 수준은 가격 움직임에 대한 지지 또는 저항 역할을 합니다.
가장 중요한 수준은 100 점과 50 점의 배수입니다. 25포인트의 배수로 레벨을 표시할 수도 있습니다.
가격이 수준에 도달하면 경고 또는 푸시 알림이 표시됩니다.
MT5용 버전 https://www.mql5.com/ko/market/product/69740 설정 Show Levels 100 pips - 100핍의 배수로 레벨 표시 Show Levels 50 pips - 50핍의 배수로 레벨 표시 Show Levels 25 pips - 25핍의 배수로 레벨 표시 Color Levels 100 pips - 100핍으로 나눌 수 있는 수준의 선 색상 Color Levels 50 pips - 50핍으로 나눌 수 있는 수준의 선 색상 Color Levels 25 pips - 25핍으로 나눌 수 있는 레벨의 선 색상 Send Alert - 알림 보내기 Send Push - 푸시
FREE
Precision Entry Arrows: Never Miss a High-Probability Trade Again! Stop guessing and start trading with confidence. The Precision Entry Arrows indicator is a sophisticated, all-in-one tool designed to deliver high-quality, non-repainting Buy and Sell signals directly on your chart. It expertly combines the power of MACD , Stochastic , and a unique EMA 5 Cross to pinpoint exact entry moments , then filters everything through a long-term EMA 200 to ensure you are always trading with the major tre
FREE

CCI Trend Finder indicator with different colors at levels 0, 100 and -100. The cross is a signal for "123 Exit" as presented by MPlay and used in Woodies CCI system. This exit signal is effective especially in short-term breakout trades, because it prevents early exiting at small corrections. This indicator is great for having it as an extra tool for your analysis.
FREE

이 제품은 표시기/신호 도구로부터 정보를 수신하고 특정 조건이 충족되면 화살표 또는 알림을 표시합니다.
예를 들어, MA25와 MA50이 교차할 때, SAR이 반전할 때, MACD가 플러스/마이너스를 변경하거나 종가가 볼린저 밴드를 교차할 때 화살표와 알림이 표시됩니다.
구체적인 구성은 샘플 설정 이미지를 참조하세요.
자세한 매뉴얼 및 구성 파일은 다음을 참조하세요.
https://www.mql5.com/en/blogs/post/755082
무료 버전도 다운로드할 수 있습니다.
화살표는 다양한 구성으로 표시될 수 있으며 조합은 상상만큼 무한합니다.
신호 도구 및 표시기에 대한 연결을 설정하는 데 문제가 있는 경우 당사에 문의하여 도움을 받으십시오.
또한 요청 시 스마트폰, 이메일, Slack, Line, Discord 등에 알림을 푸시하고, 최대 8개의 매개변수를 추가하거나 개별 지표에 연결할 수 있습니다. 신호 도구를 보완하거나 이벤트 알림 기능으로 사용할 수
FREE

The indicator allows you to trade binary options. The recommended time frame is М1 and the expiration time is 1 minutes. The indicator suitable for auto and manual trading. A possible signal is specified as a arrows above/under a candle. You should wait until the candle closes! Arrows are not re-painted Trade sessions: London and New York section Currency pairs: EUR/GRB Working time frame: M1 Expiration time: 1 minute The indicator also shows good results when using the martingale strategy - "M
FREE

Rsi indicator and Stochastic Combined into one indicator , the Supreme StochRsi doesnt repaint / Back-paint / delay. can be used as overbought oversold strategy , or trend following on 50 level cross. if you like this indicator please check my Supreme Trendhisto: here , and my Supreme Diamond indicator : here ========================================================================= Parameters : Stochastic K and D value , Stochastic period Rsi Period Rsi price ====================================
FREE

The indicator informs when the current bar closes and a new bar opens. TIME is an important element of trading systems. BarTimerPro indicator helps you CONTROL THE TIME . Easy to use: place on the chart and set “alarms” if it necessary. In the tester, the indicator does not work. See the Lite version BarTimerPro-Lite
Key Features
4 operating modes: Shows the time elapsed since the opening of the current bar (11) Shows the time remaining until the current bar closes (11) Indicator Updates Every
FREE

This indicator helps the trader to make the final decision. When you have already decided in which direction the price will unfold, it remains as accurate as possible to determine the reversal itself. This is the task performed by the Konkov indicator. The indicator is installed on M1 and M5 charts. Indicator parameters: for M1 chart time_frame1 5 time_frame2
FREE
This indicator draws lines based on the standard Fractals indicator. Once a fractal is broken up or down, the indicator generates an alert, sends an email notification and a push message to your mobile phone.
User Inputs History - the number of bars in history for calculation. Color Up Fractal - the color of the upper fractal line. Color Down Fractal - the color of the lower fractal line. Width - the line width. Alerts - alert. EmailAlerts - email notification. NotificationAlert - push notifica
FREE

Necessary for traders: tools and indicators Waves automatically calculate indicators, channel trend trading Perfect trend-wave automatic calculation channel calculation , MT4 Perfect trend-wave automatic calculation channel calculation , MT5 Local Trading copying Easy And Fast Copy , MT4 Easy And Fast Copy , MT5 Local Trading copying For DEMO Easy And Fast Copy , MT4 DEMO Easy And Fast Copy , MT5 DEMO
The homeopathic indicator is also called the CCI indicator. The CCI indicator was proposed
FREE

R Alligator 지표는 Bill Williams가 도입했으며 3개의 평활 이동 평균을 사용하여 추세를 따릅니다.
기본적으로 다음 값이 사용됩니다. 13주기 평활 이동 평균(조라고도 함) 8주기 평활 이동 평균(치아라고도 함) 5주기 평활 이동 평균(입술이라고 함)
R Alligator 표시기는 평활 이동 평균을 사용하여 잘못된 추세 거래 수를 줄입니다.
기본 거래 신호 R Alligator 표시기는 일반적인 크로스오버 시스템 표시기입니다.
구매 거래 조건:
5일 평활 이동평균선이 8일 평활 이동평균선 위에 있고 13일 평활 이동평균선 위에 있습니다. 13일 평활 이동 평균 위의 8일 평활 이동 평균 매도 거래 조건:
8일 평활 이동평균선과 13일 평활이동평균선 아래의 5일 평활이동평균 13주기 평활이동평균 아래의 8주기 평활이동평균 형질 통화쌍: 모두
플랫폼: 메타트레이더 4
유형: 차트 패턴 표시기
사용자 지정 옵션: 가변(턱 기간, 턱 이동, 치아 기간,
FREE
FlatBreakout (Free Version) Flat Range Detector and Breakout Panel for MT4 — GBPUSD Only FlatBreakout is the free version of the professional FlatBreakoutPro indicator, specially designed for flat (range) detection and breakout signals on the GBPUSD pair only.
Perfect for traders who want to experience the unique fractal logic of FlatBreakout and test breakout signals on a live market without limitations. Who Is This Product For? For traders who prefer to trade breakout of flat ranges (breakout,
FREE

Pipsurfer Tide Meter is a Momentum Indicator that is designed to help trades know which way the "Tide" is turning. This indicator is a great supporting indicator to the pipsurfer main indicator that is listed in MQL5 under "Pipsurfer Indicator"
The Strategy Behind the Tide Meter is that youll see the blue bars and the red bars. Blue bars are for bullish momentum Red bars are for bearish momentum Use price action to find a trading zone then wait for the tide meter to change color then you ent
FREE
MetaTrader 마켓은 과거 데이터를 이용한 테스트 및 최적화를 위해 무료 데모 거래 로봇을 다운로드할 수 있는 유일한 스토어입니다.
어플리케이션의 개요와 다른 고객의 리뷰를 읽어보시고 터미널에 바로 다운로드하신 다음 구매 전 트레이딩 로봇을 테스트해보시기 바랍니다. 오직 MetaTrader 마켓에서만 무료로 애플리케이션을 테스트할 수 있습니다.
트레이딩 기회를 놓치고 있어요:
- 무료 트레이딩 앱
- 복사용 8,000 이상의 시그널
- 금융 시장 개척을 위한 경제 뉴스
등록
로그인
계정이 없으시면, 가입하십시오
MQL5.com 웹사이트에 로그인을 하기 위해 쿠키를 허용하십시오.
브라우저에서 필요한 설정을 활성화하시지 않으면, 로그인할 수 없습니다.