• 미리보기
  • 리뷰 (2)
  • 코멘트 (14)
  • 새 소식

Time And Sales Delta

5

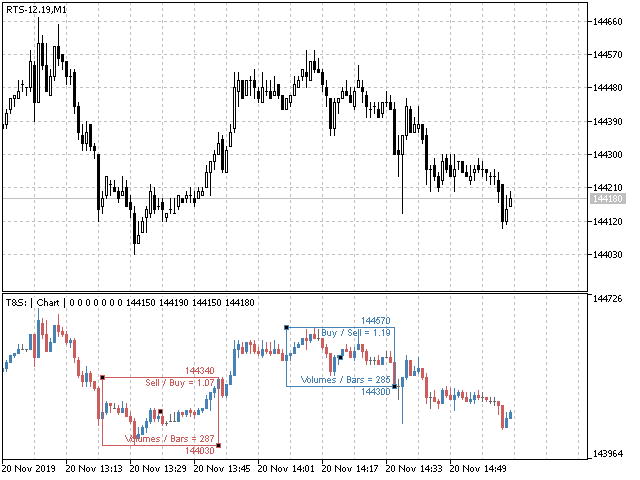
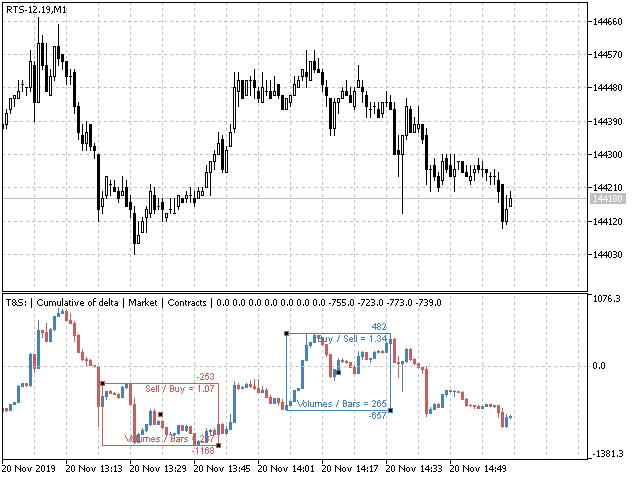
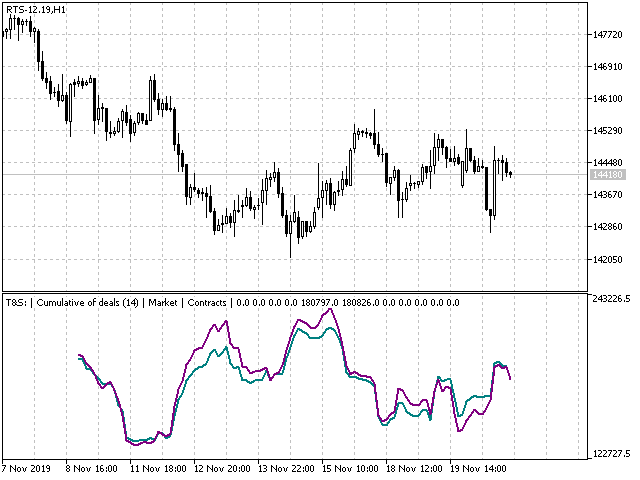
The indicator displays the delta and the cumulative delta based on the "Time & Sales" deals list data.

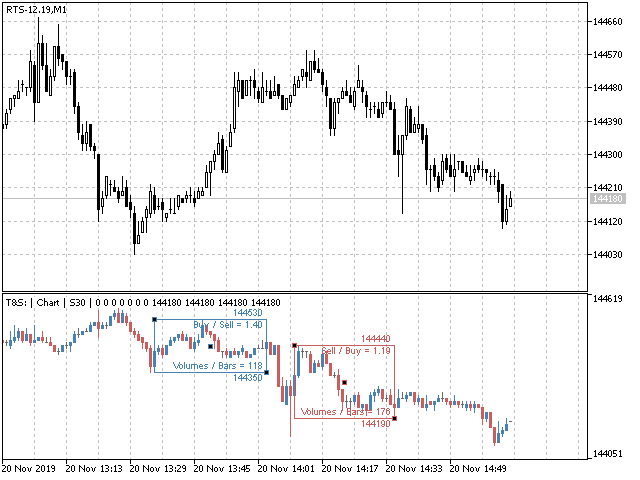
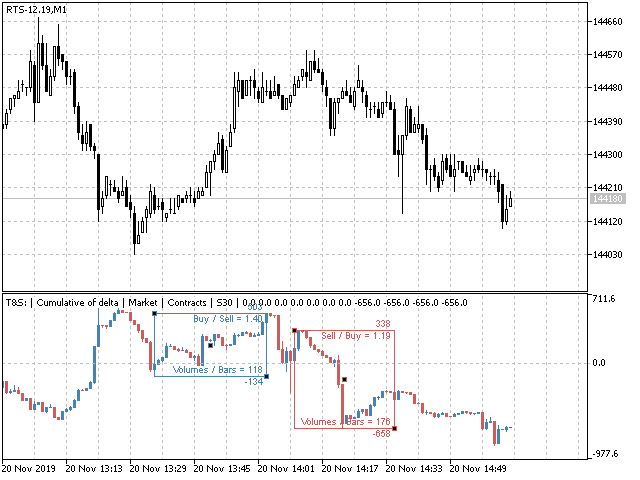
In addition to the standard timeframes, the indicator displays data regarding the seconds timeframes (S5, S10, S15, S20, S30) to choose from.

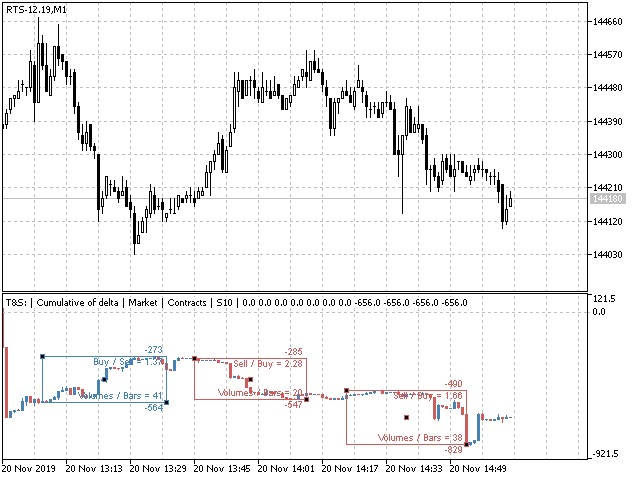
Using the rectangle, user can select an arbitrary area in the indicator subwindow to view the ratio of the volumes of deals of buyers and sellers within this area.


Indicator features:


The indicator works correctly only on those trading symbols for which the list of deals "Time and Sales" is broadcast.

For trading symbols that have the tick history without the content of the list of deals, an interpretation algorithm is exist: 

  • Each positive Ask tick is interpreted as the unit of volume to buy. 
  • Each negative Bid tick is interpreted as the unit of volume to sell. 

This algorithm works in the mode Calculation=Interpretation and is relevant mainly for currency pairs.


Input variables:

    Ticks - size of history.
      Mode - indicator modes:
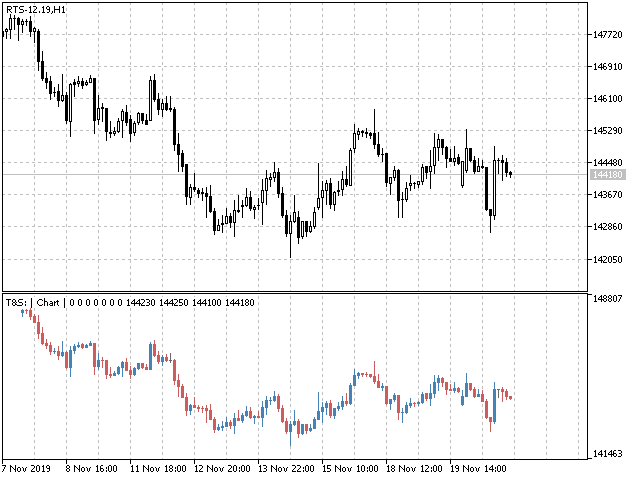
        • Chart - price chart.
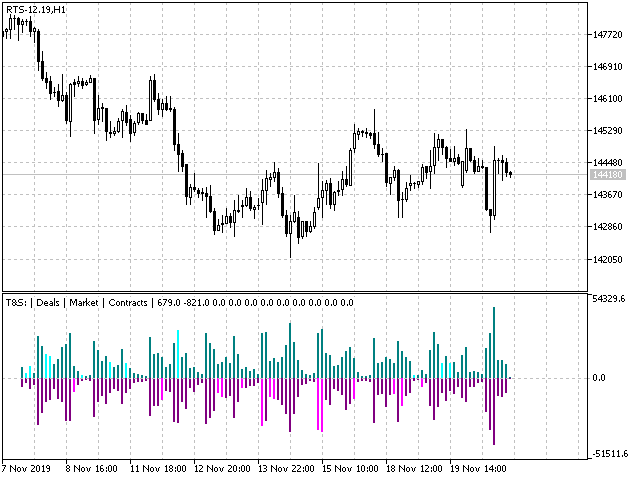
        • Deals - volumes of buy and sell deals.
        • Delta - difference between the volumes of buy and sell deals.
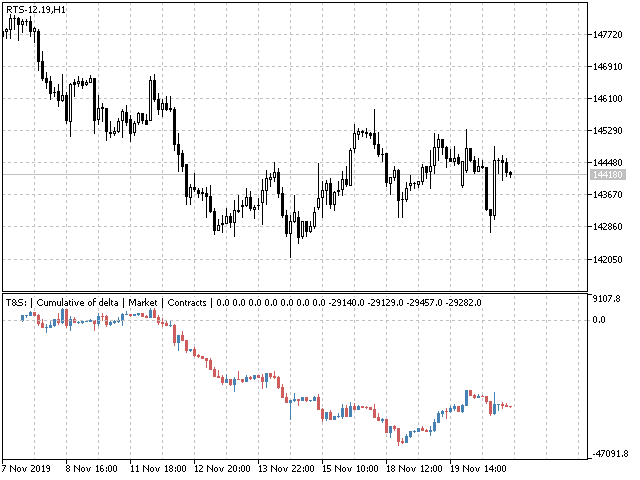
        • CumDelta - cumulative difference between the volumes of buy and sell deals.
        ViewPoint - view point:
          • Limit - in terms of limit orders.
          • Market - in terms of market orders.
        Calculation - calculation mode:
          • Events - in units of deals events (in ticks).
          • Contracts - in units of volumes of deals (in contracts).
          • Interpretation - interpretation by ticks (see section "Indicator features").
            CumulativeStartTime - starting date/time for cumulative delta.
              CumulativePeriod - period for cumulative display of Mode list modes.
                ExceedanceContracts - from the list of deals will be taken deals with the volume not lower than the specified value.
                  Timing - recalculation frequency in seconds, if the value is zero it is assigned automatically.


                    The other input variables relate to the color settings, and their purpose becomes clear from their name.


                    리뷰 2
                    Oleos
                    29
                    Oleos 2023.10.29 12:52 
                     

                    Отличный индикатор. Для меня было важно считывание данных с ленты. Не виснет. Отражает историю. Множество технических и визуальных настроек. Великолепная поддержка разработчика!

                    kramuse
                    37
                    kramuse 2021.02.03 10:34 
                     

                    Very well tunes indicator. Evgeny's designs are exceptional.

                    추천 제품
                    The indicator detects and displays М. Gartley's Butterfly pattern. The pattern is plotted by the extreme values of the ZigZag indicator (included in the resources, no need to install). After detecting the pattern, the indicator notifies of that by the pop-up window, a mobile notification and an email. The pattern and wave parameters are displayed on the screenshots. The default parameters are used for demonstration purposes only in order to increase the amount of detected patterns. Parameters
                    30 USD
                    Follow The Line MT5
                    Oliver Gideon Amofa Appiah
                    4.36 (28)
                    This indicator obeys the popular maxim that: "THE TREND IS YOUR FRIEND" It paints a GREEN line for BUY and also paints a RED line for SELL. (you can change the colors). It gives alarms and alerts of all kinds. IT DOES NOT REPAINT and can be used for all currency pairs and timeframes. Yes, as easy and simple as that. Even a newbie can use it to make great and reliable trades. NB: For best results, get my other premium indicators for more powerful and reliable signals. Get them here: https://www.m
                    FREE
                    Free automatic Fibonacci is an indicator that automatically plots a Fibonacci retracement based on the number of bars you select on the BarsToScan setting in the indicator. The Fibonacci is automatically updated in real time as new highest and lowest values appears amongst the selected bars. You can select which level values to be displayed in the indicator settings. You can also select the color of the levels thus enabling the trader to be able to attach the indicator several times with differe
                    FREE
                    PZ Penta O MT5
                    PZ TRADING SLU
                    3.8 (5)
                    The Penta-O is a 6-point retracement harmonacci pattern which usually precedes big market movements. Penta-O patterns can expand and repaint quite a bit. To make things easier this indicator implements a twist: it waits for a donchian breakout in the right direction before signaling the trade. The end result is an otherwise repainting indicator with a very reliable trading signal. The donchian breakout period is entered as an input. [ Installation Guide | Update Guide | Troubleshooting | FAQ | A
                    FREE
                    Donchian Channel DC
                    Renato Takahashi
                    Donchian Channel DC is the indicator of Donchian Channels, that plots maximum and minimum values of a specific period, besides mean value line. It´s possible to configure simple period for analysis and the indicator will plot all three values. You can trade with this indicator as trend or reversal, according to each strategy. Do not let to test others indicators as soon as others expert advisors.
                    30 USD
                    Important Lines
                    Terence Gronowski
                    4.88 (26)
                    This indicator displays Pivot-Lines, preday high and low, preday close and the minimum and maximum of the previous hour. You just have to put this single indicator to the chart to have all these important lines, no need to setup many single indicators. Why certain lines are important Preday high and low : These are watched by traders who trade in a daily chart. Very often, if price climbs over or falls under a preday low/high there is an acceleration in buying/selling. It is a breakout out of
                    FREE
                    Premium level Pro
                    Dmitriy Kashevich
                    Premium level is a unique indicator with more than 80% accuracy of correct predictions! This indicator has been tested for more than two months by the best Trading Specialists! The author's indicator you will not find anywhere else! From the screenshots you can see for yourself the accuracy of this tool! 1 is great for trading binary options with an expiration time of 1 candle. 2 works on all currency pairs, stocks, commodities, cryptocurrencies Instructions: As soon as the red ar
                    1 100 USD
                    Noize Absorption Index
                    Ekaterina Saltykova
                    Noize Absorption Index - is the manual trading system that measures the difference of pressure between bears forces and bulls forces. Green line - is a noize free index that showing curent situation. Zero value of index shows totally choppy/flat market.Values above zero level shows how powerfull bullish wave is and values below zero measures bearish forces.Up arrow appears on bearish market when it's ready to reverse, dn arrow appears on weak bullish market, as a result of reverse expectation.
                    199 USD
                    Best SAR MT5
                    Ashkan Hazegh Nikrou
                    5 (1)
                    설명 :  우리는 외환 시장(PSAR)에서 전문적이고 인기 있는 지표 중 하나를 기반으로 하는 새로운 무료 지표를 도입하게 된 것을 기쁘게 생각합니다. 이 지표는 원래 포물선 SAR 지표에 대한 새로운 수정이며, 프로 SAR 지표에서 점과 가격 차트 사이의 교차를 볼 수 있습니다. 교차는 신호가 아니지만 이동 가능성의 끝을 말하는 것입니다. 새로운 파란색 점으로 매수를 시작하고 첫 번째 파란색 점 앞에 손절매를 1 attr 배치하고 마지막으로 점이 가격 차트를 교차하는 즉시 종료할 수 있습니다. 매수 또는 매도 신호를 여는 방법은 무엇입니까? 첫 번째 파란색 점으로 공개 매수 거래 및 첫 번째 빨간색 점으로 공개 매도 거래 정확한 손절매는 어디에 있습니까? 안전한 정지 손실은 첫 번째 점에 있을 수 있습니다(구매의 경우 첫 번째 파란색 점, 매도의 경우 첫 번째 빨간색 점) 올바른 이익실현은 어디에 있습니까? 이익실현은 손절매 거리와 RR에 따라 조정할 수 있으므
                    FREE
                    Renko System
                    Marco Montemari
                    This indicator can be considered as a trading system. It offers a different view to see the currency pair: full timeless indicator, can be used for manual trading or for automatized trading with some expert advisor. When the price reaches a threshold a new block is created according to the set mode. The indicator beside the Renko bars, shows also 3 moving averages. Features renko mode median renko custom median renko 3 moving averages wicks datetime indicator for each block custom notificatio
                    69 USD
                    표시기는 현재 시세를 작성하여 과거 시세와 비교할 수 있으며 이를 바탕으로 가격 변동을 예측합니다. 표시기에는 원하는 날짜로 빠르게 이동할 수 있는 텍스트 필드가 있습니다. 옵션: 기호 - 표시기가 표시할 기호 선택. SymbolPeriod - 지표가 데이터를 가져올 기간 선택. IndicatorColor - 표시기 색상. HorisontalShift - 지시자가 그린 따옴표를 지정된 막대 수만큼 이동합니다. Inverse - true는 인용 부호를 반대로, false - 원래 보기를 반전합니다. ChartVerticalShiftStep - 차트를 수직으로 이동합니다(키보드의 위/아래 화살표). 다음은 날짜를 입력할 수 있는 텍스트 필드의 설정으로, '엔터'를 누르면 즉시 이동할 수 있습니다.
                    55 USD
                    Order Book, known also as Market Book, market depth, Level 2, - is a dynamically updated table with current volumes of orders to buy and to sell specific financial instument at price levels near Bid and Ask. MetaTrader 5 provides the means for receiving market book from your broker, but in real time only, without access to its history. The indicator OrderBook Cumulative Indicator accumulates market book data online and visualizes them on the chart. In addition, the indicator can show the market
                    49 USD
                    Mitimom
                    Danil Poletavkin
                    The indicator is based on Robert Miner's methodology described in his book "High probability trading strategies" and displays signals along with momentum of 2 timeframes. A Stochastic oscillator is used as a momentum indicator. The settings speak for themselves period_1 is the current timeframe, 'current' period_2 is indicated - the senior timeframe is 4 or 5 times larger than the current one. For example, if the current one is 5 minutes, then the older one will be 20 minutes The rest of the
                    FREE
                    LT Rainbow Trend
                    Thiago Duarte
                    5 (1)
                    Do you, like me, like to trade with the trend? Then this indicator will help you! Rainbow Trend is a trend indicator, which uses several Moving Averages on the chart. It measures different trend strenght zones for different periods: very long term, long term, mid term, short term and very short term. Each zone has its color, and it is possible to have sound alert when the prices leaves a zone and enters another. Its configuration is very simple. If you find any bug or have any suggestions, co
                    30 USD
                    무한대에서 통화의 강도를 측정하는이 혁신적인 지표는 오랫동안 거래하는 암표 및 거래자에게 없어서는 안될 조수입니다. 통화의 강도/약점을 분석하는 시스템은 오랫동안 알려져 있으며 세계 최고의 거래자들에 의해 시장에서 사용되었습니다. 이 분석 없이는 차익 거래가 완료되지 않습니다. 우리의 지표는 서로 관련하여 기본 통화의 강도를 쉽게 결정합니다. 표시 라인에 차트에 대한 모든 또는 현재 통화 쌍의 수 있도록 즉각적인 분석 및 검색에 대한 강한 진입 점. 표시등,직관적 인 사용하면 신속하게 찾아와 스위치는 모든 쌍,모바일 패널 배치할 수 있는 모두에서 지하실에는 기본 차트. 통화의 강도의 변화의 통지의 타이머 모드는 상인에게 전화로 알림을받을 수있는 기회를 제공합니다.  통화 전력계 무한대 표시기를 사용하기위한 몇 가지 전략: 1. 신흥 추세에 대한 신호로 교차점을 검색 할 통화의 강도의 선형 표시의 차트를 사용하여 2. 추세 반전 신호가 나타난 후 강한 통화 방향으로 두피
                    49 USD
                    Ichimoku Aiko MTF
                    Michael Jonah Randriamampionontsoa
                    Ichimoku Aiko MTF is a collection of technical indicators that show support and resistance levels, as well as momentum and trend direction. It is a multi-timeframe indicator so you don't need to change the chart timeframe when you want to see the ichimoku clouds on a higher timeframe.  eg. The chart timeframe is M15 and you want to see on the M15 timeframe chart the H1 ichimoku indicators (the ichimoku in Metatrader can't do that) that's why you need to use Ichimoku Aiko MTF.
                    31 USD
                    Reversal Composite Candles
                    MetaQuotes Ltd.
                    3.33 (21)
                    The idea of the system is to indentify the reversal patterns using the calculation of the composite candle. The reversal patterns is similar to the "Hammer" and "Hanging Man" patterns in Japanese candlestick analysis. But it uses the composite candle instead the single candle and doesn't need the small body of the composite candle to confirm the reversal. Input parameters: Range - maximal number of bars, used in the calculation of the composite candle. Minimum - minimal size of the composite can
                    FREE
                    Indicator and Expert Adviser  EA Available in the comments section of this product. Download with Indicator must have indicator installed for EA to work. Mt5 indicator alerts for bollinger band and envelope extremes occurring at the same time. Buy signal alerts occur when A bullish candle has formed below both the lower bollinger band and the lower envelope  Bar must open and close below both these indicators. Sell signal occur when A bear bar is formed above the upper bollinger band and upp
                    FREE
                    Donchian Pro
                    Paulo Henrique Faquineli Garcia
                    5 (2)
                    The Donchian Channel Channels are among the most popular tools of technical analysis, as they visually convey to the analyst the limits within which most price movement tends to occur. Channel users know that valuable information can be obtained at any time, whether prices are in the central region of a band or close to one of the border lines. One of the best known techniques to explore these concepts is Bollinger Bands. However, John Bollinger was not the only one to research the applicatio
                    FREE
                    Trendline mt5 indicator
                    David Muriithi
                    3 (1)
                    Are you tired of drawing trendlines every time you're analyzing charts? Or perhaps you would like more consistency in your technical analysis. Then this is for you. This indicator will draw trend lines automatically when dropped on a chart. How it works Works similar to standard deviation channel found on mt4 and mt5. It has 2 parameters: 1. Starting Bar 2. Number of bars for calculation The   starting bar   is the bar which drawing of the trend lines will begin, while the   number of bars for c
                    FREE
                    Description: First of all Its worth emphasizing here that this Trading Tool is Non-Repainting, Non-Redrawing and Non-Lagging Indicator, Which makes it ideal for professional trading and expert advisers. For limited time only 40% OFF,  Now 60$ only. 4 purchases left & the price increases to 100$ Attention, the application might not work in the strategy tester,    Try Demo here before you buy:   here . The Smart Price Action Concepts Indicator is a very powerful tool for both new and experienced
                    60 USD
                    Half ma
                    Artem Svistunov
                    The Half ma arrow indicator for the MetaTrader 5 trading terminal is a simple but effective tool that gives a signal about a change in the current trend. The Half ma indicator looks like a solid dynamic line that changes color at the points where the trend changes. At these points, the indicator draws arrows of the corresponding color and direction.The Half ma arrow indicator for the MT5 terminal is not an independent source of input signals. It will be most effective to use it as a trend filte
                    40 USD
                    Tops and Bottoms Indicator
                    Josue De Matos Silva
                    4.8 (5)
                    Tops & Bottoms Indicator FREE   Tops abd Bottoms:   An effective indicator for your trades The tops and bottoms indicator helps you to find  ascending and descending channel formations with indications of ascending and/or descending tops and bottoms. In addition, it  show possibles  opportunities with a small yellow circle when the indicator encounters an impulse formation. This indicator provide to you  more security and speed in making entry decisions. Also test our FREE advisor indicator:
                    FREE
                    Gartley Projections D
                    Oleksandr Medviediev
                    The indicator identifies the harmonic patterns (XABCD) according to developments of H.M.Gartley ( "Profits in the Stock Market" , 1935г). It projects D-point as a point in the perspective projection (specify ProjectionD_Mode = true in the settings). Does not redraw. When a bar of the working timeframe closes, if the identified pattern point has not moved during Patterns_Fractal_Bars bars, an arrow appears on the chart (in the direction of the expected price movement). From this moment on, the ar
                    500 USD
                    이 표시기는 시장 분석을 위한 가장 효과적인 도구 중 하나인 피보나치 지원 및 저항 수준을 자동으로 계산하고 표시합니다. 계산은 선택한 기간 및 기간 동안의 평균 가격 데이터를 사용합니다. 이 기간의 최소값과 최대값은 이동의 시작과 끝으로 간주됩니다. 피보나치 수준을 사용하면 가격 움직임이 느려지거나 역전될 수 있는 잠재적인 기준점을 볼 수 있습니다. 즉, 추가 움직임을 예측하고 정지 및 지정가 주문을 하는 데 사용됩니다. 매개변수: PartsShow - 현재 막대에서 표시된 과거 레벨의 수 CalcPeriod - 가격 평균화 기간 SmoothingMethod - 가격 평균화 방법(26개 옵션) TF - 계산에 사용되는 기간 LevelColor - 레벨 라인의 색상 ZeroLevelColor - 제로 레벨 색상 ShowVerticalLine - 레벨 사이의 수직선 표시 활성화/비활성화 VLineStyle - 수직선의 스타일 VLineColor - 수직선의 색상 ShowInfo - 레
                    30 USD
                    LT Donchian Channel
                    Thiago Duarte
                    5 (2)
                    Donchian Channel is an indicator created by Richard Donchian. It is formed by taking the highest high and the lowest low of the last specified period in candles. The area between high and low is the channel for the chosen period. Its configuration is simple. It is possible to have the average between the upper and lower lines, plus you have alerts when price hits one side. If you have any questions or find any bugs, please contact me. Enjoy!
                    FREE
                    Renko Plus
                    Eadvisors Software Inc.
                    With Renko Plus you can use the features in the Indicator functionality, just add it to the Metatrader5 chart.             The Renko chart is a type of chart, developed by the Japanese, that is constructed using price movement rather than standardized prices and time intervals like most charts. It is believed to be named after the Japanese word for bricks, "renga", as the graphic looks like a series of bricks.             A new brick is created when the price moves a specified p
                    70 USD
                    DUCHOAN99 would like to send you the  indicator   ATR (Keltner) Channels Multi TF Real Value for MT5 . Please download the demo to see if the indicator helps you or not before deciding to buy this indicator. 1.   KEY TAKEAWAYS Keltner Channels are volatility-based bands that are placed on either side of an asset's price and can aid in determining the direction of a trend. The exponential moving average (EMA) of a Keltner Channel is typically 20 periods, although this can be adjusted if desired
                    30 USD
                    MACDivergence MTF MT5
                    Pavel Zamoshnikov
                    4.17 (6)
                    Advanced ideas of the popular MACD indicator: It detects and displays classic and reverse divergences (two methods of detecting divergences). It uses different color to highlight an uptrend and a downtrend. Two methods of determining a trend: а) MACD crosses the 0 level (classic signal); б) MACD crosses its own average (early signal). This is a multi-timeframe indicator: it can display MACD data from other timeframes. Two methods of drawing: classic histogram and line. It generates sound and vis
                    30 USD
                    Double HMA MTF for MT5
                    Pavel Zamoshnikov
                    5 (2)
                    This is an advanced multi-timeframe version of the popular Hull Moving Average (HMA) Features Two lines of the Hull indicator of different timeframes on the same chart. The HMA line of the higher timeframe defines the trend, and the HMA line of the current timeframe defines the short-term price movements. A graphical panel with HMA indicator data from all timeframes at the same time . If the HMA switched its direction on any timeframe, the panel displays a question or exclamation mark with a tex
                    30 USD
                    이 제품의 구매자들이 또한 구매함
                    Description: First of all Its worth emphasizing here that this Trading System is Non-Repainting, Non-Redrawing and Non-Lagging Indicator, Which makes it ideal from both manual and robot trading.  For limited time only 50% OFF,  Now 100$ only. 4 purchases left & the price increases to 200$ Contact me right after the purchase to share with you the user manual. The “Smart Trend Trading System MT5” is a comprehensive trading solution tailored for new and experienced traders. It combines over 10 pre
                    100 USD
                    RelicusRoad Pro MT5
                    Relicus LLC
                    5 (18)
                    이제 $ 147 (몇 가지 업데이트 후 $ 499 증가) - 무제한 계정 (PCS 또는 MACS) RelicusRoad 사용 설명서 + 교육 비디오 + 비공개 Discord 그룹 액세스 + VIP 상태 시장을 보는 새로운 방법 RelicusRoad는 외환, 선물, 암호화폐, 주식 및 지수에 대한 세계에서 가장 강력한 거래 지표로서 거래자에게 수익성을 유지하는 데 필요한 모든 정보와 도구를 제공합니다. 우리는 초보자부터 고급까지 모든 거래자가 성공할 수 있도록 기술적 분석 및 거래 계획을 제공합니다. 미래 시장을 예측할 수 있는 충분한 정보를 제공하는 핵심 거래 지표입니다. 우리는 차트에서 말이 안 되는 여러 지표 대신 완전한 솔루션을 믿습니다. 타의 추종을 불허하는 매우 정확한 신호, 화살표 + 가격 조치 정보를 표시하는 올인원 표시기입니다. 강력한 AI를 기반으로 하는 RelicusRoad는 누락된 정보와 도구를 제공하여 교육하고 성공적인 트레이더인 트레이딩 전문
                    147 USD
                    TrendMaestro5
                    Stefano Frisetti
                    note: this indicator is for METATRADER4, if you want the version for METATRADER5 this is the link:  https://www.mql5.com/it/market/product/108106 TRENDMAESTRO recognizes a new TREND in the bud, he never makes mistakes. The certainty of identifying a new TREND is priceless. DESCRIPTION TRENDMAESTRO identifies a new TREND in the bud, this indicator examines the volatility, volumes and momentum to identify the moment in which there is an explosion of one or more of these data and therefore the mome
                    397 USD
                    Trend Screener Pro MT5
                    STE S.S.COMPANY
                    4.88 (52)
                    트렌드 표시기, 트렌드 트레이딩 및 필터링을 위한 획기적인 고유 솔루션, 하나의 도구 안에 내장된 모든 중요한 트렌드 기능! Forex, 상품, 암호 화폐, 지수 및 주식과 같은 모든 기호/도구에 사용할 수 있는 100% 다시 칠하지 않는 다중 시간 프레임 및 다중 통화 표시기입니다. Trend Screener는 차트에 점이 있는 화살표 추세 신호를 제공하는 효율적인 지표 추세 추종 지표입니다. 추세 분석기 표시기에서 사용할 수 있는 기능: 1. 트렌드 스캐너. 2. 최대 이익 분석이 있는 추세선. 3. 추세 통화 강도 측정기. 4. 경고가 있는 추세 반전 점. 5. 경고가 있는 강력한 추세 점. 6. 추세 화살표 Trend Screener Indicator가 있는 일일 분석 예, 일일 신호 성능...등은 여기에서 찾을 수 있습니다. 여기를 클릭하십시오. LIMITED TIME OFFER : Trend Screener Indicator는 50$ 및 평생 동안만 사용할 수 있습니다
                    50 USD
                    FX Power MT5 NG
                    Daniel Stein
                    5 (2)
                    모닝 브리핑 여기 mql5 와 텔레그램에서 FX Power MT5 NG 는 오랫동안 인기 있는 통화 강도 측정기인 FX Power의 차세대 버전입니다. 이 차세대 강도 측정기는 무엇을 제공합니까? 기존 FX Power에서 좋아했던 모든 것 PLUS GOLD/XAU 강도 분석 더욱 정밀한 계산 결과 개별 구성 가능한 분석 기간 더 나은 성능을 위한 사용자 정의 가능한 계산 한도 특별 멀티더 많은 것을보고 싶은 사람들을위한 특별한 다중 인스턴스 설정 모든 차트에서 좋아하는 색상을위한 끝없는 그래픽 설정 수많은 알림 옵션, 중요한 것을 다시는 놓치지 않도록 Windows 11 및 macOS 스타일의 둥근 모서리가 있는 새로운 디자인 마법처럼 움직이는 인디케이터 패널 FX 파워 키 특징 모든 주요 통화의 완전한 강세 이력 모든 시간대에 걸친 통화 강세 이력 모든 브로커 및 차트에서 고유 계산 결과 100% 신뢰할 수있는 실시간100 % 신뢰할 수있는 실시간 계산-> 다시 칠하지 않음
                    169 USD
                    Gold Stuff mt5
                    Vasiliy Strukov
                    4.9 (137)
                    Gold Stuff mt5는 금을 위해 특별히 설계된 추세 지표이며 모든 금융 상품에서도 사용할 수 있습니다. 표시기가 다시 그려지지 않고 지연되지 않습니다. 권장 기간 H1. 설정 및 개인 보너스를 받으려면 구매 후 즉시 저에게 연락하십시오!   설정 화살표 그리기 - 켜기 끄기. 차트에 화살표 그리기. 경고 - 가청 경고를 끕니다. 이메일 알림 - 켜기 끄기. 이메일 알림. Puch-notification - 켜기 끄기. 푸시 알림. 다음으로 색 영역을 조정합니다. Gold Stuff mt5는 금을 위해 특별히 설계된 추세 지표이며 모든 금융 상품에서도 사용할 수 있습니다. 표시기가 다시 그려지지 않고 지연되지 않습니다. 권장 기간 H1. 설정 및 개인 보너스를 받으려면 구매 후 즉시 저에게 연락하십시오!   설정 화살표 그리기 - 켜기 끄기. 차트에 화살표 그리기. 경고 - 가청 경고를 끕니다. 이메일 알림 - 켜기 끄기. 이메일 알림. Puch-noti
                    50 USD
                    Quantum Heiken Ashi PRO MT5
                    Bogdan Ion Puscasu
                    5 (3)
                    시장 동향에 대한 명확한 통찰력을 제공하도록 설계된 Heiken Ashi 양초는 노이즈를 필터링하고 잘못된 신호를 제거하는 기능으로 유명합니다. 혼란스러운 가격 변동에 작별을 고하고 더 매끄럽고 신뢰할 수 있는 차트 표현을 만나보세요. Quantum Heiken Ashi PRO를 정말 독특하게 만드는 것은 전통적인 촛대 데이터를 읽기 쉬운 색상 막대로 변환하는 혁신적인 공식입니다. 빨간색과 녹색 막대는 각각 약세와 강세 추세를 우아하게 강조하여 잠재적 진입점과 퇴장점을 매우 정확하게 파악할 수 있습니다. Quantum EA 채널:       여기를 클릭하세요 MT4 버전:       여기를 클릭하세요 이 놀라운 지표는 다음과 같은 몇 가지 주요 이점을 제공합니다. 선명도 향상: Heiken Ashi 바는 가격 변동을 완화하여 시장 추세를 보다 명확하게 나타내므로 유리한 거래 기회를 쉽게 식별할 수 있습니다. 소음 감소: 종종 잘못된 신호로 이어지는 불규칙한 가격 변동
                    99.99 USD
                    Entry Points Pro for MT5
                    Yury Orlov
                    4.55 (152)
                    다시 색을 칠하지 않고 거래에 진입할 수 있는 정확한 신호를 제공하는 MT5용 지표입니다. 외환, 암호화폐, 금속, 주식, 지수 등 모든 금융 자산에 적용할 수 있습니다. 매우 정확한 추정값을 제공하고 매수와 매도의 가장 좋은 시점을 알려줍니다. 하나의 시그널로 수익을 내는 지표의 예와 함께 비디오 (6:22)시청하십시오! 대부분의 거래자는 Entry Points Pro 지표의 도움으로 첫 거래 주 동안 트레이딩 결과를 개선합니다. 저희의   Telegram Group 을 구독하세요! Entry Points Pro 지표의 좋은점. 재도색이 없는 진입 신호 신호가 나타나고 확인되면(시그널 캔들이 완성된 경우) 신호는 더 이상 사라지지 않습니다. 여타 보조지표의 경우 신호를 표시한 다음 제거되기 때문에 큰 재정적 손실로 이어집니다. 오류 없는 거래 게시 알고리즘을 통해 트레이드(진입 또는 청산)를 할 이상적인 순간을 찾을 수 있으며, 이를 통해 이를 사용하는 모든 거래자의
                    125 USD
                    Owl Smart Levels MT5
                    Sergey Ermolov
                    4.42 (33)
                    MT4 버전  |  설치하는 방법?   |   FAQ Owl Smart Levels Indicator 는 Bill Williams 의 고급 프랙탈, 시장의 올바른 파동 구조를 구축하는 Valable ZigZag, 정확한 진입 수준을 표시하는 피보나치 수준과 같은 인기 있는 시장 분석 도구를 포함하는 하나의 지표 내에서 완전한 거래 시스템입니다. 시장과 이익을 취하는 장소로. 전략에 대한 자세한 설명 표시기 작업에 대한 지침 고문-거래 올빼미 도우미의 조수 개인 사용자 채팅 ->구입 후 나에게 쓰기,나는 개인 채팅에 당신을 추가하고 거기에 모든 보너스를 다운로드 할 수 있습니다 힘은 단순함에 있습니다! Owl Smart Levels 거래 시스템은 사용하기 매우 쉽기 때문에 전문가와 이제 막 시장을 연구하고 스스로 거래 전략을 선택하기 시작한 사람들 모두에게 적합합니다. 전략 및 지표에는 눈에 보이지 않는 비밀 공식 및 계산 방법이 없으며 모든 전략 지표는 공개되어 있습니다. Owl
                    97 USD
                    IX Power MT5
                    Daniel Stein
                    IX Power는   마침내 FX Power의 탁월한 정밀도를 외환이 아닌 기호에도 적용했습니다. 좋아하는 지수, 주식, 원자재, ETF, 심지어 암호화폐까지 단기, 중기, 장기 추세의 강도를 정확하게 파악할 수 있습니다. 단말기가 제공하는   모든 것을 분석할   수 있습니다. 사용해 보고 트레이딩   타이밍이 크게 향상되는   것을 경험해 보세요. IX Power 주요 특징 단말기에서 사용 가능한 모든 거래 심볼에 대해 100% 정확한 비재도장 계산 결과 제공 사전 구성 및 추가적으로 개별 구성 가능한 강도 분석 기간의 드롭다운 선택 가능 이메일, 메시지, 모바일 알림을 통한 다양한 알림 옵션 제공 EA 요청을 위한 액세스 가능한 버퍼 더 나은 성능을 위한 사용자 지정 가능한 계산 한도 더 많은 것을 보고 싶은 사용자를 위한 특별 다중 인스턴스 설정 모든 차트에서 좋아하는 색상을 위한 무한한 그래픽 설정 가능 Windows 11 및 macOS 스타일의 둥
                    99 USD
                    FX Volume MT5
                    Daniel Stein
                    4.93 (14)
                    모닝 브리핑을 통해 세부 정보와 스크린샷으로 매일 시장 업데이트를 받으세요 여기 mql5 및 텔레그램에서 FX 거래량은 브로커의 관점에서 시장 심리에 대한 실제 통찰력을 제공하는 최초이자 유일한 거래량 지표입니다. 브로커와 같은 기관 시장 참여자가 외환 시장에서 어떤 포지션을 취하고 있는지에 대한 훌륭한 통찰력을 COT 보고서보다 훨씬 빠르게 제공합니다. 차트에서 이 정보를 직접 확인하는 것은 트레이딩의 진정한 판도를 바꾸고 획기적인 솔루션입니다. 다음과 같은 고유한 시장 데이터 인사이트의 이점 비율 는 통화의 매수/매도 포지션 비율을 백분율로 표시 비율 변화 는 선택한 기간 내 매수 비율과 비율 변화를 표시 총 거래량 는 해당 통화의 총 거래량(롱 및 숏)을 로트 단위로 보여줍니다 Volumes Long 는 해당 통화의 모든 롱 포지션의 거래량을 보여줍니다 Volumes Short 는 해당 통화의 모든 숏 포지션의 거래량을 보여줍니다 Net Long 는 순 롱 포지션의 거래량
                    249 USD
                    ICT, SMC, SMART MONEY CONCEPTS, SMART MONEY, Smart Money Concept, Support and Resistance, Trend Analysis, Price Action, Market Structure, Order Blocks, BOS/CHoCH,   Breaker Blocks ,  Momentum Shift,   Supply&Demand Zone/Order Blocks , Strong Imbalance,   HH/LL/HL/LH,    Fair Value Gap, FVG,  Premium  &   Discount   Zones, Fibonacci Retracement, OTE, Buy Side Liquidity, Sell Side Liquidity, BSL/SSL Taken, Equal Highs & Lows, MTF Dashboard, Multiple Time Frame, BigBar, HTF OB, HTF Market Structure
                    65 USD
                    가격이 역전되고 후퇴함에 따라 시장 구조가 변경됩니다. 시장 구조 반전 경고 표시기는 추세 또는 가격 움직임이 고갈에 가까워지고 반전할 준비가 되었음을 식별합니다. 일반적으로 반전이나 큰 하락이 일어나려고 할 때 발생하는 시장 구조의 변화를 알려줍니다. 지표는 가능한 고갈 지점 근처에서 새로운 고점 또는 저점이 형성될 때마다 초기에 돌파와 가격 모멘텀을 식별합니다. 표시기는 반대쪽에 있는 마지막 촛불에 직사각형을 그립니다. 그런 다음 현재의 단기 추세에서 계속 움직이기 때문에 가격과 함께 직사각형을 따라갈 것입니다. 가격이 사각형 위나 아래로 다시 닫힐 정도로 약해지면 시장 구조에 잠재적인 변화가 일어나고 있음을 나타냅니다. 그런 다음 표시기는 방향의 잠재적인 이동과 추세 또는 주요 하락의 가능한 반전 시작에 대해 경고합니다. 작동 방식을 보려면 아래의 작동 표시기를 참조하십시오! 모든 쌍 및 주요 기간을 모니터링하는 대시보드: https://www.mql5.com/
                    49 USD
                    ICT, SMC, 스마트 머니 컨셉트(Smart Money Concept), 지지 및 저항(Support and Resistance), 추세 분석(Trend Analysis), 가격 행동(Price Action), 시장 구조(Market Structure), 주문 블록(Order Blocks), 브레이커 블록(Breaker Blocks), 모멘텀 변화(Momentum Shift), 강한 불균형(Strong Imbalance), HH/LL/HL/LH, 공정 가치 격차(Fair Value Gap), FVG, 프리미엄 및 디스카운트 영역(Premium & Discount Zones), 피보나치 리트레이스먼트(Fibonacci Retracement), OTE, 매수 측 유동성(Buyside Liquidity), 매도 측 유동성(Sellside Liquidity), 유동성 공백(Liquidity Voids), 시장 세션(Market Sessions), NDOG, NWOG, 실버 불릿(Silv
                    39 USD
                    Auto Order Block with break of structure based on ICT and Smart Money Concepts Futures Break of Structure ( BoS )             Order block ( OB )            Higher time frame Order block / Point of Interest ( POI )    shown on current chart           Fair value Gap ( FVG ) / Imbalance   ,  MTF      ( Multi Time Frame )    Volume Imbalance     ,  MTF          vIMB Gap’s Equal High / Low’s     ,  MTF             EQH / EQL Liquidity               Current Day High / Low           HOD /
                    53 USD
                    AW Trend Predictor MT5
                    AW Trading Software Limited
                    4.75 (51)
                    하나의 시스템에서 추세와 고장 수준의 조합입니다. 고급 지표 알고리즘은 시장 노이즈를 필터링하고 추세, 진입점 및 가능한 출구 수준을 결정합니다. 표시기 신호는 통계 모듈에 기록되어 가장 적합한 도구를 선택하여 신호 기록의 효율성을 보여줍니다. 이 표시기는 이익 실현 및 손절매 표시를 계산합니다. 매뉴얼 및 지침 ->   HERE   / MT4 버전 ->   HERE 지표로 거래하는 방법: Trend Predictor로 거래하는 것은 3단계로 간단합니다. 1단계 - 포지션 열기 70% 이상의 성공률로 매수 신호를 받았습니다. 2단계 - StopLoss 결정 반대 신호로 트렁크 선택 3단계 - 이익 실현 전략 정의 전략 1: TP1 도달 시 전체 포지션 청산 전략 2: TP1 도달 시 포지션의 50% 청산 및 TP2 도달 시 나머지 50% 청산 전략 3: 추세 반전 시 전체 포지션 청산 이익: 결과를 다시 그리지 않음, 신호는 엄격하게 양초가 닫힐 때 어드바이저에서 사용할 수 있습니
                    55 USD
                    Advanced Supply Demand MT5
                    Bernhard Schweigert
                    4.46 (13)
                    현재 33% 할인! 초보자나 전문 트레이더를 위한 최고의 솔루션! 이 보조지표는 우리가 다수의 독창적 기능과 새로운 공식을 통합한 독특하고 고품질이며 저렴한 거래 도구입니다. 이 업데이트를 통해 이중 시간대를 표시할 수 있습니다. 더 높은 TF를 표시할 수 있을 뿐만 아니라 차트 TF와 더 높은 TF 모두를 표시할 수 있습니다: 중첩 영역 표시. 모든 Supply Demand 트레이더들이 좋아할 것입니다. :) 중요한 정보 공개 Advanced Supply Demand의 잠재력을 극대화하려면 다음을 방문하십시오. https://www.mql5.com/ko/blogs/post/720245   진입 또는 목표의 명확한 트리거 포인트를 정확히 찾아냄으로 해서 거래가 어떻게 개선될지 상상해 보십시오. 새로운 알고리즘을 기반으로 매수자와 매도자 간의 잠재적인 불균형을 훨씬 더 쉽게 분간할 수 있습니다. 왜냐하면 가장 강한 공급영역과 가장 강한 수요 영역과 과거에 어떻게 진행 되었는지를(이
                    199 USD
                    Matrix Arrow Indicator MT5
                    Juvenille Emperor Limited
                    5 (14)
                    매트릭스 화살표 표시기 MT5 는 외환, 상품, 암호 화폐, 지수, 주식과 같은 모든 기호/도구에 사용할 수 있는 100% 다시 칠하지 않는 다중 기간 표시기를 따르는 고유한 10 in 1 추세입니다.  Matrix Arrow Indicator MT5 는 다음과 같은 최대 10개의 표준 지표에서 정보와 데이터를 수집하여 초기 단계에서 현재 추세를 결정합니다. 평균 방향 이동 지수(ADX) 상품 채널 지수(CCI) 클래식 하이켄 아시 캔들 이동 평균 이동 평균 수렴 발산(MACD) 상대 활력 지수(RVI) 상대 강도 지수(RSI) 포물선 SAR 스토캐스틱 오실레이터 윌리엄스의 백분율 범위 모든 지표가 유효한 매수 또는 매도 신호를 제공하면 강력한 상승/하락 추세를 나타내는 다음 캔들/막대가 시작될 때 해당 화살표가 차트에 인쇄됩니다. 사용자는 사용할 표시기를 선택하고 각 표시기의 매개변수를 개별적으로 조정할 수 있습니다. 매트릭스 화살표 표시기 MT5는 선택한 표시기에서만 정보를 수
                    75 USD
                    FX Trend MT5
                    Daniel Stein
                    4.63 (35)
                    Get your daily market update with details and screenshots via our Morning Briefing  here on mql5  and  on Telegram ! Do you want to become a constantly profitable 5-star forex trader? Then  get our Stein Investments trading tools  and send us a screenshot to get your personal invitation to our exclusive trading chat with 500+ members. FX Trend displays the trend direction, duration, intensity and the resulting trend rating for all time frames in real time. You'll see at a glance at which dir
                    66 USD
                    TPSproTREND PrO MT5
                    Roman Podpora
                    5 (1)
                    TPSpro TRENDPRO  - is a trend indicator that automatically analyzes the market and provides information about the trend and each of its changes, as well as giving signals for entering trades without redrawing! The indicator uses each candle, analyzing them separately. referring to different impulses - up or down impulse. Exact entry points into transactions for currencies, crypto, metals, stocks, indices!  -    To maximize the potential and learn how to trade using this indicator, read the full
                    135 USD
                    Blahtech Supply Demand MT5
                    Blahtech Limited
                    4.57 (14)
                    Was: $299  Now: $99   Supply Demand uses previous price action to identify potential imbalances between buyers and sellers. The key is to identify the better odds zones, not just the untouched ones. Blahtech Supply Demand indicator delivers functionality previously unavailable on any trading platform. This 4-in-1 indicator not only highlights the higher probability zones using a multi-criteria strength engine, but also combines it with multi-timeframe trend analysis, previously confirmed swings
                    99 USD
                    초보자 또는 전문가 트레이더를 위한 최고의 솔루션! 이 지표는 우리가 독점 기능과 새로운 공식을 통합했기 때문에 독특하고 고품질이며 저렴한 거래 도구입니다. 단 하나의 차트로 28 Forex 쌍의 통화 강도를 읽을 수 있습니다! 새로운 추세 또는 스캘핑 기회의 정확한 트리거 포인트를 정확히 찾아낼 수 있기 때문에 거래가 어떻게 개선될지 상상해 보십시오. 사용 설명서: 여기를 클릭  https://www.mql5.com/en/blogs/post/697384 그것이 첫 번째, 원본입니다! 쓸모없는 지망생 클론을 사지 마십시오. 더 스페셜  강력한 통화 모멘텀을 보여주는 하위 창의 화살표 GAP가 거래를 안내합니다! 기본 또는 호가 통화가 과매도/과매도 영역(외부 시장 피보나치 수준)에 있을 때 개별 차트의 기본 창에 경고 표시가 나타납니다. 통화 강도가 외부 범위에서 떨어질 때 풀백/반전 경고. 교차 패턴의 특별 경고 추세를 빠르게 볼 수 있는 다중 시간 프레임 선택
                    128 USD
                    Strong Support mt5
                    Vasiliy Strukov
                    5 (9)
                    지원 및 저항 수준은 오랫동안 시장 분석을위한 강력한 도구였습니다. 강력한 지원 지표는 현지 가격 최소값을 기반으로 한 지원 수준과 현지 가격 최대값을 기반으로 한 저항 수준을 나타냅니다. 내 다른 개발은 여기에서 볼 수 있습니다 추세 표시기와 함께 사용하는 것이 좋습니다(예:금 물건)-추세에 따라 거래하고 동시에 통합 또는 추세 반전 영역을 결정할 수있을뿐만 아니라 정지 손실을 설정하고 지원 및 저항 수준에서 이익을 얻을 수 있습니다. 설정 및 개인 보너스를 받기 위해 구입 후 즉시 저에게 연락하십시오! 들어오는 매개 변수 - 이 표시기에는 복잡한 설정이 필요하지 않으며 주요 매개 변수는 색상 스케일 조정입니다. 지원 및 저항 수준은 오랫동안 시장 분석을위한 강력한 도구였습니다. 강력한 지원 지표는 현지 가격 최소값을 기반으로 한 지원 수준과 현지 가격 최대값을 기반으로 한 저항 수준을 나타냅니다. 내 다른 개발은 여기에서 볼 수 있습니다 추세 표
                    50 USD
                    Smart Peak Bottom
                    Xiaoyu Huang
                    5 (2)
                    이것은 고점과 저점을 판단하기 위한 명확한 지표이며 진동 시장에 적합합니다. 프로모션 가격 49$ → 59$ 특징 상의와 하의를 잘 판단한다 다시 그리기 없음, 드리프트 없음 빠른 계산, 지연 없음 풍부한 알림 모드 여러 매개 변수 및 색상을 조정할 수 있습니다. 매개변수 "======== 메인 ========" HighLowPeriod1 = 9 HighLowPeriod2 = 60 HighLowPeriod3 = 34 HighLowEMAPeriod = 4 MASignalPeriod = 5 "======== 알림 ========" UseAlertNotify = 참; UseMetaQuotesIDNotify = 참; UseMailNotify = 참; NotifySignalMode = 색상 변경 및 레벨 확인; 하이레벨 = 80; 저수준 = 20; NofityPreMessage = "스마트 피크 바닥"; EA 통화의 경우 0. 높은 버퍼 1.낮은 버퍼 2. 방향 버퍼 1 up
                    49 USD
                    Stargogs Spike Catcher
                    Lorenzo Edward Beukes
                    5 (6)
                    Stargogs Spike Catcher V3.12 This Indicator is Developed To milk the BOOM and CRASH indices . Send me Message if you need any help with the indicator.  CHECK OUT THE STARGOGS SPIKE CATCHER EA/ROBOT V3: CLICK HERE ALSO CHECK OUT SECOND TO NONEFX SPIKE CATCHER:   CLICK HERE STARGOGS SPIKE CATCHER V3.12 WHATS NEW! Brand New Strategy. This is the Indicator you need for 2023. The Indicator Gives you an Entry at a time when conditions are met enter on every arrow and exit when it gives an X. New Tren
                    100 USD
                    ICT Template MT5
                    David Perk
                    4.33 (6)
                    ICT Template Indicator visualizes and automatically updates all important ICT elements for Scalpers, Day and Swing traders. It allows you too keep your chart clean and bring any elements by just one click to the buttons. Thanks to mobile notifications on external liquidity levels, you will not miss any opportunity and you don't have to sit behind the screens whole day. Each element has fully customizable colours, width, line types, max timeframe to be shown etc... so you can really tweak your ch
                    49 USD
                    Heracles Indicator를 소개합니다. 이 지표를 사용하면 분석이 필요하지 않고 쉽게 거래할 수 있습니다. 자동으로 누적 구역, 진입 지점 및 명확한 이익 실현 수준을 식별합니다. Heracles Indicator는 가격이 매수 또는 매도 진입 지점에 도달하면 알림을 표시하고 신호 화살표를 표시하며 이익 실현을 위한 세 가지 수준을 제안합니다. 초보자 및 전문 트레이더 모두에게 적합합니다. 채널 지원:   여기를 클릭하세요 MT4 버전:   여기를 클릭하세요 권장 사항: 시간 프레임: M5 및 M15 통화 쌍: 모든 통화 쌍 계정 유형: 매우 낮은 스프레드를 가진 ECN, Raw 또는 Razor 권장 스톱 로스: 50 픽스 또는 High/Low 지역 권장 이익 실현 수준: 25 픽스, 50 픽스 및 75 픽스 사양: 1/ 자동으로 누적 구역을 그립니다. 2/ 자동으로 매수/매도 진입 지점을 제안합니다. 3/ 높은 정확도로 세 가지 이익 실현 수준을
                    75.99 USD
                    이 다중 시간 프레임 및 다중 기호 표시기는 이중 상단/하단, 머리 및 어깨, 페넌트/삼각형 및 플래그 패턴을 식별합니다. 또한 네크라인/삼각형/깃대 이탈이 발생한 경우에만 경고를 설정하는 것도 가능합니다(넥라인 이탈 = 상단/하단 및 헤드&숄더에 대한 확인된 신호).       지표는 단일 차트 모드에서도 사용할 수 있습니다. 이 옵션에 대한 자세한 내용은 제품의       블로그   . 고유한 규칙 및 기술과 결합하여 이 표시기를 사용하면 자신만의 강력한 시스템을 생성(또는 강화)할 수 있습니다. 특징 Market Watch 창에 표시되는 모든 기호를 동시에 모니터링할 수 있습니다. 하나의 차트에만 지표를 적용하고 전체 시장을 즉시 모니터링하십시오. M1에서 MN까지 모든 시간 프레임을 모니터링할 수 있으며 패턴이 식별되거나 중단될 때 실시간 경고를 보냅니다. 모든 Metatrader 기본 경고 유형이 지원됩니다. RSI를 추세 필터로 사용하여 잠재적 반전을 적절히 식별할 수
                    59 USD
                    Royal Scalping Indicator M5
                    Vahidreza Heidar Gholami
                    5 (8)
                    My products are currently 50% off. Explore them and build your own strategy. Royal Scalping Indicator is an advanced price adaptive indicator designed to generate high-quality trading signals. Built-in multi-timeframe and multi-currency capabilities make it even more powerful to have configurations based on different symbols and timeframes. This indicator is perfect for scalp trades as well as swing trades. Royal Scalping is not just an indicator, but a trading strategy itself. Features Price A
                    69 USD
                    Reversal First Impulse levels (RFI)   - are the   maximum volume   levels/areas that turn the market around, so they play a critical role in future trading decisions. The logic behind the movement of any chart is that the price moves from the first impulse level (RFI) to the first impulse level (RFI) of the past trend. The first impulse level (RFI) is the most powerful level during a trend reversal, which forms a reversal zone. The first impulse level from the reversal of the previous movement i
                    125 USD
                    제작자의 제품 더 보기
                    Clusters Chart MT4
                    Evgeny Shevtsov
                    5 (4)
                    The indicator displays volume clusters or volume profiles to choose from. Input variables StepPoint  - cluster step in points, if the value is zero, the step is assigned automatically. AssociatedTimeframe  - binding the indicator to the specified timeframe of the chart, if the value is equal to Current, the indicator works on all timeframes. ClustersVolume  - volume in clusters: All  - all volume. Active  - active volume (which produced the price movement). ClustersAsDelta  - difference betw
                    33 USD
                    AnyProfile MT5
                    Evgeny Shevtsov
                    5 (17)
                    The indicator displays market profiles of any duration in any place on the chart. Simply create a rectangle on the chart and this rectangle will be automatically filled by the profile. Change the size of the rectangle or move it - the profile will automatically follow the changes. Operation features The indicator is controlled directly from the chart window using the panel of buttons and fields for entering parameters. In the lower right corner of the chart window there is a pop-up "AP" but
                    35 USD
                    Cumulative Delta MT5
                    Evgeny Shevtsov
                    4.49 (53)
                    The indicator analyzes the volume scale and splits it into two components - seller volumes and buyer volumes, and also calculates the delta and cumulative delta. The indicator does not flicker or redraw, its calculation and plotting are performed fairly quickly, while using the data from the smaller (relative to the current) periods. The indicator operation modes can be switched using the Mode input variable: Buy - display only the buyer volumes. Sell - display only the seller volumes. BuySell -
                    FREE
                    BoxProfile MT5
                    Evgeny Shevtsov
                    4.43 (7)
                    The indicator displays volume profiles based on the nesting principle. Profiles periods are pre-set so that each subsequent profile has a length twice as long as the length of the previous profile. In addition to profiles, the indicator displays volume clusters sorted by color, depending on the volume they contain. Indicator operation features The indicator works on typical timeframes from M5 to MN, but for calculations uses historical data from smaller timeframes: M1 - for timeframes from M5
                    FREE
                    Smart Depth Of Market
                    Evgeny Shevtsov
                    4.2 (20)
                    The indicator displays the orders book, as well as increases its depth, remembering the location of orders that have gone beyond the current "window" view. Indicator capability Display the levels of open positions. Simulation of placing/cancelling/editing pending orders directly in the displayed orders book. Indicator features The orders book display works only on those trading symbols for which it is broadcast by the broker. To reset the information about the rows that were recorded in the
                    FREE
                    The utility refers to probabilistic analysis tools, in particular the Monte Carlo method. The Monte Carlo method is defined as the simulation of processes in purpose to evaluate their probabilistic characteristics and apply them to the solvable task. Operation features The simulation uses a tick model with the subsequent transformation to the candles form, as a model as close as possible to the real market process. The utility generates a stream of a random tick sequence until a result with th
                    35 USD
                    Clusters Chart MT5
                    Evgeny Shevtsov
                    5 (7)
                    The indicator displays volume clusters or volume profiles to choose from. For trading symbols which contain the tape of deals, the indicator can perform calculations based on the tape of deals. Input variables StepPoint  - cluster step in points, if the value is zero, the step is assigned automatically. HistoryTicks  - size of tick history (for VolumeType in the mode TimeAndSales). AssociatedTimeframe  - binding the indicator to the specified timeframe of the chart, if the value is equal to
                    33 USD
                    Demand And Supply Diagram MT4
                    Evgeny Shevtsov
                    4.73 (11)
                    The balance of supply and demand is a simple and effective market analysis method. The supply and demand diagram can show you in advance, even before the trend reversal, where the supply ends and the demand is already emerging, where the demand ends and the supply is emerging, while substantially increasing the probability of making a deal in the right direction and with a high profit factor. Indicator Signals The indicator uses the price/volume values to generate signals: ED – excess demand.
                    35 USD
                    AnyProfile MT4
                    Evgeny Shevtsov
                    5 (23)
                    The indicator displays market profiles of any duration in any place on the chart. Simply create a rectangle on the chart and this rectangle will be automatically filled by the profile. Change the size of the rectangle or move it - the profile will automatically follow the changes. Operation features The indicator is controlled directly from the chart window using the panel of buttons and fields for entering parameters. In the lower right corner of the chart window there is a pop-up "AP" butt
                    35 USD
                    Cumulative Delta MT4
                    Evgeny Shevtsov
                    4.68 (34)
                    The indicator analyzes the volume scale and splits it into two components - seller volumes and buyer volumes, and also calculates the delta and cumulative delta. The indicator does not flicker or redraw, its calculation and plotting are performed fairly quickly, while using the data from the smaller (relative to the current) periods. The indicator operation modes can be switched using the Mode input variable: Buy - display only the buyer volumes. Sell - display only the seller volumes. BuySell -
                    FREE
                    The balance of supply and demand is a simple and effective market analysis method. The supply and demand diagram can show you in advance, even before the trend reversal, where the supply ends and the demand is already emerging, where the demand ends and the supply is emerging, while substantially increasing the probability of making a deal in the right direction and with a high profit factor. Indicator signals The indicator uses the price/volume values to generate signals: ED – excess demand.
                    35 USD
                    BoxProfile MT4
                    Evgeny Shevtsov
                    4.8 (15)
                    The indicator displays volume profiles based on the nesting principle. Profiles periods are pre-set so that each subsequent profile has a length twice as long as the length of the previous profile. In addition to profiles, the indicator displays volume clusters sorted by color, depending on the volume they contain. Indicator operation features The indicator works on typical timeframes from M5 to MN, but for calculations uses historical data from smaller timeframes: M1 - for timeframes from M5
                    FREE
                    BoxInside MT5
                    Evgeny Shevtsov
                    5 (4)
                    This indicator calculates the volume profile and places labels that correspond to the VAH, VAL and POC levels, for each candle individually. Indicator operation features The indicator works on the timeframes from M3 to MN, but it uses the history data of smaller periods: M1 - for periods from M3 to H1, M5 - for periods from H2 to H12, M30 - for the D1 period, H4 - for the W1 period, D1 - for the MN period. The color and location of the VAL, VAH and POC labels on the current candle are consider
                    FREE
                    Neural Predictor MT4
                    Evgeny Shevtsov
                    2 (1)
                    The indicator refers to the means of probabilistic analysis. Prediction is performed by the Monte Carlo method together with a mathematical model of a neuron. But, the modeling of samples for this method is made not artificially, but comes from the original "nature", that is, from history. The number of samples and the detail of their modeling is achieved using the lower (relative current) timeframe. Indicator algorithm : In general terms, the algorithm boils down to the fact that the ind
                    90 USD
                    FORTS Trading Data
                    Evgeny Shevtsov
                    3.67 (3)
                    The indicator has been designed for use on FORTS, but it can also work on other markets, at brokers broadcasting the required data. A peculiarity of these data is that they cannot be requested from the broker's server as a section of history, but can only be obtained for the current moment. The indicator periodically requests the broker, collects to a file and displays the following history from the stored file: The weighted average price. The volume of buy pending orders. The volume of sell pen
                    FREE
                    BoxInside MT4
                    Evgeny Shevtsov
                    4.56 (9)
                    This indicator calculates the volume profile and places labels that correspond to the VAH, VAL and POC levels, for each candle individually. Indicator operation features The indicator works on the timeframes from M5 to MN, but it uses the history data of smaller periods: M1 - for periods from M5 to H1, M5 - for the H4 period, M30 - for the D1 period, H4 - for the W1 period, D1 - for the MN period. The color and location of the VAL, VAH and POC labels on the current candle are considered to be
                    FREE
                    BoxChart MT5
                    Evgeny Shevtsov
                    5 (6)
                    The market is unfair if only because 10% of participants manage 90% of funds. An ordinary trader has slim changes to stand against these "vultures". This problem can be solved. You just need to be among these 10%, learn to predict their intentions and move with them. Volume is the only preemptive factor that faultlessly works on any timeframe and symbol. First, the volume appears and is accumulated, and only then the price moves. The price moves from one volume to another. Areas of volume accumu
                    33 USD
                    Market Marker MT5
                    Evgeny Shevtsov
                    3.8 (5)
                    The indicator displays peak levels of activity formed by the maximum volume, tracks the correlation of the candles on all timeframes (from the highest to the lowest one). Each volume level is a kind of key trading activity. The most important cluster is inside a month, week, day, hour, etc. Indicator operation features A volume level receives Demand status if the nearest volume level located to the left and above has been broken upwards. A volume level receives Supply status if the nearest vol
                    35 USD
                    BoxChart MT4
                    Evgeny Shevtsov
                    4.57 (7)
                    The market is unfair if only because 10% of participants manage 90% of funds. An ordinary trader has slim changes to stand against these "vultures". This problem can be solved. You just need to be among these 10%, learn to predict their intentions and move with them. Volume is the only preemptive factor that faultlessly works on any timeframe and symbol. First, the volume appears and is accumulated, and only then the price moves. The price moves from one volume to another. Areas of volume accumu
                    33 USD
                    This Expert Advisor analyzes the volume scale, divides the volumes into components (supply and demand), plots a diagram of supply and demand, and trades according to this diagram. Application of the supply and demand diagram as the main part of the trading strategy claims to be universal. However, not all trading instruments are fully subject to it. Nevertheless, the EA features a set of optional modes and contains several calibration variables, which can be used to achieve the most acceptable r
                    55 USD
                    Market Marker MT4
                    Evgeny Shevtsov
                    4.5 (8)
                    The indicator displays peak levels of activity formed by the maximum volume, tracks the correlation of the candles on all timeframes (from the highest to the lowest one). Each volume level is a kind of key trading activity. The most important cluster is inside a month, week, day, hour, etc. Indicator operation features A volume level receives Demand status if the nearest volume level located to the left and above has been broken upwards. A volume level receives Supply status if the nearest vol
                    35 USD
                    Dynamic POC MT4
                    Evgeny Shevtsov
                    The indicator calculates volume profiles dynamically and displays the result as VAL, VAH and POC curves. Indicator features The indicator uses the historical data of the lower (relative to the current) timeframes for calculations: M1 - for timeframes up to H1, M5 - for timeframe H1, M15 - for timeframe H4, H1 - for timeframe D1, H4 - for timeframe W1, D1 - for timeframe MN. The color of the DPOC curve sections is determined by comparing the volume of the POC levels of all profiles that make up
                    30 USD
                    This Expert Advisor analyzes the volume scale, divides the volumes into components (supply and demand), plots a diagram of supply and demand, and trades according to this diagram. Application of the supply and demand diagram as the main part of the trading strategy claims to be universal. However, not all trading instruments are fully subject to it. Nevertheless, the EA features a set of optional modes and contains several calibration variables, which can be used to achieve the most acceptable r
                    55 USD
                    The utility refers to probabilistic analysis tools, in particular the Monte Carlo method. The Monte Carlo method is defined as the simulation of processes in purpose to evaluate their probabilistic characteristics and apply them to the solvable task. Operation features The simulation uses a tick model with the subsequent transformation to the candles form, as a model as close as possible to the real market process. The utility generates a stream of a random tick sequence until a result with t
                    35 USD
                    The utility displays the order book, as well as increases its depth, remembering the location of applications that have gone beyond the current "window" view. With the utility user can perform quick trading actions in one click - placing/cancelling/editing of explicit and hidden orders, and also opening/editing positions. Utility features The orders book display works only on those trading symbols for which it is broadcast by the broker. To reset the information about the rows that were record
                    30 USD
                    Dynamic POC MT5
                    Evgeny Shevtsov
                    5 (2)
                    The indicator calculates volume profiles dynamically and displays the result as VAL, VAH and POC curves. Indicator features The indicator uses the historical data of the lower (relative to the current) timeframes for calculations: M1 - for timeframes up to H1, M5 - for timeframe H1, M15 - for timeframe H4, H1 - for timeframe D1, H4 - for timeframe W1, D1 - for timeframe MN. The color of the DPOC curve sections is determined by comparing the volume of the POC levels of all profiles that make u
                    30 USD
                    The indicator refers to the means of probabilistic analysis. Prediction is performed by the Monte Carlo method together with a mathematical model of a neuron. But, the modeling of samples for this method is made not artificially, but comes from the original "nature", that is, from history. The number of samples and the detail of their modeling is achieved using the lower (relative current) timeframe. Indicator algorithm : In general terms, the algorithm boils down to the fact that the ind
                    90 USD
                    필터:
                    Oleos
                    29
                    Oleos 2023.10.29 12:52 
                     

                    Отличный индикатор. Для меня было важно считывание данных с ленты. Не виснет. Отражает историю. Множество технических и визуальных настроек. Великолепная поддержка разработчика!

                    kramuse
                    37
                    kramuse 2021.02.03 10:34 
                     

                    Very well tunes indicator. Evgeny's designs are exceptional.

                    리뷰 답변
                    버전 3.2 2023.11.03
                    The indicator is recompiled in MT5 build 4053.
                    버전 3.1 2023.10.04
                    The indicator is recompiled in MT5 build 4000.
                    버전 3.0 2023.08.27
                    The menu list of the input variable “Calculation” has been modified :
                    ByEventsOfDeals - volumes are calculated as the number of real deals, without taking into account their volume.
                    BySizesOfDeals – volumes are calculated by real deals, taking into account their volume.
                    ByEventsOfAllTicks – volumes are calculated as the number of price ticks, without taking into account their size.
                    BySizesOfAllTicks – volumes are calculated by price ticks, taking into account their size.
                    ByEventsOfActiveTicks – volumes are calculated as the number of non-overlapped price ticks, without taking into account their size.
                    BySizesOfActiveTicks – volumes are calculated by non-overlapped price ticks, taking into account their size.
                    버전 2.9 2023.05.21
                    The indicator is recompiled in MT5 build 3742.
                    버전 2.8 2023.04.26
                    The input variable “HistoryLoadMode”, as a drop-down menu, sets the history loading mode in several options:

                    1. “FromSpecifiedTime” - by the start date/time specified in the input variable “HistoryStartTime”.
                    2. “InMonths” - by the number of months (from the beginning of the month) specified in the input variable “HistoryMonths” (value 0 means from the beginning of the current month).
                    3. “InWeeks” - by the number of weeks (from the beginning of the week) specified in the input variable “HistoryWeeks” (value 0 means from the beginning of the current week).
                    4. “InDays” - by the number of days (from the beginning of the day) specified in the input variable “HistoryDays” (value 0 means from the beginning of the current day).
                    5. “InHours” - by the number of hours (from the beginning of the hour) specified in the input variable “HistoryHours” (value 0 means from the beginning of the current hour).

                    With the advent of the input variable “HistoryLoadMode”, the input variables “Ticks” and “CumulativeStartTime” have been abolished as unnecessary.

                    A new mode “DeltaAsCandles” has been added to the list of “Mode” modes, which displays the delta in the form of candles.

                    The indicator works on history in the strategy tester, as well as when it is called from outside.
                    An example call code is attached on the “Comments” tab.
                    버전 2.7 2022.11.29
                    The indicator is recompiled in MT5 build 3521.
                    버전 2.6 2022.05.04
                    The indicator is recompiled in MT5 build 3280.
                    버전 2.5 2021.10.19
                    The indicator is recompiled in MT5 build 3082.
                    버전 2.4 2021.09.16
                    The indicator is recompiled in MT5 build 3035.
                    버전 2.3 2021.06.07
                    The indicator is recompiled in MT5 build 2946.
                    버전 2.2 2021.03.31
                    The input variable CumulativeReset sets the frequency of zeroing the cumulative delta.
                    The indicator is compiled in MT5 build 2860.
                    버전 2.1 2020.12.01
                    The Delta item of the input variable Mode now has two options:
                    - DeltaUpOnly - the delta columns are directed only up, regardless of the delta sign.
                    - DeltaUpAndDown - the delta columns are directed up and down, depending of the delta sign.

                    The indicator is compiled in MT5 build 2715.
                    버전 2.0 2020.10.16
                    The indicator is recompiled in MT5 build 2650.
                    버전 1.9 2020.07.14
                    The indicator is recompiled in MT5 build 2530.
                    버전 1.8 2020.04.13
                    The display of the levels grid is activated using the input variable Levels.
                    The color for levels grid is assigned using the input variable LevelsColor.
                    When the color value is set to None, the levels grid takes the grid color of the chart window.
                    버전 1.7 2019.11.30
                    If the input variable Ticks is set to zero, the history duration is assigned automatically.
                    버전 1.6 2019.11.25
                    Added dimension grid display.
                    In addition to the seconds timeframes, the calculated timeframe can be selected from the entire set of timeframes available in the terminal.
                    버전 1.5 2019.11.20
                    In addition to the standard timeframes, the indicator displays data regarding the second timeframes to choose from using the input variable Timeframe (S5, S10, S15, S20, S30).
                    To the list of modes of the input variable Mode has been added new mode Chart, which displays a price chart in the form of candles.
                    Cumulative delta with no period is now displayed as candles, but cumulative delta with a preset period CumulativePeriod is displayed only as curve.
                    The selection rectangle should now be applied directly to the indicator subwindow, and its function is active only in the modes Mode=Chart or Mode=CumDelta.
                    Note: For second timeframes it is recommended to set the input variable RecalculationTiming to a value smaller than displayed timeframe.
                    버전 1.4 2019.10.31
                    For trading symbols that have the tick history without the content of the list of deals, an interpretation algorithm is created:
                    Each positive Ask tick is interpreted as the unit of volume to buy.
                    Each negative Bid tick is interpreted as the unit of volume to sell.
                    This algorithm works in the mode Calculation=Interpretation and is relevant mainly for currency pairs.
                    버전 1.3 2019.02.10
                    Added a painting of the indicator histogram for candles whose direction is opposite to their delta.
                    버전 1.2 2019.02.03
                    The recalculation timing can be set by the user arbitrarily in seconds using the input variable RecalculationTiming.