Weis Wave Scouter

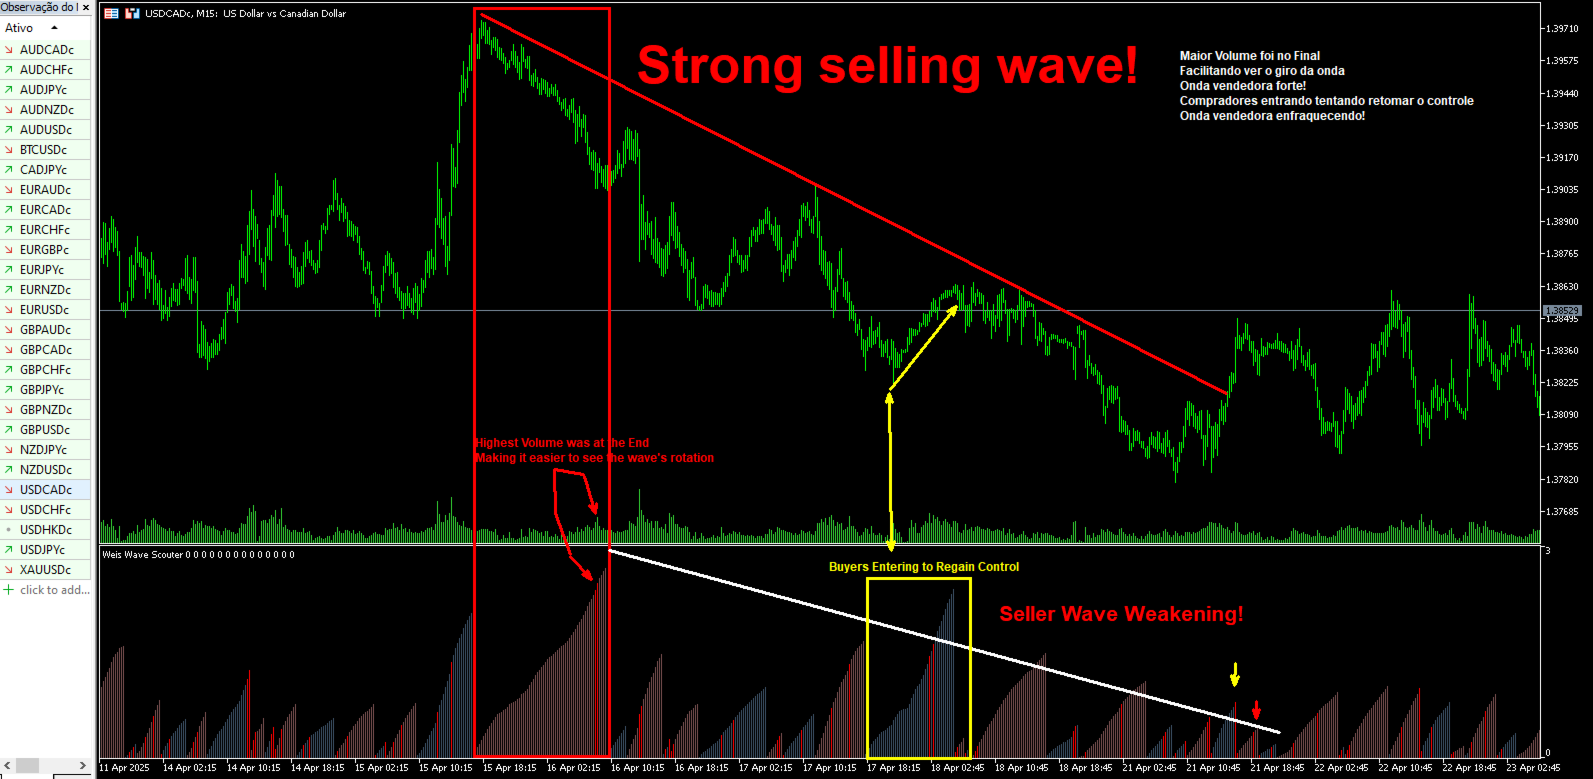
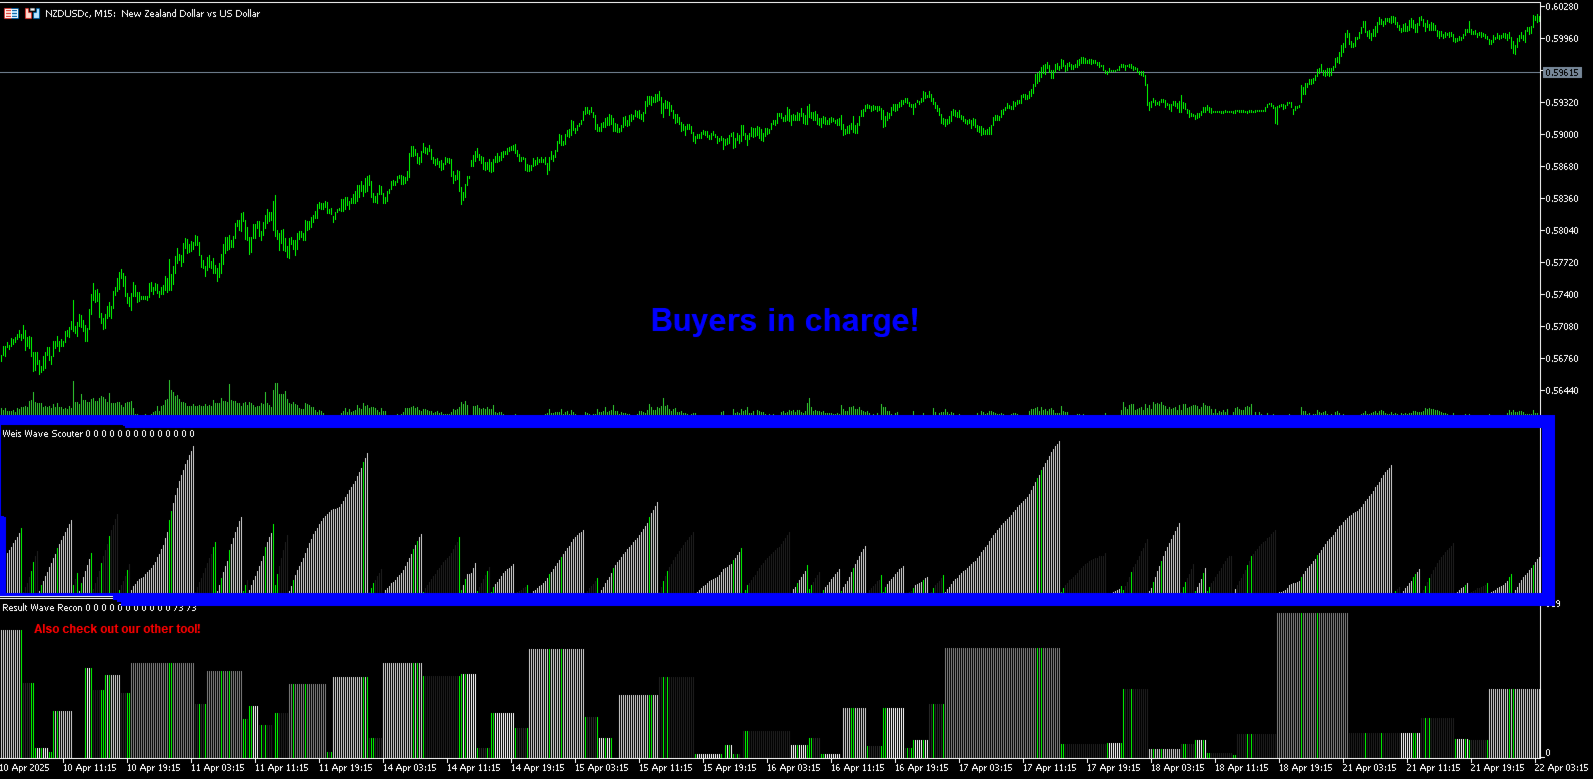
Weis Wave Scouter는 MetaTrader 5용으로 개발된 혁신적인 지표로, Wyckoff 방법론과 VSA(Volume Spread Analysis)의 검증된 원칙을 결합했습니다. 높은 정확성과 깊이 있는 분석을 원하는 트레이더를 위해 설계되었으며, 누적 거래량 파동 분석을 통해 시장을 전술적으로 읽고 추세 반전 및 지속의 핵심 포인트를 식별하는 데 도움을 줍니다.
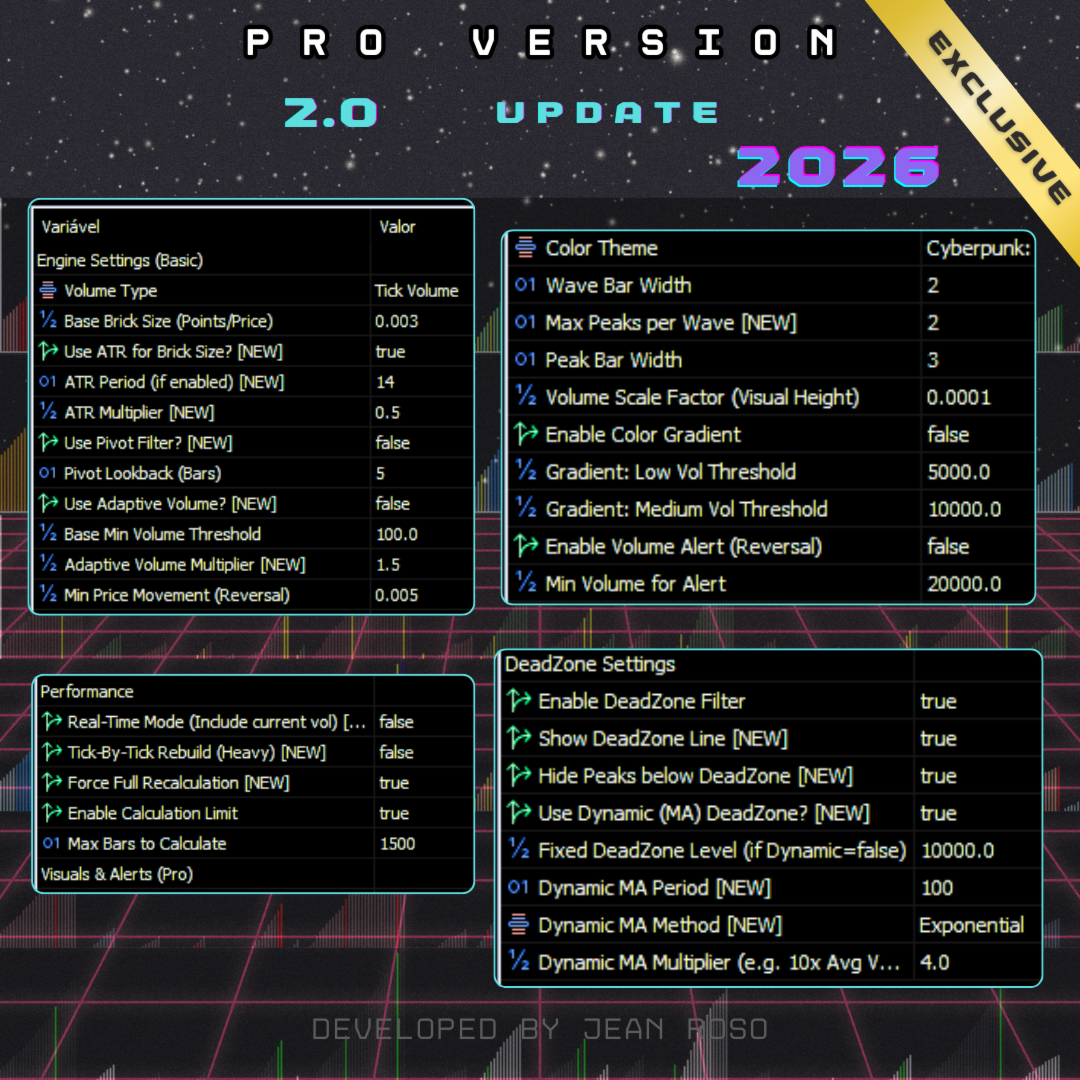
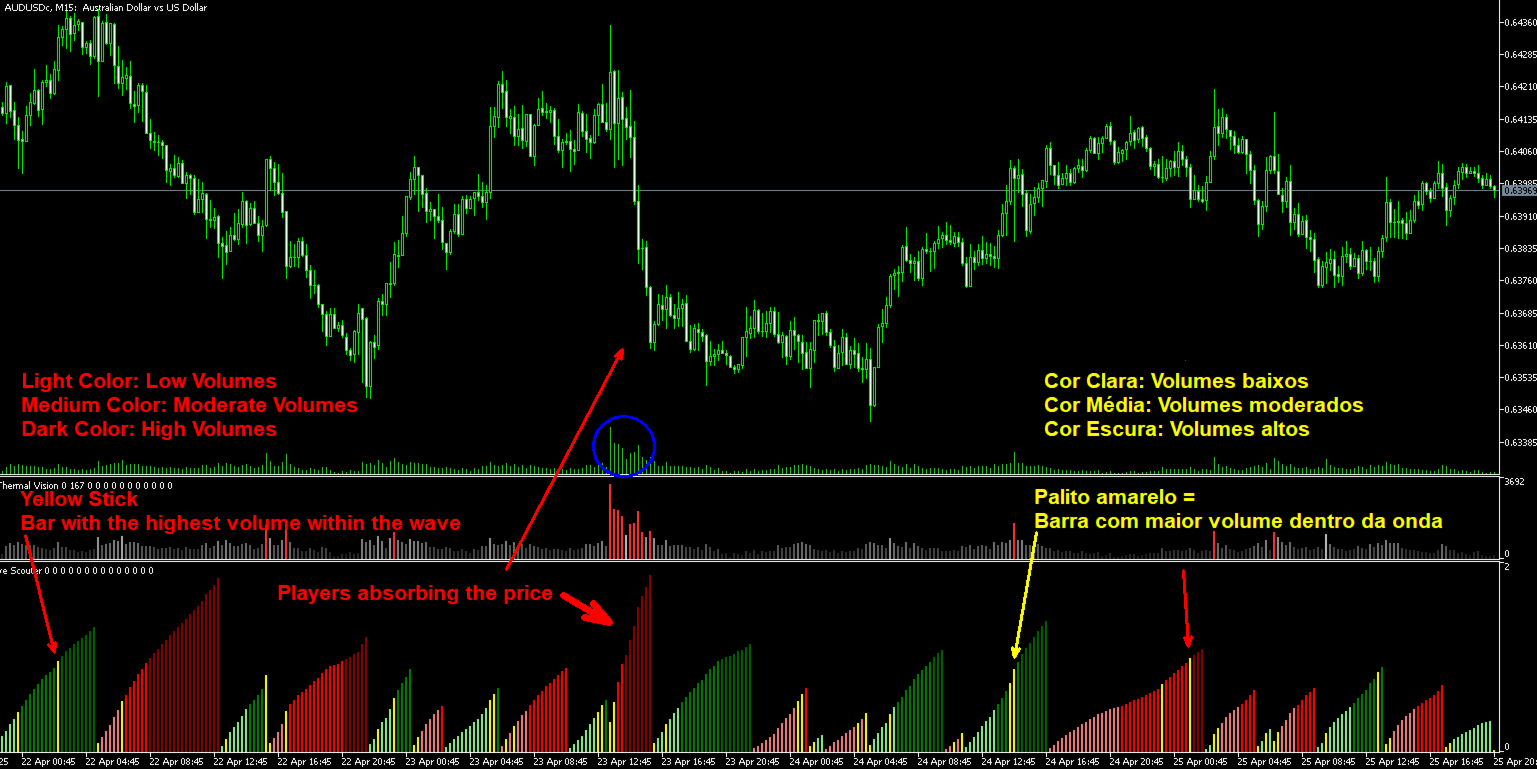
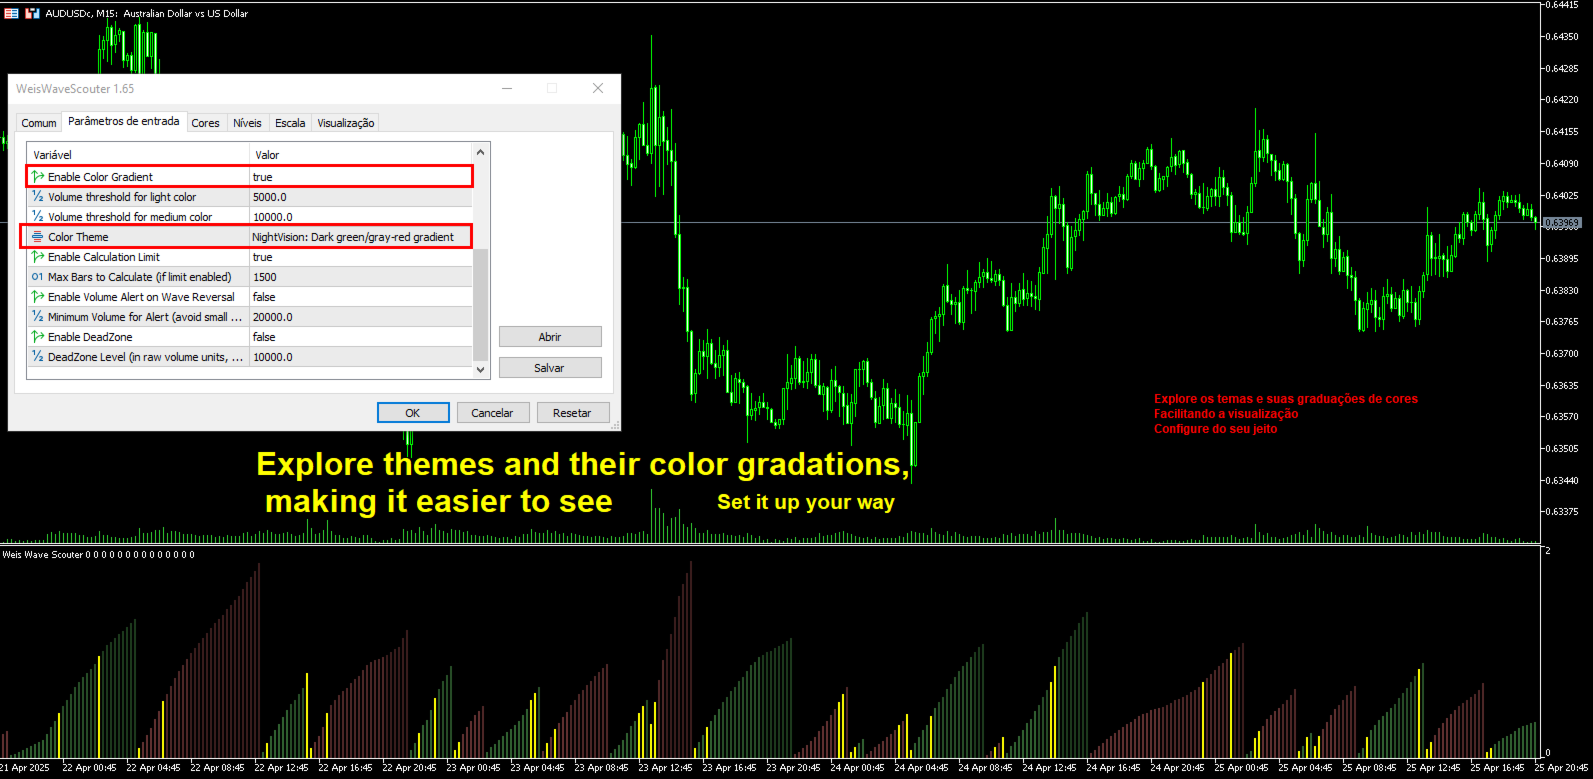
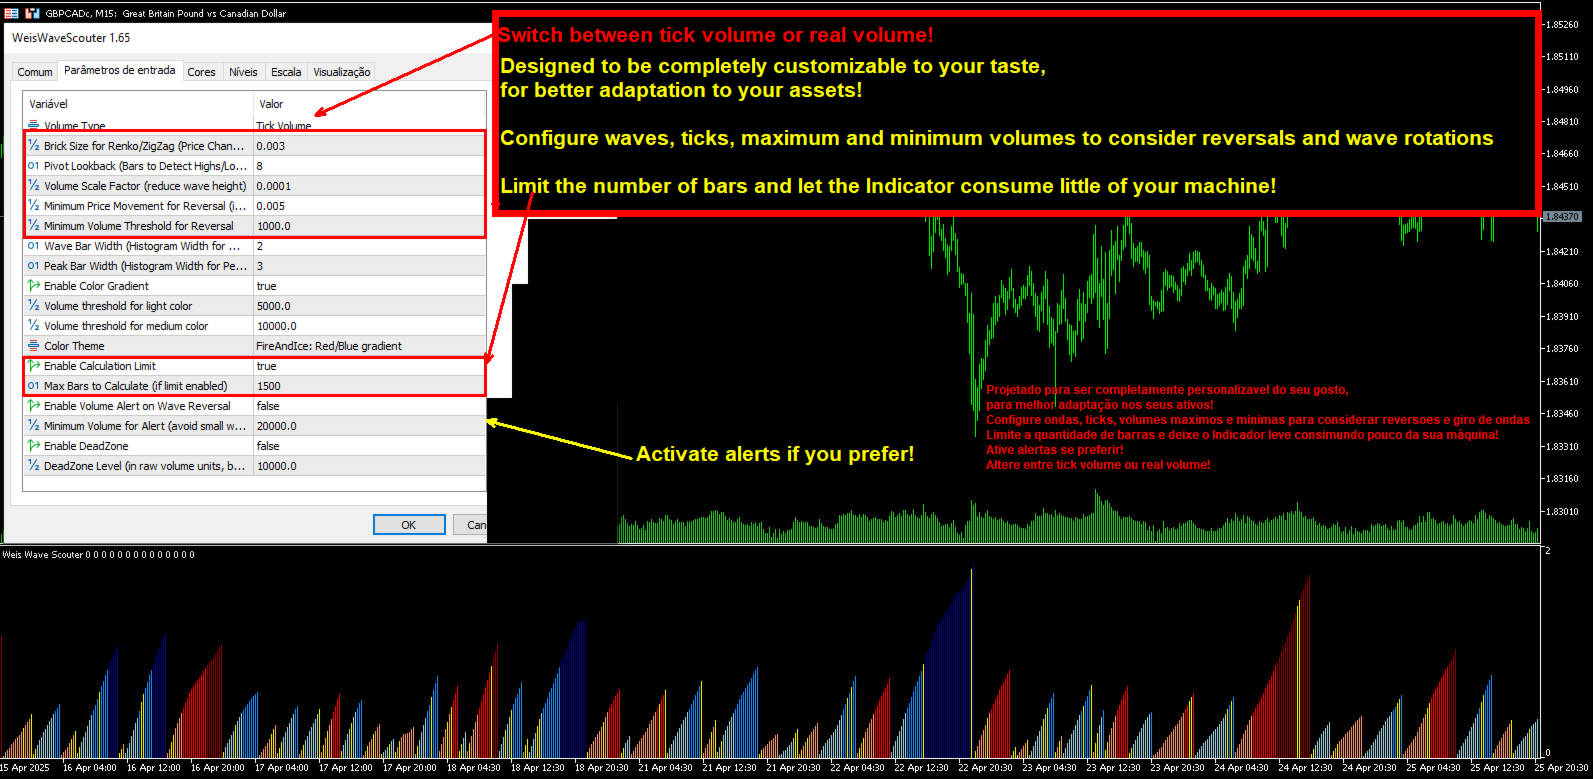
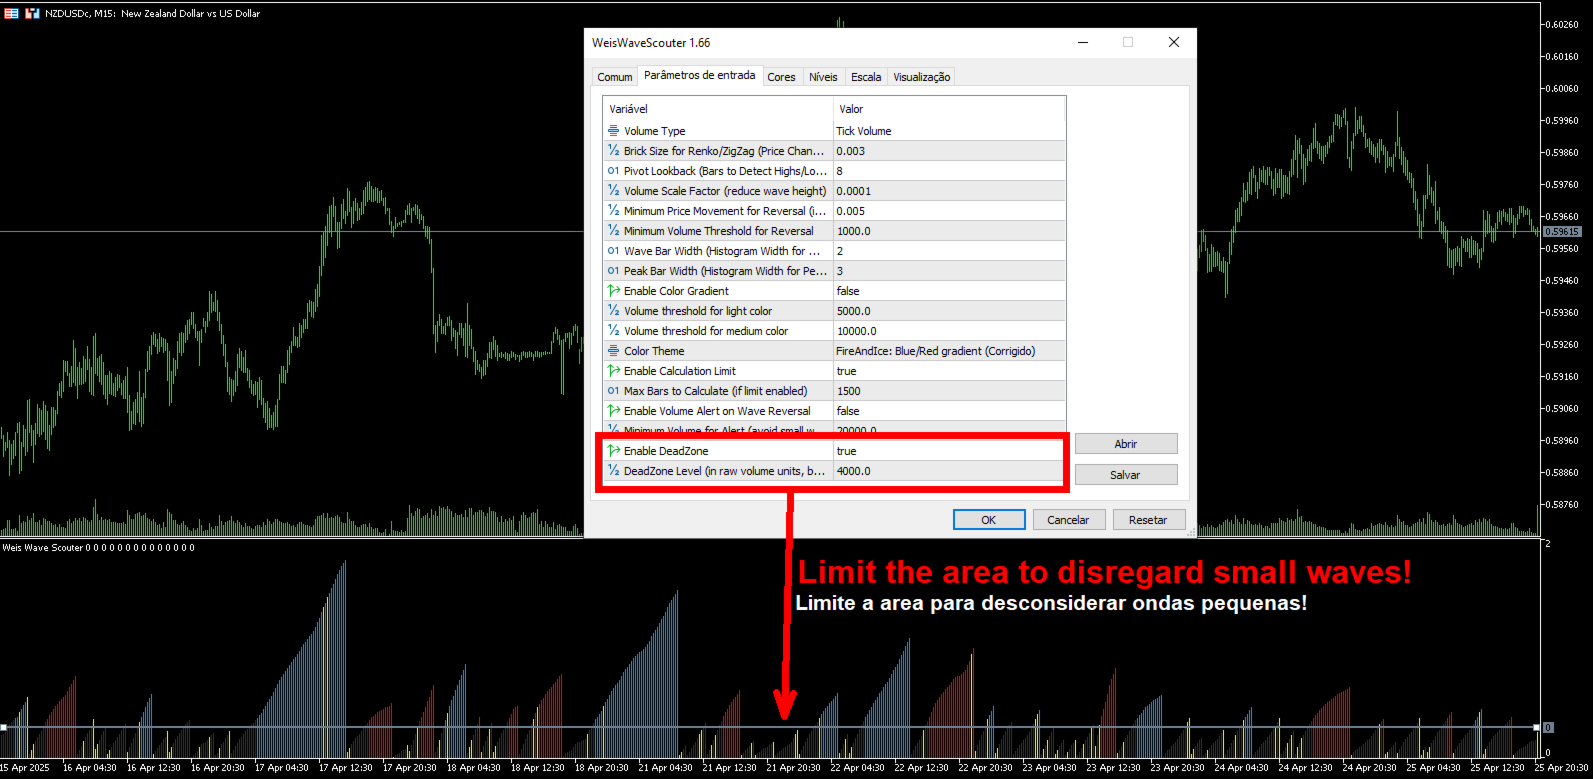
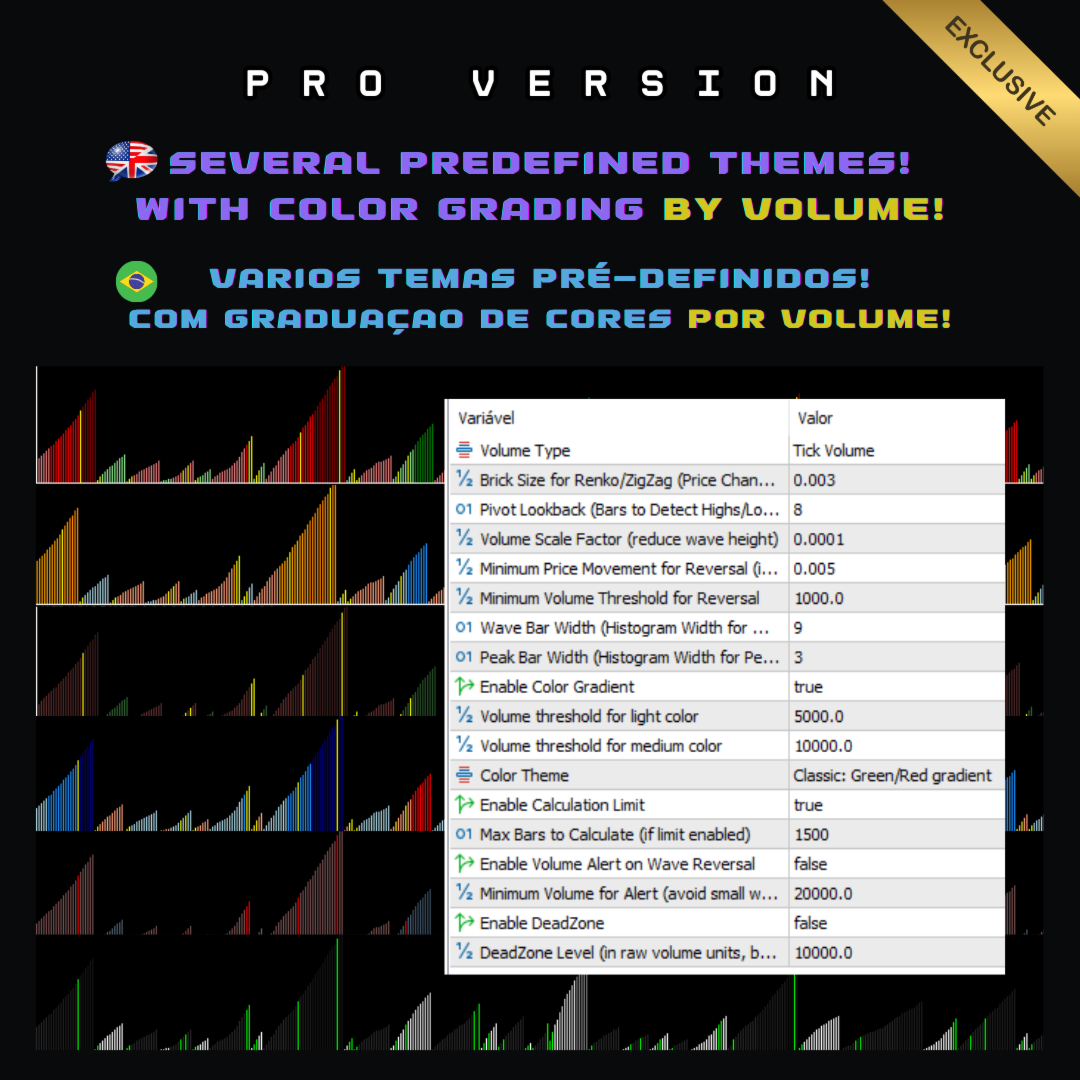
이 지표는 선명한 시각적 인터페이스를 제공하며, Classic, NightVision, OceanBreeze 등 다양한 테마의 사용자 지정 가능한 색상 히스토그램을 통해 상승 및 하락 파동을 시각화합니다. 주요 기능에는 거래량 급증 감지, 낮은 활동 영역(DeadZone) 식별, 거래량 기반 파동 반전 경고 설정이 포함되어 있습니다. 또한 노력 대비 결과 분석, 원인과 결과 분석, 수요와 공급 분석 등 Wyckoff 및 VSA 이론의 핵심 요소를 지원합니다. Brick Size, Volume Scale Factor, Pivot Lookback 같은 맞춤형 설정을 통해 다양한 거래 스타일과 자산에 쉽게 적용할 수 있습니다.
Weis Wave Scouter를 통해 시장 분석을 강화하고, 대형 플레이어처럼 거래량 역학을 지배하세요!


추천 제품
Wapv Price and volume
Eduardo Da Costa Custodio Santos
MT5용 WAPV 가격 및 거래량 표시기는 (Wyckoff Academy Wave Market) 및 (Wyckoff Academy Price and Volume) 도구 세트의 일부입니다. MT5용 WAPV 가격 및 거래량 표시기는 차트에서 거래량 움직임을 직관적인 방식으로 쉽게 시각화할 수 있도록 만들어졌습니다. 그것으로 당신은 최대 거래량의 순간과 시장이 전문적인 관심을 갖지 않는 순간을 관찰할 수 있습니다 시장이 "스마트 머니"의 움직임이 아니라 관성에 의해 움직이는 순간을 식별합니다. 사용자가 수정할 수 있는 4가지 색상으로 구성되어 있습니다. 빨간색 = 제안 증가 녹색 = 수요 증가 회색 양초 = 수요와 공급의 감소 파란색 = 스마트머니 연기 위쪽 방향으로의 움직임은 강도를 나타냅니다. 하향 움직임 약점을 나타냅니다. Price의 방향에 상관없이 가장 강한 Volume이 올라가야 합니다. R. Wyckoff의 이론에 따라 생성된 지표
The Accumulation / Distribution is an indicator which was essentially designed to measure underlying supply and demand. It accomplishes this by trying to determine whether traders are actually accumulating (buying) or distributing (selling). This indicator should be more accurate than other default MT5 AD indicator for measuring buy/sell pressure by volume, identifying trend change through divergence and calculating Accumulation/Distribution (A/D) level. Application: - Buy/sell pressure: above
Owl Smart Levels MT5
Sergey Ermolov
4.03 (32)
MT4 버전  |  FAQ Owl Smart Levels Indicator 는 Bill Williams 의 고급 프랙탈, 시장의 올바른 파동 구조를 구축하는 Valable ZigZag, 정확한 진입 수준을 표시하는 피보나치 수준과 같은 인기 있는 시장 분석 도구를 포함하는 하나의 지표 내에서 완전한 거래 시스템입니다. 시장과 이익을 취하는 장소로. 전략에 대한 자세한 설명 표시기 작업에 대한 지침 고문-거래 올빼미 도우미의 조수 개인 사용자 채팅 ->구입 후 나에게 쓰기,나는 개인 채팅에 당신을 추가하고 거기에 모든 보너스를 다운로드 할 수 있습니다 힘은 단순함에 있습니다! Owl Smart Levels 거래 시스템은 사용하기 매우 쉽기 때문에 전문가와 이제 막 시장을 연구하고 스스로 거래 전략을 선택하기 시작한 사람들 모두에게 적합합니다. 전략 및 지표에는 눈에 보이지 않는 비밀 공식 및 계산 방법이 없으며 모든 전략 지표는 공개되어 있습니다. Owl Smart Levels를 사
Blahtech Market Profile MT5
Blahtech Limited
5 (10)
Was: $249  Now: $99   Market Profile defines a number of day types that can help the trader to determine market behaviour. A key feature is the Value Area, representing the range of price action where 70% of trading took place. Understanding the Value Area can give traders valuable insight into market direction and establish the higher odds trade. It is an excellent addition to any system you may be using. Inspired by Jim Dalton’s book “Mind Over Markets”, this indicator is designed to suit the
Volume Profile V6
Andrey Kolesnik
4.67 (3)
시장 매물대 지표(Volume Profile) + 스마트 오실레이터. 통화 쌍, 주식, 선물, 암호화폐 등 거의 모든 종목에서 작동하며, 실제 거래량(Real Volume)과 틱 거래량(Tick Volume)을 모두 지원합니다. 프로파일 생성 범위를 일주일이나 한 달 등으로 자동 설정할 수 있을 뿐만 아니라, 두 개의 수직선(빨간색과 파란색)을 이동하여 수동으로 범위를 설정할 수도 있습니다. 히스트그램 형태로 표시되며, 특정 가격 수준의 히스토그램 너비는 해당 가격대에서 발생한 거래량을 의미합니다. Mode level line color 파라미터를 사용하면 가격이 반등할 가능성이 높은 주요 매물대 수준을 자동으로 표시할 수 있으며, Maximum color 파라미터는 설정된 전체 범위에서 거래가장 많이 발생한 최대 거래량 수준을 별도로 보여줍니다. 스마트 오실레이터는 과매수 및 과매도 구간을 표시합니다. 여러 지표로부터 오는 정보를 분석하고, 처리된 데이터를 바탕으로 과매수 및 과매
Donchian Time Sync Analyzer는   기존 Donchian 채널 분석에 강력한   다중 시간대   기능을 추가하여 트레이더가 다섯 가지 차트 기간에 걸쳐   추세 강도   와 잠재적   반전 신호를   동시에 모니터링할 수 있도록 합니다. 이 고급 지표는 선택한 시간대의 최고가와 최저가를 계산하여 여러 시간대에 걸쳐 추세 방향의 수렴을 파악하는 데 도움이 되는   명확한 시각적 신호를   생성합니다. 분 단위부터 시간 단위까지 통합된 분석을 제공함으로써 단일 시간대 도구보다 더 심층적인 시장 통찰력을 제공하여 트레이더가   중요한 돌파를 확인   하고 시간대 확인을 통해   잘못된 신호를 피할 수 있도록   지원합니다. 핵심 기능 이 정교한 도구는 검증된   돈키안 채널 전략을   여러 시간대에 걸쳐 동시에 적용하여 단기 가격 변동이 장기 추세와 일치하는지 여부를 보여주는 동기화된 신호를 표시합니다. 이 시스템은 선택한 시간대에서 가격이 중요한 지지선 또는 저항선
The Super Arrow Indicator provides non-repainting buy and sell signals with exceptional accuracy. Key Features No repainting – confirmed signals remain fixed Clear visual arrows: green for buy, red for sell Real-time alerts via pop-up, sound, and optional email Clean chart view with no unnecessary clutter Works on all markets: Forex, gold, oil, indices, crypto Adjustable Parameters TimeFrame Default:   "current time frame" Function:   Sets the time frame for indicator calculation Options:   Can
TRI Visualizer
Yoshimi Mon 三 Ura
TRI Visualizer MT5 – Thermodynamic Market Analysis Overview The TRI (Thermal Range Indicator) Visualizer Enhanced is a rare market analysis indicator that goes beyond conventional technical analysis, applying principles of thermodynamics from physics. It interprets market price fluctuations as “thermodynamic energy,” enabling the highly accurate detection of subtle market changes that are often overlooked. Innovative Mechanisms 1. Dual Calculation Engines Classic TRI Mode Formula: |Close
Renko Plus
Eadvisors Software Inc.
With Renko Plus you can use the features in the Indicator functionality, just add it to the Metatrader5 chart.             The Renko chart is a type of chart, developed by the Japanese, that is constructed using price movement rather than standardized prices and time intervals like most charts. It is believed to be named after the Japanese word for bricks, "renga", as the graphic looks like a series of bricks.             A new brick is created when the price moves a specified pri
Indicador Padroes de Reversao para Candles
SMART2TRADER SOLUCOES DE SOFTWARES INTELIGENTES LTDA
Developed by Smart Trader - Smart Reversion Pattern is an indicator capable of identifying reversal patterns , both bullish reversals and bearish reversals. It is designed to provide fast, real-time awareness of patterns. We also thought about the interface part, creating a clean and pleasant look to identify formation patterns on the chart. Note: If any pattern you need is not listed, just contact us and request inclusion - we usually respond within a few hours. Bearish Reversal Patterns
PZ Support Resistance MT5
PZ TRADING SLU
3.71 (7)
Unlock key market insights with automated support and resistance lines Tired of plotting support and resistance lines? This is a multi-timeframe indicator that detects and plots supports and resistance lines in the chart with the same precision as a human eye would. As price levels are tested over time and its importance increases, the lines become thicker and darker, making price leves easy to glance and evaluate. [ Installation Guide | Update Guide | Troubleshooting | FAQ | All Products ] Boos
Order Book, known also as Market Book, market depth, Level 2, - is a dynamically updated table with current volumes of orders to buy and to sell specific financial instument at price levels near Bid and Ask. MetaTrader 5 provides the means for receiving market book from your broker, but in real time only, without access to its history. The indicator OrderBook Cumulative Indicator accumulates market book data online and visualizes them on the chart. In addition, the indicator can show the market
Terra Infinity
Ivan Simonika
Terra Infinity is a flat indicator. This improved version of the CalcFlat indicator has three additional lines that significantly increase its effectiveness. Unlike its predecessor with two static levels, Terra Infinity adds three dynamic lines above the main histogram, which are interpreted as follows: base signal line, minimum signal line, maximum signal line. These lines are formed using the additional parameter Avg, which is the average value of the histogram. Averaging produces a line cl
+++++++++++++++++++++++++++++++++++++++++++++++++++++++++++++++++++++++++++++++++++++++++++++++++++++++ +++ Link to EURUSD Only Free Version -->  https://www.mql5.com/en/market/product/156904 +++ Full License -->  https://www.mql5.com/en/market/product/156842 +++++++++++++++++++++++++++++++++++++++++++++++++++++++++++++++++++++++++++++++++++++++++++++++++++++++ +++ XMAS SALE +++ Get this indicator for free when renting the Forecast System Full License  (one license for one account)   +++ Please
CVD (Cumulative Volume Delta) for MT5 CVD (Cumulative Volume Delta) for MT5 Simple, fast CVD for volume and order flow trading. It tracks net buying vs selling pressure and plots CVD as candles. The Data Window also shows tick count per candle. What it does Accumulates volume delta from ticks or a chosen timeframe Optional reset: No Reset, Current Chart Period, or a specific timeframe Works on any symbol and timeframe How it’s calculated Tick-based: each incoming tick is labeled as buyer- or sel
Cumulative Delta NG
Anton Polkovnikov
Cumulative delta indicator As most traders believe, the price moves under the pressure of market buying or selling. When someone redeems an offer standing in the cup, the deal is a "buy". If someone pours into the bid standing in the cup - the deal goes with the direction of "sale". The delta is the difference between purchases and sales. A cumulative delta - the difference between the cumulative sum of purchases and sales for a certain period of time. It allows you to see who is currently contr
CvdDeltaVolumes
Parasbhai N Patel
Delta + CVD & CVD Candles Order-flow indicator combining Delta (Ask–Bid), Cumulative Volume Delta (CVD), and a unique CVD-based synthetic candle system. Shows buy/sell pressure, volume aggressiveness, and momentum shifts with optional Delta histogram, CVD line, and CVD+Delta combined candles. Useful for scalping, intraday trading, divergence detection, and understanding buyer/seller dominance. Overview The Delta + CVD & CVD Candles Indicator combines multiple order-flow tools into one clean
Time and Sales Tick
Pablo Filipe Soares De Almeida
Time & Sales Tick Indicator 는 MetaTrader 5 차트에서 실시간 거래 틱 정보를 표시하는 지표입니다. 가격, 틱 거래량 및 시간을 시각적으로 보여주며, 사용자가 시장 미세 구조를 분석할 수 있도록 도와줍니다. 기능 설명 가격, 거래량 및 시간을 포함한 틱 데이터를 차트 내 패널에 실시간으로 표시합니다. 틱 데이터를 사용자가 지정한 시간 또는 수량 간격으로 그룹화하고, 상승 틱은 녹색, 하락 틱은 빨간색으로 구분하여 표시합니다. 패널은 차트의 네 모서리 중 원하는 위치로 자유롭게 이동할 수 있으며, 표시 크기와 글꼴도 사용자 설정이 가능합니다. 모든 통화쌍 및 상품에 대응하며 MetaTrader 5 플랫폼 내에서 안정적으로 작동합니다. 이 인디케이터는 스캘핑 및 틱 기반 전략을 사용하는 트레이더에게 유용합니다.
Volume Delta Candle
Muhammad Muzaffar Hussan
Volume Delta Candles: A Comprehensive Tool for In-Depth Trading Analysis Unlock a seamless way to interpret trading experience within each candle. With Volume Delta Candles, there's no need for additional volume indicators—everything you need is built in. This advanced tool utilizes lower timeframes or live market data to present the percentage of buying versus selling volume within each candle as an intuitive color-coded bar. Before diving in, ensure you’re familiar with Volume and Volume Delta
Crash 1000 Scalping Indicator for the Crash 1000 Deriv Synthetic Index. Introduction The Crash 1000 Scalping Indicator is a specialized tool designed for the Crash 1000 index on the Deriv Synthetic market. This indicator is particularly useful for scalping on the M1 timeframe, helping traders to identify precise entry and exit points for buy positions. It is designed to be non-repainting, providing clear signals with audible alerts and push notifications, and is compatible with mobile devices th
True Weis Wave
Atila Goncalves Firmino
A version based on David Waves' description in his book 'Trade About to Happen' of his adaptation of the Wyckoff wave chart. The indicator directionally accumulates volume, adding to each brick or candle close, with color indication for up and down. it can be used it with tick or real volume, it also changes color when the accumulated value of the previous wave is exceeded, being the trade signal. Yellow color is used for doji candlestick, it will continue with accumulation without zero the sum
SMC Venom Model BPR 지표는 Smart Money(SMC) 개념 내에서 일하는 트레이더를 위한 전문 도구입니다. 가격 차트에서 두 가지 주요 패턴을 자동으로 식별합니다. FVG (공정 가치 갭)는 3개의 캔들의 조합으로, 첫 번째와 세 번째 캔들 사이에 갭이 있습니다. 이는 볼륨 지원이 없는 레벨 사이에 구역을 형성하여 종종 가격 수정으로 이어집니다. BPR (균형 가격 범위)은 두 개의 FVG 패턴의 조합으로, "브리지"를 형성합니다. 이는 가격이 낮은 볼륨 활동으로 움직일 때 브레이크아웃과 레벨로의 복귀 구역으로, 캔들 사이에 갭을 생성합니다. 이러한 패턴은 거래자가 차트에서 거래량과 가격 역학을 분석하여 주요 지지/저항 수준, 돌파 구역 및 진입 지점을 식별하는 데 도움이 되며, 여기서 대형 시장 참여자와 일반 참여자 간의 상호 작용이 발생합니다. 이 지표는 사각형과 화살표 형태로 패턴을 시각화하며 유연한 경고 설정도 지원합니다. 주요 특징: 패턴 표시 모드
Buy Sell Smart
Syamsurizal Dimjati
BUY and SELL smart The BUY and SELL Smart Indicator is a next-generation trading tool engineered for precision scalpers, intraday strategists, and professional analysts who demand both speed and clarity in market visualization. It seamlessly integrates smart candle-based analytics, adaptive ATR logic, and real-time economic event awareness — giving you a fully synchronized view of market volatility and momentum. Through an elegant and optimized interface, FlashScalp delivers   instant signal fee
Delta Aggression Volume PRO is an indicator developed to monitor the strength and continuity of the aggression volume of sell and buy negotiations. Note: This indicator DOES NOT WORK for Brokers and/or Markets WITHOUT the type of aggression (BUY or SELL). Cryptocurrencies and Forex do not provide this type of data, that is, it does not work with them. O Delta Agrression Volume PRO has features that allow you to view beyond the delta volume of the day. Operation Multi symbols  (those who provid
WAPV Weis Wave Chart Forex
Eduardo Da Costa Custodio Santos
The Weis Wave Chart Forex for MT5 is a Price and Volume indicator. The Price and Volume reading was widely disseminated through Richard Demille Wyckoff based on the three laws created by him: Supply and Demand, Cause and Effect and Effort vs. Result. In 1900 R.Wyckoff already used the wave chart in his analyses. Many years later, around 1990, David Weis Automated R. Wyckoff's wave chart and today we bring you the evolution of David Weis' wave chart. It shows the amount of Volume and the amount o
Mini Chart Indicators
Flavio Javier Jarabeck
The Metatrader 5 has a hidden jewel called Chart Object, mostly unknown to the common users and hidden in a sub-menu within the platform. Called Mini Chart, this object is a miniature instance of a big/normal chart that could be added/attached to any normal chart, this way the Mini Chart will be bound to the main Chart in a very minimalist way saving a precious amount of real state on your screen. If you don't know the Mini Chart, give it a try - see the video and screenshots below. This is a gr
Premium level Pro
Dmitriy Kashevich
Premium level is a unique indicator with more than 80% accuracy of correct predictions! This indicator has been tested for more than two months by the best Trading Specialists! The author's indicator you will not find anywhere else! From the screenshots you can see for yourself the accuracy of this tool! 1 is great for trading binary options with an expiration time of 1 candle. 2 works on all currency pairs, stocks, commodities, cryptocurrencies Instructions: As soon as the red arrow app
Trade smarter, not harder: Empower your trading with Harmonacci Patterns This is arguably the most complete harmonic price formation auto-recognition indicator you can find for the MetaTrader Platform. It detects 19 different patterns, takes fibonacci projections as seriously as you do, displays the Potential Reversal Zone (PRZ) and finds suitable stop-loss and take-profit levels. [ Installation Guide | Update Guide | Troubleshooting | FAQ | All Products ] It detects 19 different harmonic pri
Volume Candle Indicator
Pablo Filipe Soares De Almeida
MetaTrader 5용 볼륨 컬러 히스토그램 지표 이 지표는 거래량을 별도의 창에 히스토그램 형태로 표시합니다. 각 막대는 캔들의 방향에 따라 색상이 지정되며, 종가가 시가보다 높을 경우 초록색(상승 추세), 낮을 경우 빨간색(하락 추세)으로 표시됩니다. 색상 변화를 통해 거래자는 가격 움직임과 거래량 간의 관계를 직관적으로 파악할 수 있습니다. 주요 기능 거래량 소스: 틱 볼륨 또는 실제 거래량 선택 가능. 거래량 히스토그램 위에 이동 평균선을 추가할 수 있으며, 이를 통해 거래량의 흐름을 부드럽게 시각화할 수 있습니다. 지원되는 평균 유형: SMA, EMA, SMMA, LWMA. 평균 기간은 사용자가 직접 설정 가능. 모든 종목과 차트 주기에서 완벽하게 호환되며, MetaTrader 5 플랫폼에서 안정적으로 작동합니다. 시각적으로 명확한 디자인으로 거래 결정에 필요한 정보를 빠르게 이해할 수 있습니다.
Overview Market Volume Profile Modes is a powerful MT5 volume distribution indicator that integrates multiple Volume Profile variants. Users can switch between different analysis modes through a simple menu selection. This indicator helps traders identify key price levels, support and resistance zones, and market volume distribution. Core Concepts • POC (Point of Control): The price level with the highest volume concentration, representing the market's accepted "fair value" area • VAH (Value A
이 제품의 구매자들이 또한 구매함
Divergence Bomber
Ihor Otkydach
4.9 (80)
이 지표를 구매하신 분께는 다음과 같은 혜택이 무료로 제공됩니다: 각 거래를 자동으로 관리하고, 손절/익절 수준을 설정하며, 전략 규칙에 따라 거래를 종료하는 전용 도우미 툴 "Bomber Utility" 다양한 자산에 맞게 지표를 설정할 수 있는 셋업 파일(Set Files) "최소 위험", "균형 잡힌 위험", "관망 전략" 모드로 설정 가능한 Bomber Utility의 셋업 파일 이 전략을 빠르게 설치, 설정, 시작할 수 있도록 돕는 단계별 영상 매뉴얼 주의: 위의 모든 보너스를 받기 위해서는 MQL5 개인 메시지 시스템을 통해 판매자에게 연락해 주세요. 독창적인 커스텀 지표인 “Divergence Bomber(다이버전스 봄버)”를 소개합니다. 이 지표는 MACD 다이버전스(괴리) 전략을 기반으로 한 올인원(All-in-One) 거래 시스템입니다. 이 기술 지표의 주요 목적은 가격과 MACD 지표 간의 다이버전스를 감지하고, **향후 가격이 어느 방향으로 움직일지를 알려주는
Azimuth Pro
Ottaviano De Cicco
5 (1)
LAUNCH PROMO Azimuth Pro price is initially set at 299$ for the first 100 buyers. Final price will be 499$ . THE DIFFERENCE BETWEEN RETAIL AND INSTITUTIONAL ENTRIES ISN'T THE INDICATOR — IT'S THE LOCATION. Most traders enter at arbitrary price levels, chasing momentum or reacting to lagging signals. Institutions wait for price to reach structured levels where supply and demand actually shift. Azimuth Pro maps these levels automatically: swing-anchored VWAP, multi-timeframe structure lines, an
Super Signal – Skyblade Edition 전문가용 노리페인트 / 노래그 트렌드 신호 시스템, 뛰어난 승률 제공 | MT4 / MT5용 1분, 5분, 15분과 같은 낮은 타임프레임에서 가장 좋은 성능을 보입니다. 핵심 기능: Super Signal – Skyblade Edition은 추세 매매를 위해 설계된 스마트 신호 시스템입니다. 이 시스템은 다중 필터 로직을 활용하여, 명확한 방향성과 실질적인 모멘텀이 수반된 고품질 추세만을 감지합니다. 이 시스템은   고점 또는 저점을 예측하지 않으며 , 다음 세 가지 조건이 모두 충족될 때만 신호를 발생시킵니다: 명확한 추세 방향 강화되는 모멘텀 건전한 변동성 구조 또한, 시장 세션 기반의 유동성 분석을 통해 신호의 신뢰성과 타이밍을 더욱 향상시킵니다. 신호 특성: 모든 화살표 신호는 100% 리페인트 없음 / 지연 없음 신호가 한 번 발생하면 고정되며, 깜빡이거나 사라지지 않음 차트 상의 시각적 화살표, 정보 패널, 팝업
Berma Bands
Muhammad Elbermawi
5 (7)
Berma Bands(BBs) 지표는 시장 동향을 파악하고 이를 활용하려는 트레이더에게 귀중한 도구입니다. 가격과 BBs 간의 관계를 분석함으로써 트레이더는 시장이 추세 단계인지 범위 단계인지를 분별할 수 있습니다. 자세한 내용을 알아보려면 [ Berma Home Blog ]를 방문하세요. 버마 밴드는 세 개의 뚜렷한 선으로 구성되어 있습니다. 어퍼 버마 밴드, 미들 버마 밴드, 로어 버마 밴드입니다. 이 선들은 가격 주위에 그려져 전체 추세에 대한 가격 움직임을 시각적으로 표현합니다. 이 밴드들 사이의 거리는 변동성과 잠재적인 추세 반전에 대한 통찰력을 제공할 수 있습니다. 버마 밴드 라인이 각각에서 분리될 때, 그것은 종종 시장이 횡보 또는 범위 이동 기간에 접어들고 있음을 시사합니다. 이는 명확한 방향 편향이 없음을 나타냅니다. 트레이더는 이러한 기간 동안 추세를 파악하기 어려울 수 있으며 더 명확한 추세가 나타날 때까지 기다릴 수 있습니다. 버마 밴드 라인이 단일 라인으로
Gold Sniper Scalper Pro
Ich Khiem Nguyen
3.5 (8)
Gold Sniper Scalper Pro는 MetaTrader 5용 전문 지표로, 트레이더가 진입 지점을 식별하고 리스크를 효과적으로 관리할 수 있도록 지원하기 위해 설계되었습니다. 이 지표는 시그널 감지 시스템, 자동 Entry/SL/TP 관리, 거래량 분석 및 실시간 성과 통계를 포함하는 포괄적인 분석 도구 세트를 제공합니다. 시스템 이해를 위한 사용자 가이드   |   기타 언어 사용자 가이드 주요 기능 시그널 감지 시스템 지표는 Price Action 분석 및 시장 구조를 기반으로 잠재적 진입 지점을 자동으로 감지합니다. 거래 기회 감지 시: - BUY 화살표(녹색) 또는 SELL 화살표(빨간색)가 차트에 표시됩니다 - 캔들이 색상으로 표시되어 시그널 영역을 식별합니다 - Entry/SL/TP 레벨이 자동으로 계산됩니다 시그널은 가격이 Entry 레벨에 도달할 때만 활성화되어, 시장에서 확인되지 않은 시그널을 필터링합니다. 지능형 Entry/SL/TP 관리 - Ent
AriX
Temirlan Kdyrkhan
1 (4)
AriX Indicator for MT5 A powerful trend-following and signal-evaluation tool AriX is a custom MT5 indicator that combines Moving Averages and ATR-based risk/reward logic to generate clear buy/sell signals. It visualizes dynamic SL/TP levels, evaluates past trade outcomes, and displays win/loss statistics in a clean on-chart panel. Key features include: Buy/Sell signals based on MA crossovers ATR-based SL/TP1/TP2/TP3 levels with visual lines and labels Signal outcome tracking with real-time stat
Grabber System MT5
Ihor Otkydach
4.82 (22)
탁월한 기술적 지표인 Grabber를 소개합니다. 이 도구는 즉시 사용 가능한 “올인원(All-Inclusive)” 트레이딩 전략으로 작동합니다. 하나의 코드 안에 강력한 시장 기술 분석 도구, 매매 신호(화살표), 알림 기능, 푸시 알림이 통합되어 있습니다. 이 인디케이터를 구매하신 모든 분들께는 다음의 항목이 무료로 제공됩니다: Grabber 유틸리티: 오픈 포지션을 자동으로 관리하는 도구 단계별 영상 매뉴얼: 설치, 설정, 그리고 실제 거래 방법을 안내 맞춤형 세트 파일: 인디케이터를 빠르게 자동 설정하여 최고의 성과를 낼 수 있도록 도와줍니다 다른 전략은 이제 잊어버리세요! Grabber만이 여러분을 새로운 트레이딩의 정점으로 이끌어 줄 수 있습니다. Grabber 전략의 주요 특징: 거래 시간 프레임: M5부터 H4까지 거래 가능한 자산: 어떤 자산이든 사용 가능하지만, 제가 직접 테스트한 종목들을 추천드립니다 (GBPUSD, GBPCAD, GBPCHF, AUDCAD, AU
우선적으로, 이 거래 도구는 전문적인 거래에 이상적인 비-다시 그리기 및 지연되지 않는 지표입니다.  온라인 강좌, 사용자 매뉴얼 및 데모. 스마트 가격 액션 컨셉트 인디케이터는 신규 및 경험 많은 트레이더 모두에게 매우 강력한 도구입니다. Inner Circle Trader Analysis 및 Smart Money Concepts Trading Strategies와 같은 고급 거래 아이디어를 결합하여 20가지 이상의 유용한 지표를 하나로 결합합니다. 이 인디케이터는 스마트 머니 컨셉트에 중점을 두어 대형 기관의 거래 방식을 제공하고 이동을 예측하는 데 도움을 줍니다.  특히 유동성 분석에 뛰어나 기관이 어떻게 거래하는지 이해하는 데 도움을 줍니다. 시장 트렌드를 예측하고 가격 변동을 신중하게 분석하는 데 탁월합니다. 귀하의 거래를 기관 전략에 맞추어 시장의 동향에 대해 더 정확한 예측을 할 수 있습니다. 이 인디케이터는 시장 구조를 분석하고 중요한 주문 블록을 식별하고 다양
Advanced Supply Demand MT5
Bernhard Schweigert
4.5 (14)
현재 33% 할인! 초보자나 전문 트레이더를 위한 최고의 솔루션! 이 보조지표는 우리가 다수의 독창적 기능과 새로운 공식을 통합한 독특하고 고품질이며 저렴한 거래 도구입니다. 이 업데이트를 통해 이중 시간대를 표시할 수 있습니다. 더 높은 TF를 표시할 수 있을 뿐만 아니라 차트 TF와 더 높은 TF 모두를 표시할 수 있습니다: 중첩 영역 표시. 모든 Supply Demand 트레이더들이 좋아할 것입니다. :) 중요한 정보 공개 Advanced Supply Demand의 잠재력을 극대화하려면 다음을 방문하십시오. https://www.mql5.com/ko/blogs/post/720245   진입 또는 목표의 명확한 트리거 포인트를 정확히 찾아냄으로 해서 거래가 어떻게 개선될지 상상해 보십시오. 새로운 알고리즘을 기반으로 매수자와 매도자 간의 잠재적인 불균형을 훨씬 더 쉽게 분간할 수 있습니다. 왜냐하면 가장 강한 공급영역과 가장 강한 수요 영역과 과거에 어떻게 진행 되었는지를(이전
ARICoins
Temirlan Kdyrkhan
ARICoin is a powerful trading companion designed to generate high-probability entry signals with dynamic TP/SL/DP levels based on volatility. Built-in performance tracking shows win/loss stats, PP1/PP2 hits, and success rates all updated live. Key Features: Buy/Sell signals with adaptive volatility bands Real-time TP/SL/DP levels based on ATR Built-in MA Filter with optional ATR/StdDev volatility Performance stats panel (Success, Profit/Loss, PP1/PP2) Alerts via popup, sound, push, or email Cust
ARIScalping
Temirlan Kdyrkhan
ARIScalp is a powerful trading companion designed to generate high-probability entry signals with dynamic TP/SL/DP levels based on volatility. Built-in performance tracking shows win/loss stats, PP1/PP2 hits, and success rates all updated live. Key Features: Buy/Sell signals with adaptive volatility bands Real-time TP/SL/DP levels based on ATR Built-in MA Filter with optional ATR/StdDev volatility Performance stats panel (Success, Profit/Loss, PP1/PP2) Alerts via popup, sound, push, or email Cus
Trend Forecaster
Alexey Minkov
5 (7)
The Trend Forecaster indicator utilizes a unique proprietary algorithm to determine entry points for a breakout trading strategy. The indicator identifies price clusters, analyzes price movement near levels, and provides a signal when the price breaks through a level. The Trend Forecaster indicator is suitable for all financial assets, including currencies (Forex), metals, stocks, indices, and cryptocurrencies. You can also adjust the indicator to work on any time frames, although it is recommen
PZ Swing Trading MT5
PZ TRADING SLU
5 (5)
Protect against whipsaws: revolutionize your swing trading approach Swing Trading is the first indicator designed to detect swings in the direction of the trend and possible reversal swings. It uses the baseline swing trading approach, widely described in trading literature. The indicator studies several price and time vectors to track the aggregate trend direction and detects situations in which the market is oversold or overbought and ready to correct. [ Installation Guide | Update Guide | Tro
무료 AUX 인디케이터와 EA 지원을 받으세요 직접 다운로드 — 여기를 클릭 [ D.I.C.E ] The DICE Indicator  Divergence in Chaos Environment는 엘리엇 파동 이론과 트레이딩 카오스 기법을 함께 사용하는 트레이더를 위해 설계된 MT5 전문 도구입니다. 가격 움직임의 숨겨진 및 일반 다이버전스를 감지하며, 빌 윌리엄스가 설명한 혼돈 시장 환경과 동기화됩니다. 주요 특징 엘리엇 파동 정렬 다이버전스: 파동 구조에 조화된 강세 및 약세 다이버전스를 탐지하여 파동 카운팅 정확도를 높입니다. 카오스 기법 통합: AO(오썸 오실레이터) 및 시장 구조 원칙과 일치하도록 설계되었습니다. 다중 타임프레임 스캐닝: 다양한 시간 프레임에서 다이버전스를 분석하여 모멘텀 변화와 추세 소진을 확인합니다. 시각적 알림 및 객체: 명확한 화살표, 선, 표시로 빠른 인식 가능. 적응형 시장 판독: 혼돈 시장 조건에 자동으로 조정되어 노이즈를 필터링하고 유효한 셋업만
SHOGUN TRADE PRO v3.82 ~ Cut Through the Noise. Master the "Commander's Eye." The Ultimate Dow Theory Market Structure Suite. ~ Click here for the MT4 version   https://www.mql5.com/en/market/product/158467 1. Introduction: Why Do Most Traders Get Lost in the "Forest"? Are you constantly swayed by the noise of the 1-minute chart, losing money on emotional entries? A soldier running around the battlefield without a map cannot survive. The only one who survives and wins is the "Commander," who o
Gartley Hunter Multi
Siarhei Vashchylka
5 (11)
Gartley Hunter Multi - An indicator for searching for harmonic patterns simultaneously on dozens of trading instruments and on all possible timeframes. Manual (Be sure to read before purchasing) | Version for MT4 Advantages 1. Patterns: Gartley, Butterfly, Shark, Crab. Bat, Alternate Bat, Deep Crab, Cypher 2. Simultaneous search for patterns on dozens of trading instruments and on all possible timeframes 3. Search for patterns of all possible sizes. From the smallest to the largest 4. All fou
WVAP Scalping
Domantas Juodenis
VWAP Scalping Pro – Advanced VWAP & Market Profile System Professional-Grade VWAP + Market Profile Technology for Precision Trading VWAP Scalping Pro is an advanced analytical tool that integrates Volume-Weighted Average Price (VWAP) analysis with professional Market Profile visualization. It provides traders with institutional-style insights into price structure, volume distribution, and session dynamics — ideal for scalping, intraday, and swing trading strategies. Key Features Triple VWAP St
MetaForecast M5
Vahidreza Heidar Gholami
5 (3)
MetaForecast는 가격 데이터의 조화를 기반으로 모든 시장의 미래를 예측하고 시각화합니다. 시장이 항상 예측 가능한 것은 아니지만 가격에 패턴이 있다면 MetaForecast는 가능한 정확하게 미래를 예측할 수 있습니다. 다른 유사한 제품과 비교했을 때, MetaForecast는 시장 동향을 분석하여 더 정확한 결과를 생성할 수 있습니다. 입력 매개변수 Past size (과거 크기) MetaForecast가 미래 예측을 생성하기 위한 모델을 만드는 데 사용하는 막대의 수를 지정합니다. 모델은 선택한 막대 위에 그려진 노란색 선으로 표시됩니다. Future size (미래 크기) 예측해야 할 미래 막대의 수를 지정합니다. 예측된 미래는 핑크색 선으로 표시되며 그 위에 파란색 회귀선이 그려집니다. Degree (차수) 이 입력은 MetaForecast가 시장에서 수행할 분석 수준을 결정합니다. Degree 설명  0 차수 0의 경우, "Past size" 입력에 모든 봉우리와
Weis Wave with Alert MT5
Trade The Volume Waves Single Member P.C.
4.94 (17)
Rental/Lifetime Package Options and Privileges  Rent Monthly Six Months   Yearly/Lifetime Weis Wave with Speed with Alert+Speed Index x x x Manual  x x x Quick Set up Video x x x Blog x x x Lifetime Updates x x x Setup and Training Material x x Discord Access Channel "The SI traders"          x Rectangle Break Alert Tool      x How to trade with it:    http://www.tradethevolumewaves.com   ** If you purchase please contact me to setup your  : Training Room and  complete manual access.  Wei
Rtc ML Ai Predictor
Muhammad Faisal Sagala
Rtc ML Ai | Predictor CORE MACHINE LEARNING ENGINE Adaptive ML Market Predictor – Multi-Bar Trend & Candle Forecast What This Indicator Does This indicator is a  real-time market prediction engine  designed to analyze price behavior and estimate  future market tendencies . Unlike conventional indicators, this system  does not rely on static parameters or historical curve-fitting , but adapts its internal state dynamically during live market operation. Instead of using static rules, the indic
Quantum TrendPulse
Bogdan Ion Puscasu
5 (20)
SuperTrend   ,   RSI   ,   Stochastic   의 힘을 하나의 포괄적인 지표로 결합하여 트레이딩 잠재력을 극대화하는 궁극의 트레이딩 도구   인 Quantum TrendPulse를   소개합니다. 정밀성과 효율성을 추구하는 트레이더를 위해 설계된 이 지표는 시장 추세, 모멘텀 변화, 최적의 진입 및 종료 지점을 자신 있게 식별하는 데 도움이 됩니다. 주요 특징: SuperTrend 통합:   주요 시장 추세를 쉽게 따라가고 수익성의 물결을 타세요. RSI 정밀도:   매수 과다 및 매도 과다 수준을 감지하여 시장 반전 시점을 파악하는 데 적합하며 SuperTrend 필터로 사용 가능 확률적 정확도:   변동성이 큰 시장에서 숨겨진 기회를 찾기 위해 확률적 진동   을 활용하고 SuperTrend의 필터로 사용 다중 시간대 분석:   M5부터 H1 또는 H4까지 다양한 시간대에 걸쳐 시장을 최신 상태로 유지하세요. 맞춤형 알림:   맞춤형 거래 조건이 충족되면
Meravith MT5
Ivan Stefanov
이 인디케이터는 임의의 지점에서 거래량을 분석하고 해당 거래량의 시장 소진(exhaustion) 수준을 계산합니다. Meravith 주요 라인: 강세 거래량 소진선 – 목표로 사용됩니다. 약세 거래량 소진선 – 목표로 사용됩니다. 추세선 – 시장 추세를 나타냅니다. 시장이 강세인지 약세인지에 따라 색상이 변경되며, 추세 지지선 역할을 합니다. 사용 방법: 보라색 세로선을 더블 클릭한 후 원하는 위치로 이동시키십시오. 추세와 조정을 포함해 무엇이든 분석할 수 있습니다. 인디케이터를 시장의 상단, 하단 또는 중요하다고 생각되는 임의의 지점으로 이동시킬 수 있습니다. 좋은 방법은 시장이 소진선 사이에 머물도록 Meravith를 설정하는 것입니다. 이렇게 하면 추적할 수 있는 명확한 목표를 갖게 됩니다. 초기 소진선이 돌파되면 새로운 소진선이 나타나며, 추가로 거래 가능한 채널이 형성됩니다. 소진 수준에 도달하면 인디케이터의 위치를 다시 조정하거나 다른 시간 프레임으로 전환하여 새로운 소진
Elliott Wave Trend MT5
Young Ho Seo
4 (4)
Elliott Wave Trend was designed for the scientific wave counting. This tool focuses to get rid of the vagueness of the classic Elliott Wave Counting using the guideline from the template and pattern approach. In doing so, firstly Elliott Wave Trend offers the template for your wave counting. Secondly, it offers Wave Structural Score to assist to identify accurate wave formation. It offers both impulse wave Structural Score and corrective wave Structure Score. Structural Score is the rating to sh
Entry Points Pro for MT5
Yury Orlov
4.48 (138)
다시 색을 칠하지 않고 거래에 진입할 수 있는 정확한 신호를 제공하는 MT5용 지표입니다. 외환, 암호화폐, 금속, 주식, 지수 등 모든 금융 자산에 적용할 수 있습니다. 매우 정확한 추정값을 제공하고 매수와 매도의 가장 좋은 시점을 알려줍니다. 하나의 시그널로 수익을 내는 지표의 예와 함께 비디오 (6:22)시청하십시오! 대부분의 거래자는 Entry Points Pro 지표의 도움으로 첫 거래 주 동안 트레이딩 결과를 개선합니다. 저희의   Telegram Group 을 구독하세요! Entry Points Pro 지표의 좋은점. 재도색이 없는 진입 신호 신호가 나타나고 확인되면(시그널 캔들이 완성된 경우) 신호는 더 이상 사라지지 않습니다. 여타 보조지표의 경우 신호를 표시한 다음 제거되기 때문에 큰 재정적 손실로 이어집니다. 오류 없는 거래 게시 알고리즘을 통해 트레이드(진입 또는 청산)를 할 이상적인 순간을 찾을 수 있으며, 이를 통해 이를 사용하는 모든 거래자의 성공률이
PZ Day Trading MT5
PZ TRADING SLU
2.83 (6)
Effortless trading: non-repainting indicator for accurate price reversals This indicator detects price reversals in a zig-zag fashion, using only price action analysis and a donchian channel. It has been specifically designed for short-term trading, without repainting or backpainting at all. It is a fantastic tool for shrewd traders aiming to increase the timing of their operations. [ Installation Guide | Update Guide | Troubleshooting | FAQ | All Products ] Amazingly easy to trade It provides
" Dynamic Scalper System MT5 " 지표는 추세 파동 내에서 스캘핑 방식으로 거래하도록 설계되었습니다. 주요 통화쌍 및 금에서 테스트되었으며, 다른 거래 상품과의 호환성이 가능합니다. 추가적인 가격 변동 지원을 통해 추세에 따라 단기 포지션 진입 신호를 제공합니다. 지표의 원리 큰 화살표는 추세 방향을 결정합니다. 작은 화살표 형태의 스캘핑 신호를 생성하는 알고리즘은 추세 파동 내에서 작동합니다. 빨간색 화살표는 상승 방향을, 파란색 화살표는 하락 방향을 나타냅니다. 민감한 가격 변동선은 추세 방향으로 그려지며, 작은 화살표의 신호와 함께 작용합니다. 신호는 다음과 같이 작동합니다. 적절한 시점에 선이 나타나면 진입 신호가 형성되고, 선이 있는 동안 미결제 포지션을 유지하며, 완료되면 거래를 종료합니다. 권장되는 작업 시간대는 M1~H4입니다. 화살표는 현재 캔들에 형성되며, 다음 캔들이 이미 시작되었더라도 이전 캔들의 화살표는 다시 그려지지 않습니다. 입
물론입니다. 아래는 제공해주신 텍스트의 한국어 번역입니다: MT4용 천문학 지표 소개: 귀하의 최상급 하늘 트레이딩 동반자 트레이딩 경험을 천체의 높이로 끌어올리기 준비가 되셨나요? MT4용 천문학 지표를 소개합니다. 이 혁신적인 도구는 복잡한 알고리즘의 힘을 활용하여 탁월한 천문학적 통찰과 정밀한 계산을 제공합니다. 정보의 우주를 손에 담다:   천문학적 데이터의 보물함을 드러내는 포괄적인 패널을 살펴보세요. 행성의 지오/헬리오센트릭 좌표, 태양/지구 거리, 크기, 길이, 별자리, 황도 좌표 및 적도 좌표, 심지어 수평 좌표 등 각각이 정밀하게 계산되고 아름답게 제시됩니다. 지표에 의해 생성된 수직선은 시간 값에 해당하여 트레이딩 여정에 우주적인 시각을 부여합니다. 행성 라인과 관계:   수정 가능한 스케일과 각도로 차트를 장식하는 행성 라인의 마법을 경험해보세요. 직관적인 컨트롤 패널을 통해 각 행성의 라인의 가시성을 손쉽게 전환할 수 있습니다. 쥰션이나 섹스타일, 사분각, 삼분
PZ Divergence Trading MT5
PZ TRADING SLU
3.71 (7)
Unlock hidden profits: accurate divergence trading for all markets Tricky to find and scarce in frequency, divergences are one of the most reliable trading scenarios. This indicator finds and scans for regular and hidden divergences automatically using your favourite oscillator. [ Installation Guide | Update Guide | Troubleshooting | FAQ | All Products ] Easy to trade Finds regular and hidden divergences Supports many well known oscillators Implements trading signals based on breakouts Displays
SynaptixQuant Dominance Matrix
Devie Arevalo Montemayor
5 (1)
SynaptixQuant Dominance Matrix: Institutional-Grade Market State Extraction Engineered for traders who require a data-driven view of market behaviour beyond surface-level indicators. The Synaptix Quant (SQ) Dominance Matrix is not a conventional currency strength display. Behind its intentionally streamlined interface runs a sophisticated analytical architecture designed to quantify market conditions with precision. Every output is generated through layered signal processing built to identify d
Shock Pullback
Suleiman Alhawamdah
5 (1)
간단히 말해, 현재 캔들 옆에 흰색 숫자(‘핍’이라고 불림)의 움직임이 나타나기 시작하면 거래를 시작할 수 있습니다. 흰색 ‘핍’은 현재 매수 또는 매도 거래가 활성화되어 있으며 흰색으로 표시된 것처럼 올바른 방향으로 움직이고 있음을 나타냅니다. 흰색 핍의 움직임이 멈추고 정적인 녹색으로 바뀌면 이는 현재 모멘텀의 종료를 의미합니다. 숫자의 녹색은 매수 또는 매도 거래를 통해 얻은 총 수익을 ‘핍’ 단위로 나타냅니다. 또한, 인디케이터 내의 다른 고급 전문 분석 도구를 활용하여 거래를 시작할 수 있습니다. 인디케이터에 표시되는 신호와 색상을 관찰함으로써 높은 정확도로 수많은 스캘핑 기회를 포착할 수 있습니다. 테스트 중이거나 실시간 차트에서 인디케이터를 충분히 이해하는 것이 중요합니다. 대부분의 외환 시장에 적합: 금 거래 및 인기 있는 지수 시장(Dow Jones, S&P 500, Nasdaq, DAX 등), 그리고 EUR/USD, GBP/USD, USD/JPY 등 강력한 통화쌍
제작자의 제품 더 보기
Weis Wave Scouter Basic
Jean Carlos Martins Roso
5 (1)
Weis Wave Scouter Basic은 MetaTrader 5용으로 설계된 당사의 유명한 인디케이터의 기본 버전으로, Wyckoff 방법론과 VSA(Volume Spread Analysis) 개념을 쉽고 효율적으로 탐색하려는 트레이더를 위해 설계되었습니다. 볼륨 파동 읽기를 기반으로 하여 시장 움직임을 명확하게 식별할 수 있으며, Richard Wyckoff가 가르친 노력 대 결과 및 수요 공급 원칙에 중점을 둡니다. Weis Wave Scouter Basic을 사용하면 기본 색상 테마(Classic)로 상승 및 하락 파동을 직관적인 히스토그램으로 시각화할 수 있어 트렌드 및 반전 해석이 쉬워집니다. Brick Size 및 Volume Scale Factor와 같은 기본 조정을 지원하며, 틱 볼륨 또는 실제 볼륨을 사용할 수 있는 옵션을 제공하여 Forex, 주식, 암호화폐 등 다양한 시장에 적합합니다. 초보자나 간단한 도구를 원하는 트레이더에게 완벽한 Weis Wave Sco
FREE
Volume Thermal Vision Basic
Jean Carlos Martins Roso
Volume Thermal Vision Basic은 널리 알려진 Volume Thermal Vision 지표의 간소화된 버전으로, 거래량 강도를 실용적이고 효율적으로 분석하려는 트레이더를 위해 설계되었습니다. 총 6가지 생생한 색상 수준을 제공하며, StealthMode, NightVision, FrostVision 모드를 통해 거래량 데이터를 명확하고 전략적으로 시각화할 수 있습니다. 이 인디케이터는 가볍고 직관적인 인터페이스로 초보자에게 이상적이며, 숙련된 트레이더의 분석 도구로도 매우 유용합니다. MQL5 Market에서 전체 버전으로 업그레이드하면, 고급 기능과 다양한 시각화 옵션을 통해 트레이딩 결정을 보다 효과적으로 내릴 수 있습니다. 거래 전략 최적화에 유용한 도구입니다.
FREE
WeisWaveScouter
Jean Carlos Martins Roso
WeisWaveScouter is a powerful and accurate indicator designed to help traders detect key market movements based on price and volume waves. Built for the MetaTrader 4 platform, WeisWaveScouter provides detailed analysis of bullish and bearish waves, as well as highlighting volume spikes, giving you a clear view of market conditions. Key Features: Bullish and Bearish Waves: Easily identify bullish and bearish movements with waves clearly differentiated by customizable colors. Volume Spikes: Det
Volume ThermalVision
Jean Carlos Martins Roso
Volume Thermal Vision - Advanced Volume Analysis for MetaTrader 4 Unlock the power of volume analysis with Volume Thermal Vision, a sophisticated indicator designed to enhance your trading decisions. Developed by Jean Roso, this tool provides a dynamic visualization of volume intensity through a customizable heatmap, empowering traders to identify market trends and potential reversals with precision. Key Features: Multi-Protocol Visualization: Choose from five distinct protocols—Tactical, Steal
Volume Thermal Vision
Jean Carlos Martins Roso
Volume Thermal Vision으로 볼륨의 힘을 경험하세요 트레이딩을 한 단계 업그레이드할 준비가 되셨나요? MetaTrader 5용 궁극의 볼륨 지표인 Volume Thermal Vision을 소개합니다. 볼륨 분석을 전략적 우위로 전환시켜 주는 이 지표는 높은 확률의 기회를 식별하려는 트레이더를 위해 개발되었으며, VSA(Volume Spread Analysis), ICT(Inner Circle Trader), SMC(Smart Money Concepts), Wyckoff 등 방법론에 최적화되어 EURUSD, GBPUSD, US30 등 페어의 시장 행동을 해독하는 데 도움을 줍니다. 왜 Volume Thermal Vision인가? 고급 볼륨 분석: 12단계 컬러 레벨로 볼륨 강도를 시각화하여 축적, 분배 및 기관 움직임을 명확하게 식별합니다. 독점 시각 프로토콜: Tactical, StealthMode, ThermalVision, NightVision 4가지 모드를 선택해
Result Wave Recon
Jean Carlos Martins Roso
Result Wave Recon Indicator Description Overview The Result Wave Recon indicator for MetaTrader 5 (MT5) is a sophisticated technical analysis tool designed to visualize accumulated price movements in the form of waves, combined with volume peak analysis. It offers customizable visual themes to suit various trading styles and preferences, making it a versatile addition to any trader's toolkit. The indicator plots bullish and bearish waves as histograms in a separate window, with volume peaks hig
필터:
리뷰 없음
리뷰 답변