Gartley Projections D
- 지표
-
Oleksandr Medviediev
 Let Algo Shine 🙂
저는 22년 넘게 외환 거래를 해왔으며, 특히 자동화에 중점을 두고 있습니다(2004년에 시작, 당시 MT3).
- 사랑을 제외한 모든 거래는 거래입니다.
- 인간의 타고난 성향은 수익성이 없습니다.
- "강렬한 복잡성 속에서 강렬한 단순함이 나타난다" - 윈스턴 처칠 - 버전: 3.55
- 업데이트됨: 8 12월 2025
- 활성화: 20
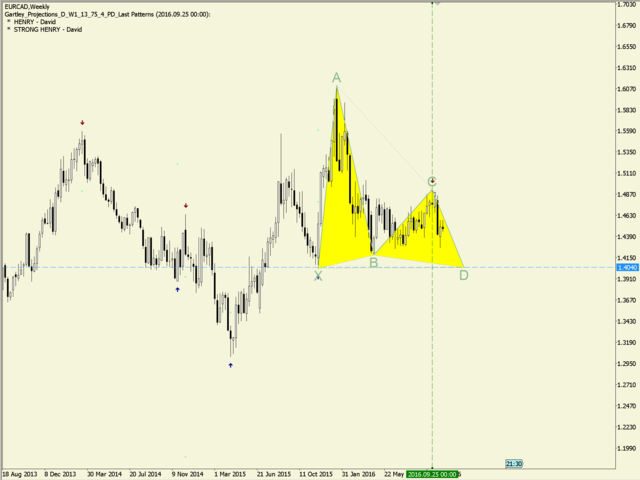
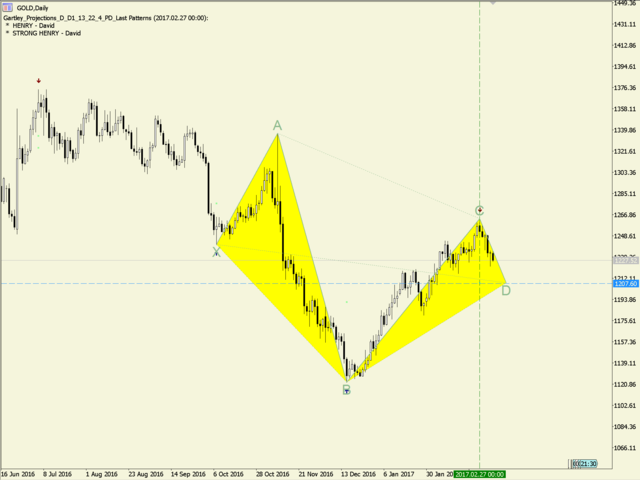
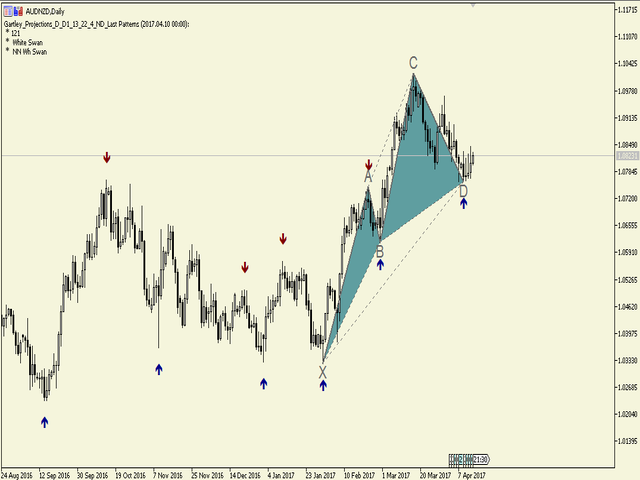
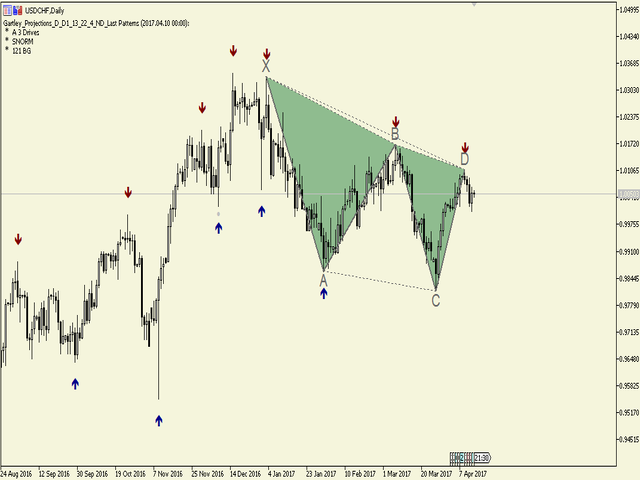
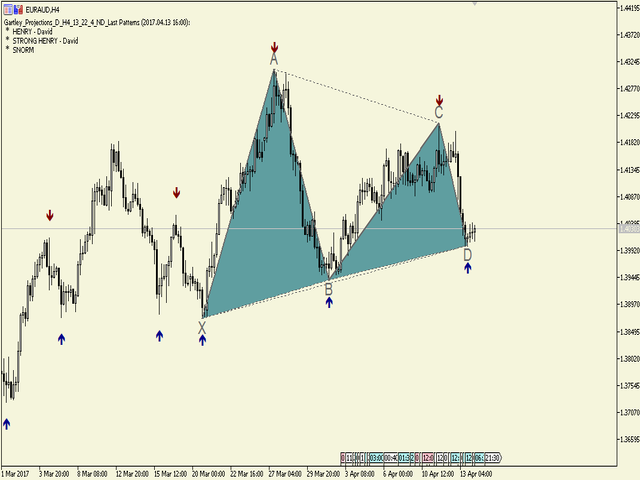
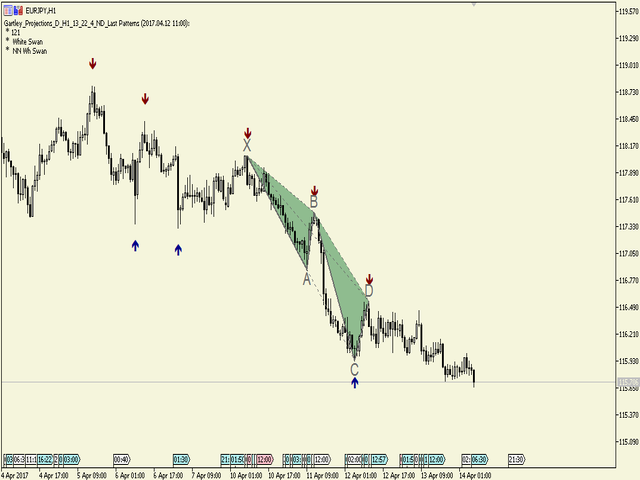
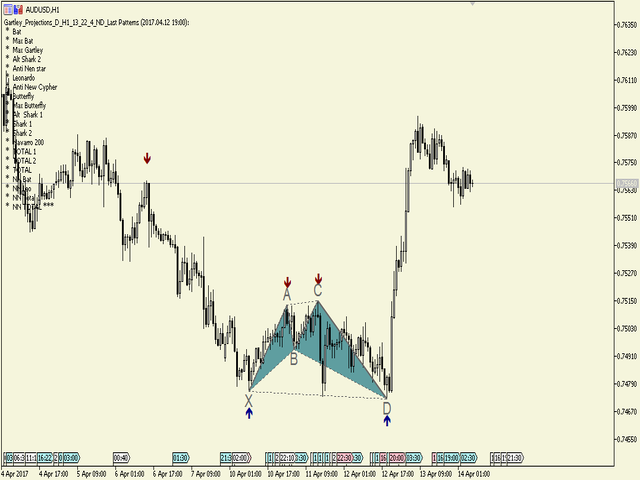
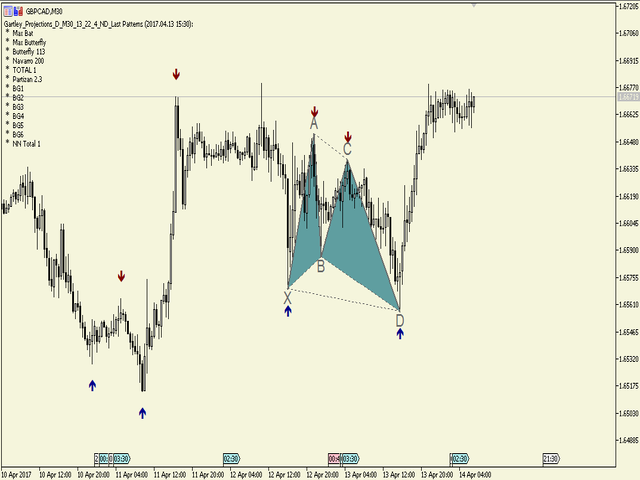
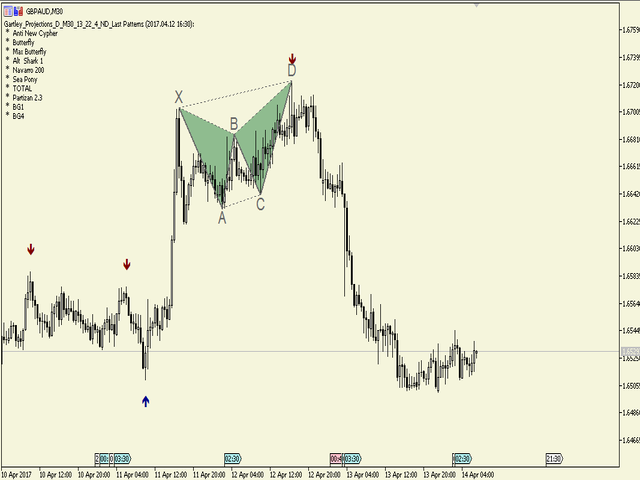
The indicator identifies the harmonic patterns (XABCD) according to developments of H.M.Gartley ("Profits in the Stock Market", 1935г).
It projects D-point as a point in the perspective projection (specify ProjectionD_Mode = true in the settings).
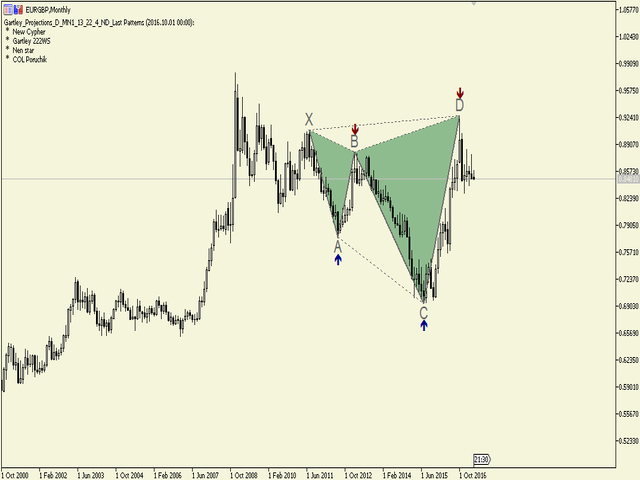
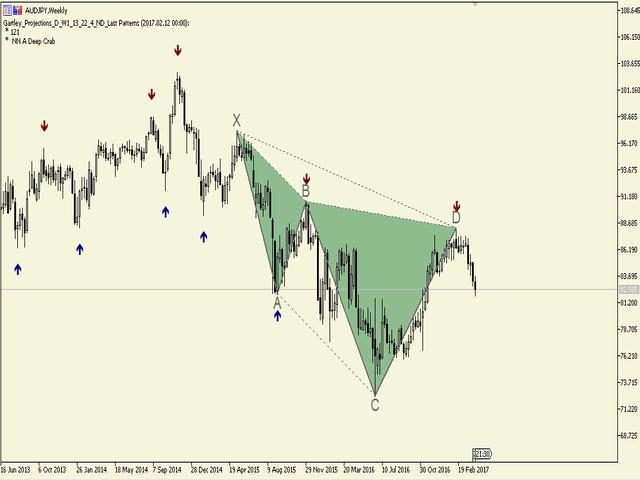
Does not redraw. When a bar of the working timeframe closes, if the identified pattern point has not moved during Patterns_Fractal_Bars bars, an arrow appears on the chart (in the direction of the expected price movement). From this moment on, the arrow permanently remains on the chart.
NOTE: 2-3 and more arrows in a row - this is changing market conditions, NOT redraw.
The total number of patterns is 85 (including Gartley-222 and Gartley-222WS, the full list is available at the link to drive.google in the Comments section). Only the latest identified pattern is filled with a solid color among all identified patterns.
Parameters
- DrawPatterns (true/false) - draw a pattern with a solid color
- ProjectionD_Mode (true/false) - mode for defining the D-point as a projection in perspective
- Patterns_Fractal_Bars - the number of the working timeframe bars, during which the latest identified pattern point must remain fixed for it to be considered a formed fractal (an arrow appears on the chart)
- Patterns_Deviation - allowed percentage deviation from the reference values of side proportions in a pattern (allowed value range)
- Patterns_XA_MinLength_Bars - the minimum allowed number of bars on the initial segment XA
- Patterns_XA_MinHeight_Points - the minimum allowed size of the initial segment XA in points
- ZigZag_Depth - parameter of the ZigZag indicator
- ZigZag_Deviation - parameter of the ZigZag indicator
- ZigZag_Backstep - parameter of the ZigZag indicator
- ShowInfo (true/false) - display the list of identified patterns at the left side of the chart
- PrintInfo (true/false) - print the information to the log
For clarity and better practical use, I prefer to split all harmonic patterns into 12 groups:
-
Golden-Ratio – classic Fibonacci symmetry
-
Moderate-Retracement – shallow B-point pullbacks
-
Deep-Retracement – deep B-point retracements
-
Extreme-Extension – stretched BD/XB extensions
-
Reciprocal-Structure – mirror-symmetric AC legs
-
Shark-Family – specific 0.752 / 1.373 AC ratios
-
Anti-Patterns – inverse-logic harmonic structures
-
Extreme-Expansion – oversized XB or XD legs
-
Special-Symmetry – BD ≈ XD proportional symmetry
-
Balanced-Complex – multi-condition blended ratios
-
BG-Series – XB=0.507, XD=1.00 proprietary set
-
Swan-Patterns – Black/White Swan extreme models


Also a verry good indicator