MetaTrader 4용 새 기술 지표 - 7

제품 제목 Smart ZigZag (MT4) – SmartView 시리즈의 일부 간단한 설명 MetaTrader 플랫폼에서 독특한 사용자 경험을 제공하는 ZigZag 지표입니다. 이전에 사용할 수 없었던 고급 기능을 제공하며, 더블 클릭으로 설정 열기, 삭제하지 않고 지표 숨기기/표시하기, 지표 창을 전체 차트 크기로 표시하기 등의 기능을 포함합니다. SmartView Indicators 시리즈의 나머지 부분과 원활하게 작동하도록 설계되었습니다. 개요 SmartView 시리즈는 혁신적인 기능을 통해 MetaTrader 플랫폼의 지표에 독특하고 독특한 사용자 경험을 제공하여 지표 관리를 더 빠르고 쉽게 만듭니다. 각 지표는 차트에 스마트 제어 패널이 장착되어 있어 필수 정보를 표시하고 모든 중요한 기능에 빠르게 액세스할 수 있습니다. 이전에 사용할 수 없었던 고유한 기능 SmartView 시리즈는 지표 작업을 더 쉽고 빠르게 만드는 고급 기능을 제공합니다: 더블 클릭으로 설정 열기:
FREE

제품 제목 Smart Parabolic SAR (MT4) – SmartView 시리즈의 일부 간단한 설명 MetaTrader 플랫폼에서 독특한 사용자 경험을 제공하는 Parabolic SAR 지표입니다. 이전에 사용할 수 없었던 고급 기능을 제공하며, 더블 클릭으로 설정 열기, 삭제하지 않고 지표 숨기기/표시하기, 지표 창을 전체 차트 크기로 표시하기 등의 기능을 포함합니다. SmartView Indicators 시리즈의 나머지 부분과 원활하게 작동하도록 설계되었습니다. 개요 SmartView 시리즈는 혁신적인 기능을 통해 MetaTrader 플랫폼의 지표에 독특하고 독특한 사용자 경험을 제공하여 지표 관리를 더 빠르고 쉽게 만듭니다. 각 지표는 차트에 스마트 제어 패널이 장착되어 있어 필수 정보를 표시하고 모든 중요한 기능에 빠르게 액세스할 수 있습니다. 이전에 사용할 수 없었던 고유한 기능 SmartView 시리즈는 지표 작업을 더 쉽고 빠르게 만드는 고급 기능을 제공합니다: 더
FREE
Squeeze Momentum Alert (스퀴즈 모멘텀 알림) 1. 가격 "폭발" 지점 식별 (The "Squeeze") 이 지표의 가장 큰 장점은 큰 움직임이 발생하기 전, 시장이 "숨 고르기" 또는 "에너지 축적"(횡보)하는 시기를 포착하는 능력입니다. 좋은 이유: 시장은 정체기와 폭발적인 변동성 시기를 반복합니다. 이 도구는 **"차트가 압축되고 있으니 다음 급등을 준비하라"**고 알려주어, 대형 추세의 시작을 놓치지 않게 합니다. 2. 추세 "강도"의 정밀한 구분 (Color Coded Momentum) 히스토그램은 4가지 색상 을 사용하여 추세의 건전성을 나타냅니다: 라임색 (Lime): 강력한 상승 (추격 매수 가능). 진녹색 (Dark Green): 상승세 약화 (주의: 이익 실현 준비). 빨간색 (Red): 강력한 하락 (강한 매도). 밤색 (Maroon): 하락세 약화 (매도세 소진). 좋은 이유: 추세가 강할 때 "진입" 타이밍과, 색이 바뀌자마자(모멘텀 상실)

제품 제목 Smart Bollinger Bands (MT4) – SmartView 시리즈의 일부 간단한 설명 MetaTrader 플랫폼에서 독특한 사용자 경험을 제공하는 Bollinger Bands 지표입니다. 이전에 사용할 수 없었던 고급 기능을 제공하며, 더블 클릭으로 설정 열기, 삭제하지 않고 지표 숨기기/표시하기, 지표 창을 전체 차트 크기로 표시하기 등의 기능을 포함합니다. SmartView Indicators 시리즈의 나머지 부분과 원활하게 작동하도록 설계되었습니다. 개요 SmartView 시리즈는 혁신적인 기능을 통해 MetaTrader 플랫폼의 지표에 독특하고 독특한 사용자 경험을 제공하여 지표 관리를 더 빠르고 쉽게 만듭니다. 각 지표는 차트에 스마트 제어 패널이 장착되어 있어 필수 정보를 표시하고 모든 중요한 기능에 빠르게 액세스할 수 있습니다. 이전에 사용할 수 없었던 고유한 기능 SmartView 시리즈는 지표 작업을 더 쉽고 빠르게 만드는 고급 기능을 제공합니
FREE
Volume Profile Pro 보조지표 이 지표는 "어떤 가격대에서 가장 많은 거래가 일어났는지" 분석하는 Volume Profile Pro 도구입니다. 다음과 같은 특별한 기능이 있습니다: 표시 모드 (Display Modes) Volume Profile (일반): 각 가격대의 총 거래량(Total Volume)을 표시하여 중요한 지지 및 저항 구간을 보여줍니다. Delta / Money Flow: 매수세와 매도세(Buy vs Sell)의 "차이(Delta)"를 표시하여 해당 가격대에서 누가 시장을 주도하는지 보여줍니다. 거래량(Volume) 또는 자금 흐름(Money Flow)으로 선택하여 볼 수 있습니다. 계산 모드 (Calculation Modes) Pro 버전의 강점은 기간 설정의 유연성입니다: Fixed Mode (고정 모드): 과거 캔들 개수를 고정하여 설정합니다 (예: 최근 100개 캔들). Dynamic Mode (핵심 기능): 수직선(Vertical Line)이
무료 상품이므로 필요에 따라 자유롭게 사용하세요!
또한 긍정적인 피드백에 진심으로 감사드립니다! 감사합니다!
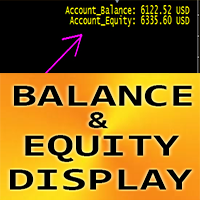
// 훌륭한 트레이딩 로봇과 지표는 여기에서 확인하실 수 있습니다: https://www.mql5.com/en/users/def1380/seller .............................................................................................................................................. MT4용 Crypto_Forex 지표 "잔액 및 자본 표시"는 훌륭한 보조 트레이딩 도구입니다.
- 이 지표는 계좌의 현재 잔액과 자본을 보여줍니다. - 차트의 어느 모서리에든 표시 값을 지정할 수 있습니다. 0 - 왼쪽 상단, 1 - 오른쪽 상단, 2 - 왼쪽 하단, 3 - 오른쪽 하단 - 색상과 글꼴 크기도 설정할 수 있습니다. MQL5 웹사이트에서만 제공되는 오리
FREE
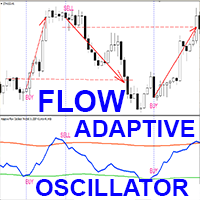
고급 맞춤형 Crypto_Forex 지표 "적응형 플로우 오실레이터" - MT4를 위한 효율적인 보조 트레이딩 도구!
- 이 지표는 차세대 오실레이터입니다. - "적응형 플로우 오실레이터"는 조정 가능한 적응형 과매도/과매수 영역을 제공합니다. - 이 지표는 가격 및 거래량 데이터를 모두 사용하여 계산합니다. - 오실레이터는 과매도/과매수 영역에서 정확한 진입 시점을 찾는 보조 도구입니다. - 적응형 과매도 영역: 녹색선 아래 - 적응형 과매수 영역: 빨간색선 위 - 이 지표는 추세 전략 및 지지/저항선과 함께 사용하기에 좋습니다. - 표준 오실레이터보다 정확도가 높습니다. - 모든 시간대에서 사용할 수 있습니다. - PC 및 모바일 알림 기능이 내장되어 있습니다.
// 훌륭한 트레이딩 로봇과 지표는 여기에서 확인하실 수 있습니다: https://www.mql5.com/en/users/def1380/seller MQL5 웹사이트에서만 제공되는 정품 제품입니다.
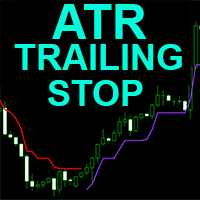
MT4용 Crypto_Forex 지표 "ATR 트레일링 스톱", 리페인트 불필요
- MT4용 ATR 트레일링 스톱 보조 지표로 트레이딩 방식을 업그레이드하세요. - 이 지표는 트레일링 스톱 활용에 최적화되어 있습니다. - ATR 트레일링 스톱은 시장 변동성에 자동으로 적응합니다. - 지연 없이 간편하게 설정할 수 있습니다. - 이 지표는 주요 추세 방향으로 가격 움직임이 진입할 때 사용하기에 매우 유용합니다. ..................................................................................................................................................... // 훌륭한 트레이딩 로봇과 지표는 다음 링크에서 확인하실 수 있습니다: https://www.mql5.com/en/users/def1380/seller 본 제품은 MQL5 웹사이트에서만 제공되는 정품 제품
제품 제목 Smart Moving Average PRO (MT4) – SmartView 시리즈 간단 설명 12가지 사용자 정의 이동평균 유형, 스마트 알림 시스템, 2색 트렌드 라인 및 차트에 통합된 SmartView 제어 패널을 갖춘 Smart Moving Average의 전문 고급 버전. 전문적인 성능과 높은 성능을 사용 편의성 및 스마트 인터페이스와 결합합니다. 개요 Smart Moving Average PRO는 무료 버전의 포괄적인 업그레이드로, 4가지 표준 유형 외에 8가지 추가 고급 이동평균 유형(HMA, KAMA, DEMA, TEMA, VWMA, RMA, McGinley, JMA)을 제공합니다. 즉시 및 종가 기반 알림을 지원하는 전문 알림 시스템, MA 기울기에 따라 자동으로 변경되는 2색 라인, 8가지 가격 소스 옵션을 갖추고 있습니다. 이 모든 것이 차트에서 빠른 관리 및 직접 값 표시를 제공하는 SmartView 패널과 결합됩니다. 주요 기능 12가지 이동평균 유
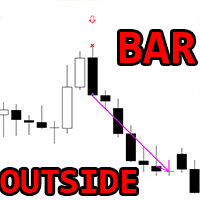
MT4용 Crypto_Forex 지표, 리페인트 및 지연 없음.
- "OUTSIDE Bar" 지표는 가격 변동 거래에 매우 강력한 지표입니다. - 이 지표는 차트에서 OUTSIDE Bar 패턴을 감지합니다. - 상승 OUTSIDE Bar - 차트에 파란색 화살표 신호(그림 참조). - 하락 OUTSIDE Bar - 차트에 빨간색 화살표 신호(그림 참조). - PC, 모바일 및 이메일 알림 기능 제공. - "OUTSIDE Bar Pattern" 지표는 지지/저항 레벨과 함께 사용하기에 매우 좋습니다.
// 훌륭한 트레이딩 로봇과 지표는 다음 링크에서 확인하실 수 있습니다. https://www.mql5.com/en/users/def1380/seller 이 제품은 MQL5 웹사이트에서만 제공되는 오리지널 제품입니다.
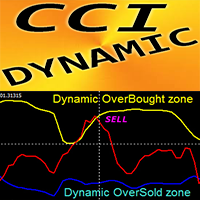
MT4용 Crypto_Forex 지표 "동적 과매수/과매수 구간을 포함하는 CCI" (재도색 불필요)
- 상품 채널 지수(CCI)는 추세 방향으로의 모멘텀 트레이딩에 매우 유용합니다. - 동적인 과매수 구간에서 매도 진입을, 동적인 과매도 구간에서 매수 진입을 주요 추세 방향으로 유도하는 데 매우 유용합니다. - 이 지표는 가격 움직임 진입과도 결합하면 매우 유용합니다. - 동적인 과매수 구간 - 노란색 선 위. - 동적인 과매도 구간 - 파란색 선 아래. - CCI 오실레이터는 현재 가격과 과거 평균 가격의 차이를 측정합니다. - PC 및 모바일 알림 기능 제공.
// 훌륭한 트레이딩 로봇과 지표는 다음 링크에서 확인하실 수 있습니다: https://www.mql5.com/en/users/def1380/seller MQL5 웹사이트에서만 제공되는 오리지널 상품입니다.
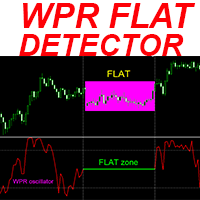
Crypto_Forex 지표 "WPR FLAT Detector"는 트레이딩에 효율적인 보조 도구입니다! 리페인트 없이도 사용 가능합니다. MT4용 이 훌륭한 지표로 트레이딩 방식을 업그레이드해 보세요.
- 이 지표는 차트에서 가격이 평평한 영역을 표시합니다. "플랫 민감도" 매개변수가 있어 플랫 감지를 담당합니다. - "WPR FLAT Detector"는 가격 움직임 진입 확인 또는 다른 지표와 함께 사용할 수 있습니다. - 추세 추종 시스템에서 플랫 영역을 감지하고 해당 영역에서의 거래를 피하는 데 사용할 수 있습니다. - 반전 스캘핑(플랫 경계에서 반전 거래)에도 사용할 수 있습니다. - 표준 WPR 오실레이터 대신 "WPR FLAT Detector"를 사용할 수 있는 기회가 많습니다. - WPR 자체는 빠른 스캘핑을 위한 최고의 오실레이터 중 하나입니다. - 과매수 영역(-20 이상)에서 매도 진입을, 과매도 영역(-80 미만)에서 매수 진입을 하는 데 유용합니다.
//
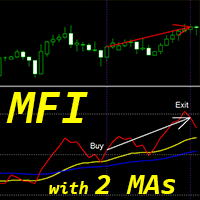
MT4용 Crypto_Forex 지표 "MFI 및 2개 이동 평균", 리페인트 없음
- 자금 흐름 지수(MFI)는 가격과 거래량 데이터를 활용하여 과매도 및 과매수 구간을 파악하는 기술적 오실레이터입니다. - "MFI 및 2개 이동 평균" 지표를 통해 MFI 오실레이터의 빠른 이동 평균과 느린 이동 평균을 확인할 수 있습니다. - 지표는 추세 변화를 매우 조기에 파악할 수 있는 기회를 제공합니다. - 매개변수를 통해 이 지표를 매우 쉽게 설정할 수 있으며, 모든 시간대에서 사용할 수 있습니다. - 그림에서 매수 및 매도 진입 조건을 확인할 수 있습니다. - 매수 신호 조건: (1) - 빠른 이동평균선이 느린 이동평균선을 상향 교차하는 경우, (2) - 빨간색 MFI 선이 빠른 이동평균선 위에 있는 경우, (3) - 빨간색 선이 노란색 이동평균선과 근접하게 교차하는 경우, (4) - 빨간색 선이 노란색 이동평균선에서 반등하는 경우, (5) - 매수 후크가 형성된 경우 - 이 지점에

**Confluence+**는 추세, 모멘텀, 거래량을 결합하여 매매 신호를 식별하도록 설계된 다중 요소 기술 지표입니다. 동적 컨플루언스 시스템을 통해 여러 기술적 조건이 동시에 충족될 때만 신호를 생성하여, 거짓 신호를 효과적으로 줄입니다. 주요 기능: 적응형 추세 감지 (동적 MA + ATR) 멀티 타임프레임 확인 (M15 ~ D1) 고급 모멘텀 필터 (RSI, 스토캐스틱, 다이버전스) 거래량 및 변동성 분석 (자동화된 비율) 실시간 컨플루언스 점수 (0–100%) 설정 가능한 파라미터: strictness, MTF, 알림 컬러 기반 정보 패널 통합 알림: 팝업, 사운드, 모바일 푸시 Confluence+는 시장 상황에 자동으로 적응하며, Forex, 지수, XAUUSD에서 자주 최적화하지 않아도 효율적으로 작동합니다. M15 데이 트레이딩, H1 스윙 트레이딩에 최적화되어 있습니다. 기술적 특징: 리페인트 없음 (신호는 캔들 마감 시 확정) CPU 사용량 <5%, 최근 캔들만
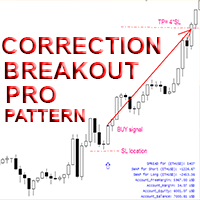
MT4용 Crypto_Forex 지표 "Correction Breakout Pro 패턴", 리페인트 및 지연 없음.
- "Correction Breakout Pro 패턴" 지표는 높은 수익 잠재력을 가진 가격 움직임 거래에 매우 강력한 지표입니다. - 이 지표는 가격 조정 후 강세 및 약세 돌파 패턴을 감지합니다. - 강세 조정 돌파 패턴 - 차트에 파란색 화살표 신호(그림 참조). - 약세 조정 돌파 패턴 - 차트에 빨간색 화살표 신호(그림 참조). - PC 및 모바일 알림 기능 제공. - "Correction Breakout Pro 패턴" 지표는 지지/저항선과 함께 사용하기 좋습니다. - 정보 표시 - 해당 통화쌍의 현재 스프레드와 스왑을 표시합니다. - 계좌 잔액, 자본금, 증거금도 표시합니다. - 정보 표시는 차트의 어느 모서리에나 배치할 수 있습니다. 0 - 왼쪽 상단, 1 - 오른쪽 상단, 2 - 왼쪽 하단, 3 - 오른쪽 하단.
// 훌륭한 트레이딩 로봇과 지표는
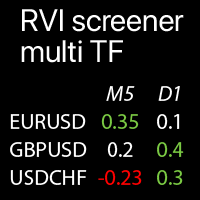
선택된 심볼에 대한 다중 시간대 RVI 값: 현재 시장 추세 비교 이 지표 는 상대 활력 지수(RVI) 값 을 모든 선택된 시간대 와 심볼 에서 단일 테이블 에 표시 하여 현재 시장 가격 추세 를 빠르게 분석 할 수 있게 합니다 . 나의 다기능 유틸리티 : 66+ 기능 | 문의하기 | MT5 버전 각 심볼 은 사용자 정의가 가능합니다: 제거하거나 교체할 수 있습니다. 최대 40개의 심볼을 추가할 수 있습니다. 패널은 차트의 어느 곳으로든 이동할 수 있습니다 (아무 곳이나 드래그).
입력 설정 에서 다음을 구성할 수 있습니다: RVI 지표 설정: MA 기간, 표시 데이터: "신호" 또는 "값". 각 시간대 를 활성화/비활성화할 수 있습니다 . 강조 옵션: 활성화된 경우 - 극단 수준이 사용자 정의 색상으로 강조 표시됩니다. 극단 수준 설정: 높은 값 및 낮
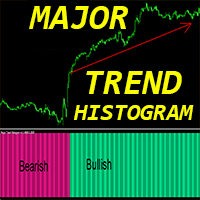
MT4용 Crypto_Forex 지표 "Major_Trend_Histogram", 리페인트 불필요
- 주요 추세 히스토그램 지표는 매우 큰 추세를 포착하도록 설계되었습니다. - 지표는 두 가지 색상으로 제공됩니다. 약세 추세는 분홍색, 강세 추세는 녹색(색상 변경 가능)입니다. - 초기 단계의 추세를 감지하여 일반적인 이동평균선(MA)보다 훨씬 효율적입니다. - 주요 추세 히스토그램은 가격 움직임, VSA, 기타 지표 등 다른 거래 방식과 결합할 수 있습니다. - 지표에는 모바일 및 PC 알림 기능이 내장되어 있습니다.
// 훌륭한 트레이딩 로봇과 지표는 다음 링크에서 확인하실 수 있습니다. https://www.mql5.com/en/users/def1380/seller MQL5 웹사이트에서만 제공되는 오리지널 제품입니다.
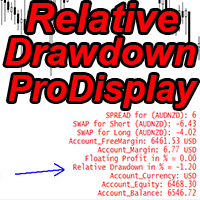
MT4용 Crypto_Forex 지표 "상대 손실률 Pro 디스플레이"는 유용한 거래 도구입니다.
그리드 트레이딩 시스템을 사용하는 트레이더라면 꼭 필요한 지표입니다!!!
- 상대 손실률 Pro 디스플레이 지표는 현재 계좌의 상대적 손실률(DD) 또는 변동 이익을 %로 표시합니다. - PC 및 모바일 알림 기능이 내장되어 있으며, 트리거 레벨을 조정할 수 있습니다. - 해당 지표가 연결된 외환 통화쌍의 현재 스프레드와 스왑을 표시합니다. - 지표는 계좌 잔액, 자본금, 증거금도 표시합니다. - 차트의 어느 모서리에나 지표 값을 표시할 수 있습니다. 0 - 왼쪽 상단, 1 - 오른쪽 상단, 2 - 왼쪽 하단, 3 - 오른쪽 하단. - 색상 및 글꼴 크기도 설정할 수 있습니다. - 상대 손실률 디스플레이를 사용하면 더 이상 계산기가 필요하지 않습니다.
// 훌륭한 트레이딩 로봇과 지표는 여기에서 확인하실 수 있습니다: https://www.mql5.com/en/users/de
Volatility Matrix – Session Volatility Analyzer Volatility Matrix analyzes current market volatility against historical sessions to detect anomalies and predict potential breakouts. The indicator compares current volatility with more than 200 historical sessions from the same hour and day of the week, calculating Z-Scores to identify when volatility deviates from typical ranges. Features Real-time Z-Score monitoring and display Historical session matching (same hour/day of week) Dynamic price zo
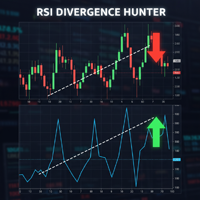
Powered by SVX Strategies Quant Team Divergences are among the most powerful signals in technical analysis, but spotting them in real-time is difficult and subjective. RSI Divergence Hunter automatically scans the market for these discrepancies between price and momentum. Eliminate Subjectivity, Automate Profit
Drawing lines manually leads to errors. If you prefer a fully automated, mathematical approach to trading, copy our official institutional algorithms: Copy "Friday Pulse" (Conservative/S
FREE

TrendScan is a visual scanner that detects bullish, bearish, or neutral trends across multiple symbols and timeframes. It analyzes market structure, EMA alignment, and price range to display clean, reliable signals. Ideal for traders seeking clarity and speed in their analysis.
Compatible with up to 25 symbols. Support for 8 timeframes. Advanced trend filters. Compact and customizable visual interface.
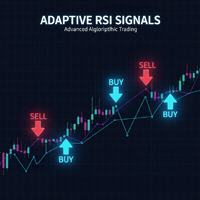
Powered by SVX Strategies Quant Team This is the full implementation of our "Self-Adaptive Trading Rules." It combines Market Structure (Dynamic Support & Resistance) with Adaptive RSI intelligence to generate high-probability buy and sell signals. Want this strategy fully automated?
Manual execution requires constant screen time. If you prefer to have our team manage the execution for you, copy our official algorithms: Copy "Friday Pulse" (Conservative/Stable) Copy "SVX AI Systems" (High Growt
FREE
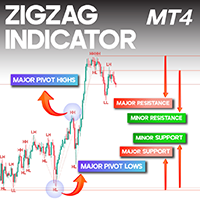
ZigZag Indicator for MetaTrader 4 The ZigZag Indicator in MetaTrader 4 is widely used for identifying significant highs and lows—known as pivot points —directly on the price chart. By marking both Major and Minor pivots, it helps traders recognize potential reversal zones and understand overall market structure. Each pivot is labeled as HH, HL, LH, or LL , making it easier to detect dominant trends as well as short-term price movements. Spotting these peaks and troughs is a vital component of te
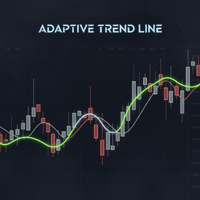
Powered by SVX Strategies Quant Team This indicator is a Smart Trend Regime Filter that changes its state based on internal market strength. Automated Trading Options:
Stop guessing the trend. Use our official algorithms for automated execution: Copy "Friday Pulse" (Conservative) Copy "SVX AI Systems" (High Growth) HOW IT WORKS
It fuses the smoothness of an EMA with the sensitivity of the RSI to filter out noise. Color Logic: Green Line: Bullish (RSI > 55). Buyers are in control. Red Line: Bea
FREE

Powered by SVX Strategies Quant Team This indicator is part of our internal toolkit for institutional volatility analysis. We are releasing it for free to support the retail trading community. Looking for Automated Results?
Manual execution is prone to human error. If you prefer consistent results managed by our team, you can copy our official algorithms directly on MQL5: Copy "Friday Pulse" (Conservative/Stable) Copy "SVX AI Systems" (High Growth) ABOUT ADAPTIVE RSI BANDS
Unlike traditional R
FREE
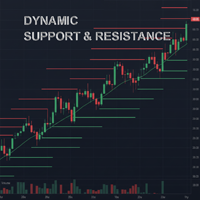
Powered by SVX Strategies Quant Team This indicator automates the identification of critical price levels based on higher timeframe market structure. It projects significant highs and lows directly onto your chart. Looking for Fully Automated Trading?
While this tool helps with manual analysis, our institutional algorithms handle execution automatically. Copy our official signals here: Copy "Friday Pulse" (Conservative/Stable) Copy "SVX AI Systems" (High Growth) HOW IT WORKS
Forget drawing lin
FREE
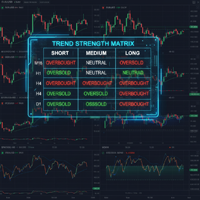
Powered by SVX Strategies Quant Team Tired of switching between charts? Trend Strength Matrix gives you an eagle-eye view of the market. This professional dashboard monitors the Adaptive RSI state across 4 key timeframes (M15, H1, H4, D1) simultaneously. Stop Monitoring, Start Automating
Watching a dashboard all day is exhausting. If you want the execution to be handled automatically by our systems, copy our official algorithms: Copy "Friday Pulse" (Conservative/Stable) Copy "SVX AI Systems" (H
FREE

OB Scanner Indicator — Overview OB Scanner is an enhanced Support & Resistance + Supply & Demand indicator designed to help traders identify where institutions and smart money are placing orders. It scans the chart for: 1. Order Blocks (Improved Demand & Supply Zones) Automatically detects Bullish Order Blocks (Demand) Automatically detects Bearish Order Blocks (Supply) Marks high-probability reversal zones Filters out weak OBs with volume and break-of-structure (BOS) confirmation 2. Buyer
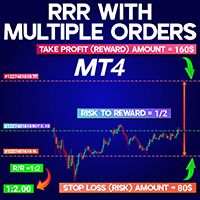
Risk to Reward Ratio Multiple Orders MT4 Risk to Reward Ratio Multiple Orders MT4 is a dedicated MetaTrader 4 indicator designed to help traders accurately monitor the relationship between stop loss (SL) and take profit (TP) levels in real time. When a trade is opened in MT4 with defined SL and TP, this tool calculates the distance between these levels relative to the entry price and displays the risk/reward ratio in the top-left corner of the chart. This feature is particularly useful for manag
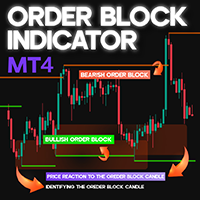
Order Block Indicator for ICT and Smart Money Trading in MT4 The Order Block Indicator is an important tool for traders using ICT (Inner Circle Trader) and Smart Money Concepts on the MetaTrader 4 (MT4) platform.
This indicator highlights key price zones where institutional orders are likely positioned, helping traders identify potential reversal points and strong reaction levels.
Bullish order blocks are displayed in green , while bearish ones appear in brown . When price enters these zones, it
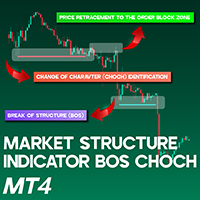
Market Structure Indicator BOS CHOCH MT4 The BOS-CHOCH Market Structure Indicator is an ICT-inspired tool developed for MetaTrader 4 (MT4). It is designed to help traders who follow ICT methodologies identify shifts in both dominant and secondary market trends. By pinpointing structural breaks and changes in market character, this indicator enhances technical analysis and supports more accurate trading decisions.
Market Structure Indicator (BOS-CHOCH) Overview Below are the general details and

MULTI INDICATOR SCANNER - PROFESSIONAL EDITION
PRODUCT DESCRIPTION
Multi Indicator Scanner is the most comprehensive technical analysis scanner on the market. It analyzes 10 different indicators simultaneously and provides you with clear BUY-SELL-NEUTRAL signals. No more checking dozens of indicators one by one!
Multi Pivot Indicator - Professional Trading Tool MULTI
PIVOT PRO INDICATOR Professional Multi Pivot Indicator for MT4 5-in-1 Pivot Indicator Professional Trading Tool for MetaTrader 4 ENGLISH TÜRKÇE Multi Pivot Indicator PRO Classic Fibonacci Camarilla Woodie DM What is Multi Pivot Indicator? Multi Pivot Indicator is a professional trading tool that displays 5 different pivot calculation methods on your MetaTrader 4 charts. Pivot points are critical support and resistance

Stop Guessing, Start Winning: Meet Swing Hunter Pro! Are you tired of confusing charts and late entries? The Swing Hunter Pro indicator is your ultimate weapon for capturing profitable market swings with unmatched clarity and confidence. This powerful tool combines the best of Hull Moving Averages (HMA) and Exponential Moving Averages (EMA) with a strict trend filter, giving you strong, high-probability signals right on your chart. Available in EA format. Link download https://www.mql5.com/en
FREE

Stop Guessing, Start Sniping: Introducing SR Sniper! Tired of entry points that seem random? The SR Sniper indicator is your new essential tool for finding high-probability trades with surgical precision. It's designed to cut through the market noise, giving you clear Buy and Sell signals right at the most critical price zones. This powerful indicator combines the dynamic analysis of the Commodity Channel Index (CCI) with automatic Support and Resistance (S/R) detection —and then filters everyt
FREE
Shows Kaufman Efficiency Ratio value and smoothed by MA. Calculation is based on movement divided by volatility on a specified period. Levels are adjustable as well as visualization. Parameters: KERPeriod - period for ratio calculation. EMAPeriod - period for moving average. Shift - indicator shift. HigherLevel - low value of the higher zone. LowerLevel - high value of the lower zone. ShowHigherZone - allow higher zone drawing. HigherZoneColor - higher zone color. ShowLowerZone - allow lower zon
FREE
Stop Guessing, Start Confirming: Introducing Signal Sentinel Are you tired of signals that leave you hanging? The Signal Sentinel indicator is your ultimate weapon against market uncertainty, designed to deliver high-probability trading setups directly to your chart. We've combined the power of two MACDs with a long-term EMA filter to ensure you only trade in the strongest, most confirmed trends. This isn't just another indicator; it's a complete confirmation system that acts as your guard agai
FREE

The Sessions Partition Indicator draws clear, accurate session separators for the Sydney, Tokyo, London, and New York trading sessions.
It automatically adapts to your broker’s server time and allows full GMT customization. Designed especially for IC Markets (Winter – GMT+2) , this indicator gives traders a clean visual structure of the market’s intraday phases – making session-based strategies MUCH easier to follow. Key Features 4 Major Forex Sessions Marked Sydney Session Tokyo Session Lon
FREE
IMPORTANT NOTE : This is a dashboard indicator and will not work on strategy tester.
Multi-Symbol Trend Scanner - Professional Market Analysis Tool Overview The Multi-Symbol Trend Scanner is a sophisticated trading dashboard that provides real-time market analysis across multiple financial instruments simultaneously. Designed for both novice and professional traders, this powerful indicator displays crucial market data in an intuitive, table-aligned format that's easy to interpret at a glan

TR-LMP Pro — Smart Auto-Mapped Liquidity Zones
TR-LMP Pro is an institutional-grade liquidity mapping indicator that automatically detects high-value liquidity levels above and below price, highlights buy-side and sell-side liquidity zones, and visualizes liquidity intensity using a clean, professional, non-retail display. Instead of manually guessing key levels, TR-LMP Pro reveals where price is most likely to target, sweep, reverse, or continue — giving traders a smarter and more objective w
Indicator Guide: Key Price Levels & Structure Shifts 1. Description The indicator is a technical analysis tool for the Meta Trader 4 platform. It is designed to automatically identify specific price movements and to highlight corresponding price zones based on preceding price action. This provides a visualization of key price areas according to the indicator's internal logic. 2. Visual Elements & Their Identification The indicator identifies and draws several types of visual elements on the char

**Product Name:** Gold Seasonality Pro (Auto Fibonacci) **Headline:** Automate the "Smart Money" Seasonal Strategy for Gold (XAUUSD). **Overview** Stop guessing where Gold will reverse. History shows that **March** and **October** are the two most powerful months for institutional trend changes. **Gold Seasonality Pro** automatically scans for these key months, analyzes the buying or selling pressure, and draws the exact Fibonacci "Sweet Spot" levels for you. It turns 45 years of statistical dat

핍스 스토커는 롱 숏 화살표 유형의 지표로, 모든 수준의 트레이더들이 더 나은 시장 결정을 내릴 수 있도록 돕습니다. 이 지표는 절대 재도색되지 않고 RSI를 주요 신호 로직으로 사용합니다. 화살표가 주어지면 절대 다시 도색되거나 다시 도색되지 않고, 화살표 지연도 없습니다.
PIPS STALKER ARROW의 특징 :
통계 패널 전체 승률 %와 연속 최대 승리 및 패배 거래 등 유용한 통계, 그리고 기타 유용한 정보를 보여주는 독특한 정보 대시보드입니다. TP와 SL, 내장된 자금 관리 이 지표는 각 화살표마다 TP와 SL 객체를 제공하므로, 거래자는 자금 및 위험 관리를 내장하고 있으며, SL은 ATR을 기반으로 하며, TP는 현재 ATR SL 가치를 기반으로 한 위험 대비 보상 비율을 기반으로 합니다. 재도색 없음, 높은 조정 가능성 이 인디케이터는 신호 품질 개선을 위한 다양한 옵션을 제공하여 어떤 쌍에서도 약간의 기간 조정만으로 작동하며, 패널은 현재 설정과 기간이 수

심볼: USDCHF, USDJPY, XAUUSD, GBPUSD, EURUSD, AUDUSD, GBPJPY ( 저는 USDCHF_H1을 좋아합니다 )
시간 프레임: H1, H4, D1
주요 특징: 리페인트 없음, 지연 없음, 방향 신호, 다중 확인
안전성: 신호에는 손절매, 이익실현이 포함되어 있으며, 위험 대비 보상 규칙을 준수함
포함: 무료 멀티 타임프레임 스캐너 (이 제품 구매 후, 개인 메시지로 스크린샷만 보내주시면 제가 직접 스캐너 파일을 보내드립니다.)
완전한 거래 시스템 개념: 기사 읽기 (전체 개념은 이 기사에서 설명됩니다) Break Out Explosion의 MT5 버전이 제공됩니다: https://www.mql5.com/en/market/product/155132 1000달러 계좌에서 진행되는 제 실제 거래를 보여주는 라이브 신호 : https://www.mql5.com/en/signals/2348010
토론에 참여하세요 MQL5 커뮤니티 채
Smart Volume Activity [SVA] is an advanced analytical indicator designed for MetaTrader platforms. It reveals how institutional (Smart Money) and retail traders operate by analyzing volume behavior across multiple timeframes . Unlike ordinary volume tools, SVA automatically adapts to any chart timeframe and highlights zones of absorption — moments when large market participants absorb liquidity from weaker hands. By detecting abnormal volume spikes far beyond typical mark
MetaTrader 4용 다중 통화 추세 분석 지표로, 여러 시간 프레임에서 추세 방향과 추세 강도를 시각화합니다. 분석 목적 전용입니다. TREND METER – 다중 통화 추세 분석 지표 (MT4) Trend Meter는 여러 시간 프레임과 심볼에서 추세 방향, 추세 강도 및 추세 정렬 상태를 시각화하도록 설계된 기술적 추세 분석 지표입니다. 본 지표는 시각적 분석 전용이며 자동으로 거래를 실행하지 않습니다. 개념 시장 추세는 시간 프레임과 거래 상품에 따라 달라질 수 있습니다.
Trend Meter는 여러 내부 추세 계산을 통합하여 간결한 시각적 형식으로 표시함으로써 시장 상황을 빠르게 평가할 수 있도록 돕습니다. 본 지표는 다음에 중점을 둡니다: 추세의 존재 여부 추세 방향 상대적인 추세 강도 여러 추세 모듈 간의 일치 여부 지표 구조 Trend Meter는 세 개의 독립적인 추세 모듈로 구성됩니다: Trend Meter 1 조기 반응형 추세 로직 단기 변화에 대한 높은

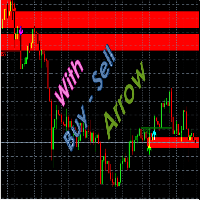
Range Explosion 소개 Range Explosion은 시장 범위를 감지하고, 정확한 지지선과 저항선을 그리며, 돌파 기회를 정확하게 식별하는 강력하고 무료인 트레이딩 도구입니다.
Break Out Explosion 프로젝트의 일부로서, 초보자와 전문가 모두에게 신뢰할 수 있는 고급 시각적 솔루션을 제공합니다. 이 제품의 MT5 버전은 여기에서 확인할 수 있습니다:
https://www.mql5.com/en/market/product/153004
추세선 돌파 개념에 관심이 있다면, 주요 추세 방향의 돌파를 감지하는 고급 도구를 확인해 보세요:
https://www.mql5.com/en/market/product/155132 이 지표의 화살표를 기반으로 거래하는 EA를 원하시나요? 아래 링크를 통해 $30 에 직접 작업을 생성하시면 제가 만들어드리겠습니다:
https://www.mql5.com/en/job/new?prefered=eeecad Break Out Explosio
FREE

상상:당신은 거대한 이익의 가장자리에 있지만,시장이 갑자기 변경 당신은 기회를 그리워. 또는 더 나쁜,당신은 손실 대신 이익을 얻을. 당신은 사전에 속삭이는 신뢰할 수있는 동맹이 있다면 어떻게:"준비-파도가오고있다!"? Harbinger 을 알아보세요–메타 트레이더 4 에 대한 혁신적인 지표,특별히 혼란의 피곤과 시장의 변화를 예상 할 상인을 위해 설계!
Harbinger 은 숨겨진 추세 변동성 패턴을 분석하여 다가오는 철수,반전 또는 축적을 놀라운 정확도로 알리는 스마트 알고리즘입니다. Harbinger mt5 version
표시기 작업 방법 Harbinger.
Harbinger 의 신호가 차트에 나타나면 신호 이전의 가격 움직임이 함께 풀백 또는 추세 반전과 함께 축적 또는 롤백 또는 축적을 위해 중지된다는 것을 의미합니다. 종종 두 가지 모두 한 번에 발생합니다. 중요한 것은 신호가 나타나면 이전 추세의 변화가 오는 것을 의미한다는 것을 이해하는 것입니다. 이 모든 것이

Dynamic FVG Detector – MetaTrader 4용 공정가치갭(FVG) 지표 Dynamic FVG Detector는 차트에서 공정가치갭(FVG)을 자동으로 감지하고 표시합니다. 세 개의 캔들 구조로 나타나는 비효율 구간을 식별하며, 가격의 되메움 상황에 따라 영역을 실시간으로 업데이트합니다. 주요 기능 상승 및 하락 FVG 자동 감지 설정 가능한 핍 기준값 최소 3캔들 구조 기반 영역 생성 시 즉시 과거 데이터 검증 되메움 동적 추적 가격 반응에 따라 영역을 지속적으로 조정 되메움 비율에 따라 영역 크기 자동 축소 완전히 메워지면 자동 제거 실시간 업데이트 두 가지 모드 제공: 표준 모드: 새로운 캔들이 형성될 때 업데이트 실시간 모드: 모든 틱에서 감지 및 업데이트, 최근 10캔들 기준 최적화 시각적 표시 녹색(상승), 빨간색(하락), 회색(완전 메움) 영역 현재 시간까지 자동 연장 투명도 및 메워진 영역 표시 옵션 지원 성능 최적화 과거 스캔 범위 설정 가능 추적

Everyone who purchases the Scalping signals M1 indicator receives a FREE BONUS — a fully automated Expert Advisor that trades based on the indicator’s signals.
The indicator shows the arrows — the robot can execute the trades for you, following all signals and risk-management rules. Scalping signals M1 – a ready-made trend-following entry system for M1 Scalping signals M1 is an indicator that turns your chart into a clear action map:
a colored trend channel shows the direction of the market, and

제품 제목 Smart Moving Averages (MT4) – SmartView 시리즈의 일부 간단한 설명 MetaTrader 플랫폼에서 독특한 사용자 경험을 제공하는 Moving Averages 지표입니다. 이전에 사용할 수 없었던 고급 기능을 제공하며, 더블 클릭으로 설정 열기, 삭제하지 않고 지표 숨기기/표시하기, 지표 창을 전체 차트 크기로 표시하기 등의 기능을 포함합니다. SmartView Indicators 시리즈의 나머지 부분과 원활하게 작동하도록 설계되었습니다. 개요 SmartView 시리즈는 혁신적인 기능을 통해 MetaTrader 플랫폼의 지표에 독특하고 독특한 사용자 경험을 제공하여 지표 관리를 더 빠르고 쉽게 만듭니다. 각 지표는 차트에 스마트 제어 패널이 장착되어 있어 필수 정보를 표시하고 모든 중요한 기능에 빠르게 액세스할 수 있습니다. 이전에 사용할 수 없었던 고유한 기능 SmartView 시리즈는 지표 작업을 더 쉽고 빠르게 만드는 고급 기능을 제공합니
FREE
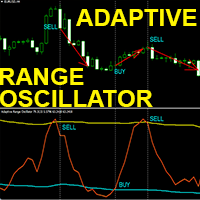
고급 맞춤형 Crypto_Forex 지표 "적응형 범위 오실레이터" - MT4를 위한 효율적인 트레이딩 도구!
- 이 지표는 차세대 오실레이터입니다. 사용 방법은 그림을 참조하세요. - "적응형 범위 오실레이터"는 조정 가능한 적응형 과매도/과매수 영역 및 기타 유용한 설정을 제공합니다. - 이 오실레이터는 동적인 과매도/과매수 영역에서 청산 시점을 정확하게 파악하는 데 적합한 도구입니다. - 과매도 영역: 파란색 선 아래 - 과매수 영역: 노란색 선 위 - 이 지표는 빠른 스캘핑 및 추세 전략에서 가격 조정의 끝을 감지하는 데 유용합니다. - 일반 오실레이터보다 훨씬 정확합니다. - 모든 시간대에서 사용할 수 있습니다. - PC 및 모바일 알림 기능이 내장되어 있습니다.
// 훌륭한 트레이딩 로봇과 지표는 여기에서 확인하실 수 있습니다: https://www.mql5.com/en/users/def1380/seller MQL5 웹사이트에서만 제공되는 정품 제품입니다.

Price Predictor 는 MetaTrader 4용으로 개발된 MQL4 기반의 고급 지표로, 가격 움직임을 보다 깊고 스마트하게 분석할 수 있도록 설계되었습니다. 트렌드 반전 가능성을 미리 포착하고 강한 추세를 높은 정확도로 따라가는 것을 목표로 합니다. 기존 지표와 달리, Price Predictor 는 시장의 변동성과 리듬에 따라 내부 매개변수를 자동으로 조정하는 적응형 로직을 사용합니다. 이를 통해 변동성 구간이나 횡보장에서도 일관된 민감도를 유지하며 노이즈와 허위 신호를 줄입니다. 또한 가격이 소진될 가능성이 높은 구간을 식별하는 능력이 뛰어나, 통계적으로 반전 가능성이 높은 지점을 포착할 수 있습니다. 모멘텀 분석, 반복 패턴, 동적 변동성 추정을 결합한 다층 필터링 알고리즘이 안정적인 신호를 제공합니다. 트레이더는 자신의 스타일에 맞게 파라미터를 자유롭게 조정할 수 있으며, 모든 변경 사항은 차트에 즉시 반영됩니다. 단순하고 직관적인 인터페이스로 주요 구간을 명확히
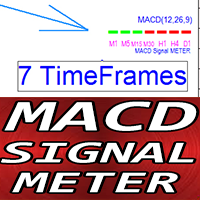
MT4용 Crypto_Forex 지표 MACD 시그널 미터.
- 매우 유용한 MACD 시그널 미터 지표는 7개 시간대의 현재 MACD 값(시그널 라인 위/아래)을 동시에 보여줍니다. - 녹색 사각형 - MACD가 시그널 라인 위에 있습니다. - 빨간색 사각형 - MACD가 시그널 라인 아래에 있습니다. - 외환 지표 MACD 시그널 미터는 다중 시간대 거래 시스템의 거래 진입 필터로 사용할 수 있습니다. ..................................................................................................................................................... // 훌륭한 트레이딩 로봇과 지표는 다음 링크에서 확인하실 수 있습니다: https://www.mql5.com/en/users/def1380/seller 이 제품은 MQL5 웹사이트에서만 제공되는 정품 제품입니다
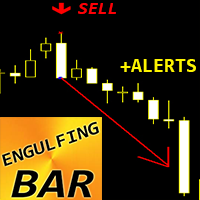
Crypto_Forex 지표 ENGULFING 막대 패턴(MT4용), 재도색 및 지연 없음.
- "ENGULFING 막대" 지표는 가격 움직임 거래에 매우 강력한 지표입니다. - 이 지표는 차트에서 Engulfing 막대 패턴을 감지합니다. - 상승 Engulfing 막대 - 차트에 파란색 화살표 신호(그림 참조). - 하락 Engulfing 막대 - 차트에 빨간색 화살표 신호(그림 참조). - PC, 모바일 및 이메일 알림 기능 제공. - "ENGULFING 막대 패턴" 지표는 지지/저항 레벨과 결합하기 매우 좋습니다.
// 훌륭한 트레이딩 로봇과 지표는 다음 링크에서 확인하실 수 있습니다: https://www.mql5.com/en/users/def1380/seller MQL5 웹사이트에서만 제공되는 오리지널 상품입니다.
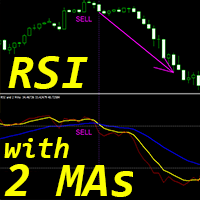
MT4용 Crypto_Forex 지표 "RSI 및 2개 이동평균선", 리페인트 없음
- 이 지표는 모멘텀 트레이딩 시스템에 매우 적합합니다. - "RSI 및 2개 이동평균선" 지표를 사용하면 RSI 자체의 빠른 이동평균선과 느린 이동평균선을 확인할 수 있습니다. - 지표는 추세 변화를 매우 조기에 파악할 수 있는 기회를 제공합니다. - "RSI 및 2개 이동평균선"은 과매수/과매도 구간에서 추세 방향으로 모멘텀을 포착하는 데 사용할 수 있습니다. - 매개변수를 통해 이 지표를 매우 쉽게 설정할 수 있습니다. - 모든 시간대에서 사용할 수 있습니다.
// 훌륭한 트레이딩 로봇과 지표는 다음 링크에서 확인할 수 있습니다: https://www.mql5.com/en/users/def1380/seller MQL5 웹사이트에서만 제공되는 오리지널 제품입니다.
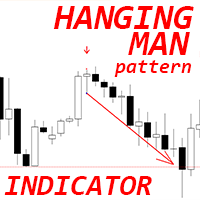
MT4용 Crypto_Forex 지표 "행잉 맨 패턴", 리페인트 없음, 지연 없음.
- "행잉 맨 패턴" 지표는 가격 변동 거래에 매우 강력한 지표입니다. - 이 지표는 차트에서 하락세 행잉 맨 패턴을 감지합니다. 차트에 빨간색 화살표 신호가 나타납니다(그림 참조). - PC, 모바일 및 이메일 알림 기능을 제공합니다. - "행잉 맨 패턴" 지표는 지지/저항선과 함께 사용하기에 매우 좋습니다. ..................................................................................................................................................... // 훌륭한 트레이딩 로봇과 지표는 다음 링크에서 확인하실 수 있습니다: https://www.mql5.com/en/users/def1380/seller 본 제품은 MQL5 웹사이트에서만 제공되는 오리지널 상품입니다.

MFCS (다중 요인 채널 점수) 는 가중 점수 시스템과 변동성 기반 적응형 채널을 통해 시장의 역학을 명확하게 파악하도록 설계된 고급 지표입니다. 주요 특징: 실시간 변동성에 따라 조정되는 적응형 ATR 채널 다중 요인 점수(포지션, 거래량, 모멘텀, 상위 시간 프레임 추세, 변동성) 점수 강도(0–100)에 따라 분류된 신호 점수, 추세, 주요 지표를 보여주는 종합 대시보드 시장 방향 정렬을 위한 다중 시간대 필터링 신뢰성을 높이기 위한 선택적 거래량 검증 주요 매개변수: 조정 가능한 ATR 기간, 배수, 윈도우 구성 가능한 점수 가중치 이동 평균을 통한 거래량 필터링 통합 알림이 포함된 사용자 지정 대시보드 사용 방법:
시장 구조를 정량적으로 평가하려는 트레이더와 기술 분석가를 위해 설계되었습니다.
높은 잠재력 구역 식별, 움직임 강도 측정 및 진입 타이밍 최적화에 도움을 줍니다.
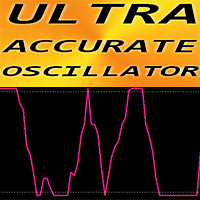
MT4용 초정밀 오실레이터
UA 오실레이터 - EMA와 같은 추세 지표와 함께 사용할 경우 약 80%의 정확도를 제공하는 고급 맞춤형 Crypto_Forex 지표입니다.
- 새로운 고급 계산 방식을 사용합니다. UA 오실레이터는 표준 MT4 오실레이터보다 훨씬 빠르고 정확합니다. - 차세대 오실레이터 - EMA10과 함께 사용하는 방법을 보여주는 그림을 참조하세요. - 과매도: 0.03 미만 // 과매수: 0.97 이상 - 이 지표를 사용하면 표준 전략도 업그레이드할 수 있는 기회가 많습니다. - 지표 설정은 매우 간단합니다. 주요 매개변수: 민감도 - 권장 값 범위: 0.4~0.8 - 모바일 및 PC 알림 기능 내장
// 훌륭한 트레이딩 로봇과 지표는 여기에서 확인하실 수 있습니다: https://www.mql5.com/en/users/def1380/seller 본 제품은 MQL5 웹사이트에서만 제공되는 정품입니다.
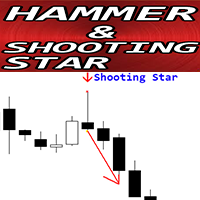
MT4용 Crypto_Forex 지표 "망치형 및 유성 패턴", 리페인트 및 지연 없음.
- "망치형 및 유성 패턴" 지표는 가격 변동 거래에 매우 강력한 지표입니다. - 이 지표는 차트에서 강세 망치형 및 약세 유성 패턴을 감지합니다. - 강세 망치형 - 차트에 파란색 화살표 신호(그림 참조). - 약세 유성형 - 차트에 빨간색 화살표 신호(그림 참조). - PC, 모바일 및 이메일 알림 기능 제공. - "망치형 및 유성 패턴" 지표는 지지/저항선과 결합하기 매우 좋습니다.
// 훌륭한 트레이딩 로봇과 지표는 다음 링크에서 확인하실 수 있습니다. https://www.mql5.com/en/users/def1380/seller 이 제품은 MQL5 웹사이트에서만 제공되는 오리지널 상품입니다.
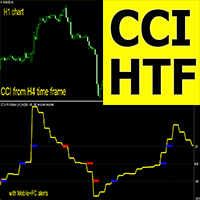
MT4용 Crypto_Forex 지표 CCI HTF 오실레이터
- MT4용 전문가용 CCI HTF 오실레이터로 거래 방식을 업그레이드하세요. HTF는 상위 시간대를 의미합니다. - 상품 채널 지수(CCI)는 현재 가격과 과거 평균 가격의 차이를 측정합니다. - 주요 레벨: +/-200, +/-100. - +200 구간 이상에서는 매도 진입, -200 구간 이하에서는 매수 진입에 유리합니다. - 이 지표는 가격 변동 구간을 이용하는 다중 시간대 거래 시스템이나 다른 지표와 함께 사용하는 데 매우 유용합니다. - CCI HTF 오실레이터 지표를 사용하면 상위 시간대의 CCI를 현재 차트에 추가할 수 있습니다. - 모바일 및 PC 알림 기능이 내장되어 있습니다.
// 훌륭한 트레이딩 로봇과 지표는 여기에서 확인하실 수 있습니다: https://www.mql5.com/en/users/def1380/seller 본 제품은 MQL5 웹사이트에서만 제공되는 정품입니다.
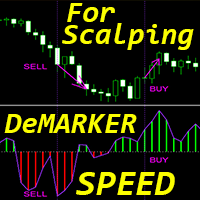
MT4용 Crypto_Forex 지표 "DeMarker Speed", 리페인트 없음.
- 이 지표는 물리학 방정식을 기반으로 계산됩니다. DeMarker Speed는 DeMarker 자체의 1차 미분값입니다. - DeMarker 오실레이터 곡선은 지표 계산 기간 동안 이전 고가 및 저가 대비 현재 가격 위치를 나타냅니다. - DeMarker Speed 지표는 빠른 스캘핑 진입에 적합합니다(그림 참조). - DeMarker Speed는 DeMarker 자체의 방향 전환 속도를 보여주며, 매우 민감합니다. - DeMarker Speed 지표의 값이 0보다 작으면 속도는 음수이고, 0보다 크면 속도는 양수입니다. - 지표에는 모바일 및 PC 알림 기능이 내장되어 있습니다.
// 훌륭한 트레이딩 로봇과 지표는 다음 링크에서 확인하실 수 있습니다: https://www.mql5.com/en/users/def1380/seller MQL5 웹사이트에서만 제공되는 오리지널 제품입니다.
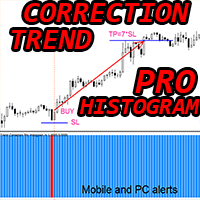
MT4용 Crypto_Forex 지표 "Trend Correction Pro 히스토그램", 리페인트 불필요!
- Trend Correction Pro 히스토그램은 두 가지 색상으로 제공됩니다. 빨간색은 하락 추세, 파란색은 상승 추세를 나타냅니다. - 동일한 색상의 히스토그램 열이 7개 연속 표시되면 새로운 추세의 시작을 의미합니다. - Trend Correction Pro 히스토그램 지표는 손실을 최소화하고 수익을 극대화하는 것을 주요 목표로 설계되었습니다. - 지표의 민감도를 결정하는 "기간" 매개변수를 가지고 있습니다. - 모바일 및 PC 알림 기능이 내장되어 있습니다. - 지표에 정보 표시 기능이 있어, 지표가 연결된 외환 통화쌍의 현재 스프레드와 스왑을 보여줍니다. - 계좌 잔액, 자본금, 증거금도 표시됩니다. - 차트의 어느 곳에서나 정보 스프레드 스왑 표시를 찾을 수 있습니다. - Trend Correction Pro 히스토그램은 간단하지만 수익성 있는 거래 시스템으

이런 경험, 없으신가요? 화살표 신호가 떠서 진입했는데, 곧바로 반대 방향으로 가서 손절... '곧 오를 것 같다'는 근거 없는 감으로 진입했다가 손실을 떠안게 되는 경우 (포지션 중독) 추세가 나온 것은 알겠는데, 어디서 들어가야 할지 몰라 절호의 기회를 손가락만 빨며 지켜보기만 할 때... 고점 매수, 저점 매도를 반복하며 자금이 조금씩 줄어들 때... 만약, 당신이 하나라도 해당된다면, 그것은 당신의 탓이 아닙니다.
시장의 **'진짜 힘'과 순식간에 사라지는 '노이즈(속임수)'**를 구별하는 '잣대'가 없었을 뿐입니다. 만약, 차트 위에 **'시장 에너지 그 자체'**를 수치화하여, 추세의 시작부터 최고점까지 누구나 명확하게 볼 수 있는 나침반이 있다면...? 당신의 트레이딩이 극적으로 바뀔 것이라고 생각하지 않으십니까? 그 해답이, 바로 여기에 있습니다. **【Hirozo Momentum Analysis】**는 기존의 시그널 툴과는 차별화된, 완전히 새로운 발상에서 태어난
윌리엄스 프랙탈 후행 정지 적응 후행 정지 메커니즘 빌 윌리엄스 프랙탈 분석의 원리를 결합한 전문 거래 도구입니다. 이 표시기는 거래 진입 및 시장 위험 최소화를위한 순간의 정확한 정의를 제공합니다.
이 시스템은 차트에서 프랙탈 구조를 자동으로 식별하고 정지 순서를 이동하기위한 최적의 레벨을 계산합니다. 이를 통해 이익을 보호하고 손실을 제한 할 수 있습니다.
이 표시기는 시장 역학을 지속적으로 분석하고 가격 구조의 변화에 따라 정지 손실 수준을 조정합니다. 당신은 전문적인 위험 관리 도구를 얻을 실시간으로 무역에 입력합니다.
프랙탈의 복잡한 수학적 계산은 이해할 수있는 그래픽 신호로 변형되었습니다. 이 이론에 대한 심층적 인 연구는 필요하지 않습니다.이 시스템은 자본 보호 및 거래 진입을위한 기성품 솔루션을 제공합니다.
이 표시기는 주요 프랙탈 레벨을 식별하고 동적 정지 순서를 설정하는 벤치마크로 사용합니다. 새로운 극단에 도달하면 시스템이 자동으로 정지 레벨을
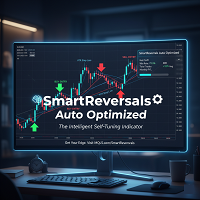
SmartReversals Auto Optimized: The Intelligent Indicator That Adapts to Your Chart Tired of indicators with fixed settings that only work in one market? Frustrated by endless manual optimization with no results? Introducing SmartReversals Auto Optimized – the first indicator that automatically optimizes itself for your chart. The real magic is its built-in Auto-Optimization Engine . Revolutionary Feature: Smart Auto-Optimization No more manual backtesting or guessing parameters! Whe

BBRSI Quantum (Free Edition) BBRSI Quantum is a powerful, 100% Non-Repainting indicator for MetaTrader 4 that generates clear Buy and Sell arrows based on an advanced momentum strategy. This tool is designed for traders who want to identify precise entry points during overbought or oversold conditions. This is the fully functional FREE edition. The Core Strategy: Bollinger Bands on RSI Unlike standard indicators, BBRSI Quantum does not apply Bollinger Bands to the price. Instead, it applies th
FREE
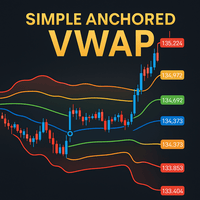
Simple Anchored VWAP is a lightweight yet powerful tool designed for traders who want precise volume-weighted levels without complexity.
This indicator lets you anchor VWAP from any point on the chart and instantly see how price reacts around institutional volume zones. MT5 Version - https://www.mql5.com/en/market/product/155321/
Join To Learn Market Depth - https://www.mql5.com/en/channels/suvashishfx Using VWAP bands and dynamic levels, the tool helps you understand where real buying and s
FREE

Acceleration Bias — Price Acceleration Impulse Indicator Acceleration Bias is a modern analytical tool designed to measure changes in price acceleration and visualize impulse asymmetry using a robust mathematical model.
This indicator is intended for traders working with market volatility, impulse phases, and price-movement structure, as well as those who need algorithmic, rule-based analytical support. Purpose and Core Concept Unlike traditional oscillators that analyze only velocity changes
Target Level MT4 — a smart target-price indicator with an adaptive model based on five algorithms. Target Level MT4 — not just a price forecast: it analyzes the market in real time through five independent algorithms, selects the best one, and builds a reliable target price with visual signals on the chart. Indicator demo video: https://youtu.be/4P1GM-1PTd8?si=SeQVsoByiump6kGP Updates The statistics now include the influence of SL: formulas are evaluated not only by reaching the Target, but also
트레이딩 전략과 기술 지표를 판매하기에 가장 좋은 장소가 왜 MetaTrader 마켓인지 알고 계십니까? 광고나 소프트웨어 보호가 필요 없고, 지불 문제도 없습니다. 모든 것이 MetaTrader 마켓에서 제공됩니다.
트레이딩 기회를 놓치고 있어요:
- 무료 트레이딩 앱
- 복사용 8,000 이상의 시그널
- 금융 시장 개척을 위한 경제 뉴스
등록
로그인
계정이 없으시면, 가입하십시오
MQL5.com 웹사이트에 로그인을 하기 위해 쿠키를 허용하십시오.
브라우저에서 필요한 설정을 활성화하시지 않으면, 로그인할 수 없습니다.