PanBandsRegime for Market Regime Switching

  • 지표
  • Heping Pan
    Heping Pan
    I am a trading system developer for Meta Trader platform. In my last 30 years of professional life, I was a Professor of Intelligent Finance and a Senior Researcher and Developer of Quantitative Trading at a few universities and research institutes in Australia, China and Canada. Practically I
  • 버전: 1.0
  • 활성화: 5
PanBandsRegime for Market Regime Switching

Author Heping Pan
Swingtum Prediction Pty Ltd, Australia
panhepingism@gmail.com02/01/2026


Description

    Move beyond conventional indicators. PanBandsRegime.ex4 is a new innovative indicator for market regime switching. It is designed based the theory and design of Pan Bands of Asymmetric Volatility. The primary indicator for Pan Bands is provided separately as PanBands.ex4. Each of the two indicators PanBands.ex4 and PanBandsRegime.ex4 is self-contained, standalone. Together, they form the suite of Pan Bands indicators. For more details of PanBands.ex4, please visit https://www.mql5.com/en/market/product/160068 


    The Pan Bands of Asymmetric Volatility suite is not merely another technical tool—it is a trading application built upon a peer-reviewed, academically published financial research model [Heping Pan, (2012), "Yin-yang volatility in scale space of price-time: a core structure of financial market risk", China Finance Review International, Vol. 2 Iss: 4 pp. 377 – 405]. This foundation sets it apart, translating rigorous quantitative finance theory into practical market utility.

    Traditional volatility measures, like Bollinger Bands®, are limited by their reliance on symmetric standard deviation. They fail to capture the fundamental asymmetry between upward and downward price movements, generate false signals at reversals, and exhibit inherent lag.

    Our published research directly addresses these flaws by introducing a formalized Asymmetric Volatility (Yin-Yang Volatility) model. This indicator suite is the practical implementation of that model, offering traders a significant edge through a more accurate, responsive, and nuanced view of market dynamics.

    Leveraging the Pan Bands output, the PanBandsRegime.ex4 indicator  applies a logical layer to generate essential market regime switching signals. It algorithmically identifies:

    • The initiation and maturation of trending regimes.
    •  Early-stage deterioration and potential reversal points.

    This provides a systematic, research-validated framework for contextualizing price action—a critical component for robust manual trading or automated strategy development.

    Key Advantages of PanBandsRegime Indicator:

    • Academically Validated: Based on a formal, peer-reviewed volatility model, not just heuristic modification.
    • Asymmetry-Aware: Explicitly models the distinct nature of upward (Yang) and downward (Yin) volatility.
    • Reduced Noise & Lag: Minimizes false expansions and improves responsiveness at critical market turns.
    • Structured Toolkit: Progresses from core analysis to precise trade management and regime classification.

    For the sophisticated trader seeking tools with substantive intellectual underpinnings, PanBandsRegime represents a unique convergence of academic finance and practical trading technology. Implement a published research model directly on your charts.


    Techincal Details:

    Indicator PanBandsRegime determines the current market regime on the given time frame such as H1. Four types of market regime are distinguished: Up trend starts and keeps strong; Up trend is weakening and about to end; Down trend starts and keeps strong; Down trend is weakening and about to end. PanSwingtumRegime calculate sophisticated crossings of two PanBands with two different periods - a slow versus a fast one. The input parameters are

    // Slow Pan Bands of YinYang Volatility

    • extern int    BandsPeriod1=96;     
    • extern int    BandsShift1=0;
    • extern double BandsDeviations1=2.0;
    • extern int    MAMethod1=MODE_LWMA;
    • extern int    PriceComp1=PRICE_CLOSE;
    • extern double SLRatio = 0.25; // StopLoss levels are not used here  

    // Fast Pan Bands of YinYang Volatility

    • extern int    BandsPeriod2=48;
    • extern int    BandsShift2=0;
    • extern double BandsDeviations2=2.0;
    • extern int    MAMethod2=MODE_LWMA;
    • extern int    PriceComp2=PRICE_CLOSE;
    • extern double SLRatio = 025;  // StopLoss levels are not used here  

    BandsPeriod1 and BandsPeriod2 are two key parameters that you may like to change value, while other parameters can be left untouched.

    The output are two tradable signals:

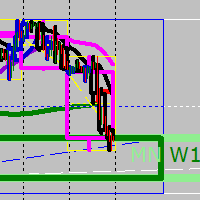
    In the Screenshot,switch of market regime is shown with red and green vertical lines (only for illustration purpose, not the output of the indicator). The first red vertical line (the left) signals the market regime switches from up trend to down trend. The second red vertical line signals the weakening of down trend. Vice versa are the green vertical lines for signaling the new up trend.

    How to use PanBandsRegime as a regime switching indicator in real trading:

    Let Regime be the value of PanBandsRegime indicator:

    If Regime == +100 (display in Green and full vertical), then the up trend has started and is still strong, one may initiate one or more long trades;

    If Regime == +25 (display in Green but with short vertical), then the up trend starts weakening and may be approach to end, one may still enter long trades, one should use tight takeprofit and stoploss; or one could simply not enter more long trades, but focuses on exiting the existing long trades.

    If Regime == -100 (display in Red and full vertical), then the down trend has started and is still strong, one may initiate one or more short trades;

    If Regime == -25 (display in Red and short vertical), then the down trend starts weakening and may be approach to end, one may still enter short trades, but one should use tight takeprofit and stoploss; or one could simply not enter more short trades, but focuses on exiting the existing short trades.


    Of course, how to use this indicator in real trading is subject to the actual trading strategies and experience of the human trader or the automated EA.


    ---------------------------------------------------------------------------------------------------------------------------------------

    Disclaimer for All the Trading Software of Swingtum Prediction Pty Ltd Australia


    IMPORTANT NOTICE – PLEASE READ CAREFULLY

    BY PURCHASING, DOWNLOADING, INSTALLING, OR USING THIS SOFTWARE (THE "SOFTWARE"), YOU (THE "USER") EXPLICITLY ACKNOWLEDGE, UNDERSTAND, AND UNCONDITIONALLY AGREE TO THE FOLLOWING TERMS. IF YOU DO NOT AGREE, YOU MUST IMMEDIATELY CEASE ALL USE OF THE SOFTWARE. NOTE THAT ALL SALEES ARE FINAL, NO REFUNDS WILL BE PROVIDED.

    1. No Financial Advice & High Risk Warning

    The Software is a technical tool for analysis and/or automated trading on the MetaTrader 4 (MT4) platform. It is provided for informational and educational purposes only. The Software and any accompanying materials DO NOT constitute financial advice, investment advice, trading advice, or any other type of advice. All trading decisions you make are your own sole responsibility. Trading foreign exchange (Forex), contracts for difference (CFDs), and other leveraged products carries a very high level of risk and may not be suitable for all investors. You can sustain losses that exceed your initial deposit. You should be aware of all risks associated with trading and seek independent advice from a qualified financial advisor if necessary.

    2. No Guarantee of Performance or Profit

    The developer, vendor, and all associated parties ("We," "Us," "Our") make no representations, warranties, or guarantees of any kind, express or implied, regarding the Software's performance, future profitability, or reliability. Past performance, whether simulated or real, is not indicative of future results. The User acknowledges that trading can result in the complete loss of their invested capital. We do not guarantee that the use of the Software will result in profits or will not result in losses.

    3. User Assumes All Risk and Responsibility

    The User accepts full, complete, and sole responsibility for any and all trades placed using the Software, including all losses, damages, and costs incurred. The User is solely responsible for understanding the functionality of the Software, configuring its settings (including stops, limits, lot sizes, and risk parameters), and monitoring its operation. The User agrees that they use the Software at their own risk.

    4. Software "As Is"

    The Software is provided on an "AS IS" and "AS AVAILABLE" basis without any warranty of any kind. We disclaim all warranties, including but not limited to, implied warranties of merchantability, fitness for a particular purpose, and non-infringement. We do not warrant that the Software will be error-free, uninterrupted, or compatible with all market conditions, brokers, or User hardware/software configurations.

    5. Limitation of Liability

    To the maximum extent permitted by applicable law, in no event shall We be liable for any direct, indirect, incidental, special, consequential, or punitive damages, or any loss of profits, revenue, data, or use, incurred by the User or any third party, arising from or related to the use or inability to use the Software, even if we have been advised of the possibility of such damages. Our total cumulative liability shall in no event exceed the purchase price paid by the User for the Software.

    6. User's Representations

    The User represents and warrants that they:

    l Are of legal age in their jurisdiction to enter into this agreement.

    l Have sufficient trading knowledge and experience to understand the risks involved.

    l Have tested the Software on a demo account and understand its operation before any live use.

    l Will use the Software in compliance with all applicable laws and regulations in their jurisdiction.

    l Are solely responsible for ensuring their use of the Software complies with their broker's terms of service.

    7. Third-Party Platforms & Market Risks

    The Software operates on the MT4 platform and interacts with brokers' servers. We are not responsible for connectivity issues, execution delays, platform errors, broker insolvency, or any other issues originating from third-party platforms, brokers, or internet services. The User acknowledges the inherent risks of electronic trading, including slippage, requotes, and market gaps.

    ACKNOWLEDGEMENT

    BY USING THE SOFTWARE, YOU CONFIRM THAT YOU HAVE READ, UNDERSTOOD, AND IRREVOCABLY AGREE TO THIS DISCLAIMER. YOU ACKNOWLEDGE THAT YOU ARE THE SOLELY RESPONSIBLE PARTY FOR THE OUTCOMES OF YOUR TRADING ACTIVITIES.


    Mr Heping Pan, the Author

    Swingtum Prediction Pty Ltd, Australia

    panhepingism@gmail.com

    28 December 2025


    추천 제품
    TradeHistoryMapper EA
    Dora Nafwa Mwabini
    TradeHistoryMapper로 트레이딩 우위를 시각화하세요 모든 성공적인 트레이더는 자신의 트레이딩 기록이 미래 수익의 열쇠라는 것을 알고 있습니다. TradeHistoryMapper는 계좌 기록을 강력한 시각적 지도로 만들어 수익과 손실, 그리고 개선 방법을 정확하게 보여줍니다. 모든 거래를 차트에서 직접 확인할 수 있는데, 끝없는 계좌 기록 탭을 헤매실 필요가 있을까요? 1. 명확한 색상 코드로 수익과 손실 거래를 즉시 표시합니다. 2. 여러 종목과 시간대에 걸친 성과를 분석합니다. 3. 청산된 거래와 현재 진행 중인 거래를 모두 추적하여 완벽한 통찰력을 제공합니다. 4. 진입 및 청산 패턴을 한눈에 파악합니다. 5. 간단한 설정 - 기록 첨부, 실행, 그리고 실시간으로 기록 확인 자신의 투자 습관을 이해하려는 초보자든, 심층 분석을 원하는 고급 트레이더든 TradeHistoryMapper는 무엇이 효과적이고 무엇이 효과적이지 않은지 파악하여 자신 있게 전략을 개선
    EA123 Snipper MACD
    Jose Francisco Flores Rojas
    MACD Divergence Pro is an intelligent and adaptive Forex trading robot designed to capitalize on MACD signals and detect divergence patterns that often precede major price reversals. The EA automatically places Buy and Sell trades when: Bearish divergence is detected at market highs Bullish divergence is detected at market lows MACD crossover signals confirm potential entry points Key Features: Fully automated trading using MACD and divergence logic ️ Customizable MACD settings for f
    Szia! Egy indikátorral. Több idő gyertyájának kirajzoltatása egy charton. Különböző színek rendelhetők a long és short gyertyákhoz. Vonal vastagsága állítható. A gyertya kitöltése engedélyezhető. Hello! With an indicator. Drawing multiple time candles on a chart. Different colors can be ordered for long and short candles. Line thickness can be adjusted. Filling the candle can be allowed. Videó: https://www.youtube.com/watch?v=-9bequnAw-g&amp ;ab_channel=GyulaKlein
    Auto Fibo Pro m
    DMITRII GRIDASOV
    "Auto FIBO Pro" Crypto_Forex 지표 - 거래에 유용한 보조 도구입니다! - 지표는 자동으로 Fibo 수준과 로컬 추세선(빨간색)을 계산하여 차트에 배치합니다. - Fibonacci 수준은 가격이 반전될 수 있는 주요 영역을 나타냅니다. - 가장 중요한 수준은 23.6%, 38.2%, 50%, 61.8%입니다. - 역전 스캘핑이나 존 그리드 거래에 사용할 수 있습니다. - Auto FIBO Pro 지표를 사용하여 현재 시스템을 개선할 수 있는 기회도 많습니다. - Info Spread Swap Display가 있습니다. 현재 Spread와 Swap이 부착된 외환 쌍을 표시합니다. - 디스플레이에는 계정 잔액, 자본 및 마진도 표시됩니다. - 차트의 어느 모서리에서나 Info Spread Swap Display를 찾을 수 있습니다. 0 - 왼쪽 상단 모서리, 1 - 오른쪽 상단, 2 - 왼쪽 하단, 3 - 오른쪽 하단. 여기를 클릭하여 고품질 트레이딩 로봇과
    REX complete 3in1
    Christophe Godart
    This is the complete REX package. It consists of the lite, pro and ULTRA version.  Perfect for beginners and intermediates. REX complete is 100% non repaint. The strategy is based on a mix of different strategies, statistics, including pivot points, oscillators and patterns.  As the trading idea consists of a variety of some classic indicators like Momentum, Williams Percent Range, CCI, Force Index, WPR, DeMarker, CCI, RSI and Stochastic, it is clear that the fundamental indicators have being u
    Benefit EA
    Vsevolod Merzlov
    Benefit EA is a non-indicative flexible grid adviser with special entry points that provide a statistical advantage, revealed through the mathematical modeling of market patterns. The EA does not use stop loss. All trades are closed by take profit or trailing stop. It is possible to plan the lot increments. The "Time Filter" function is set according to the internal time of the terminal as per the displayed time of the instrument's server, not the operating system (can match). This function allo
    VR Cub
    Vladimir Pastushak
    VR Cub 은 고품질 진입점을 얻는 지표입니다. 이 지표는 수학적 계산을 용이하게 하고 포지션 진입점 검색을 단순화하기 위해 개발되었습니다. 지표가 작성된 거래 전략은 수년 동안 그 효율성을 입증해 왔습니다. 거래 전략의 단순성은 초보 거래자라도 성공적으로 거래할 수 있다는 큰 장점입니다. VR Cub은 포지션 개시 지점과 이익 실현 및 손절매 목표 수준을 계산하여 효율성과 사용 편의성을 크게 높입니다. 간단한 거래 규칙을 이해하려면 아래 전략을 사용한 거래 스크린샷을 살펴보세요. 설정, 세트 파일, 데모 버전, 지침, 문제 해결 등은 다음에서 얻을 수 있습니다. [블로그] 다음에서 리뷰를 읽거나 작성할 수 있습니다. [링크] 버전 [MetaTrader 5] 진입점 계산 규칙 포지션 개설 진입점을 계산하려면 VR Cub 도구를 마지막 최고점에서 마지막 최저점까지 늘려야 합니다. 첫 번째 지점이 두 번째 지점보다 빠른 경우, 거래자는 막대가 중간선 위에서 마감될 때까지 기다립니다
    GMMA Trade X is an EA based on GMMA. GMMA parameters such as MovingAveragePeriod1-24, MovingAverageMAShift1-24, MovingAverageShift1-24 and CandlestickShift1-24 can be adjusted. GMMA Trade X applies BTN TECHNOLOGY's state-of-the-art intelligent technology to help you create optimal results for your trades. May your dreams come true through GMMA Trade X. Good luck. = == == Inquiries = == == E-Mail:support@btntechfx.com
    Gioteen Volatility Index (GVI)   - your ultimate solution to overcoming market unpredictability and maximizing trading opportunities. This revolutionary indicator helps you in lowering your losing trades due to choppy market movements. The GVI is designed to measure market volatility, providing you with valuable insights to identify the most favorable trading prospects. Its intuitive interface consists of a dynamic red line representing the volatility index, accompanied by blue line that indicat
    The basis of the strategy is the identification of quick corrective movements between the crosses of a working currency pair or metal. At the moment of differences in prices of trading instruments, the adviser analyzes the possible direction of price movement on a working instrument and starts work. Each position has a stop loss and take profit. A unique position tracking algorithm allows you to control the superiority of profit over loss. The adviser does not use dangerous trading methods.
    | Fully-automated Smart Money Concept (ICT) inspired trading solution with multi-strategy capabilities | Built by a grid trader >> for grid traders.  This is MT4 version, click  here  for  Blue CARA MT5  (settings and logics are same in both versions)     Real monitoring signal  -->  Cara Gold Intro Blue CARA EA   ('CARA') - short for  C omprehensive  A lgorithmic R esponsive A dvisor is a next-gen  multi-currency    multi-timeframe  EA base on the widely known (and perhapse most popular) Inn
    Marauder
    Andrey Kolmogorov
    4.18 (28)
    Scalper uses the model of a quantum set of algorithms and can work on any financial instruments. Due to the optimal number of parameters necessary for optimization, you can create unique trading strategies based on quantum models. Signals:   https://www.mql5.com/en/signals/author/old_padre New sets are in the "Comments" section comments #504-509. Time settings #33 and 245. Key Advantages The EA does not use Martingale; All orders are opened with a strictly fixed Stop Loss; The minimum starting d
    Dynamic Forex28 Navigator
    Bernhard Schweigert
    4.43 (7)
    Dynamic Forex28 Navigator - 차세대 외환 거래 도구. 현재 49% 할인. Dynamic Forex28 Navigator는 오랫동안 인기 있는 지표의 진화형으로, 세 가지의 힘을 하나로 결합했습니다. 고급 통화 Strength28 지표(695개 리뷰) + 고급 통화 IMPULSE with ALERT(520개 리뷰) + CS28 콤보 신호(보너스). 지표에 대한 자세한 정보 https://www.mql5.com/en/blogs/post/758844 차세대 Strength 지표는 무엇을 제공합니까?  원래 지표에서 좋아했던 모든 것이 새로운 기능과 더 높은 정확도로 강화되었습니다. 주요 기능: 독점적인 통화 Strength 공식.  모든 시간대에 걸쳐 부드럽고 정확한 강도선. 추세와 정확한 진입을 식별하는 데 이상적입니다. 역동적인 시장 피보나치 수준(시장 피보나치).  이 지표에만 있는 고유한 기능. 가격 차트가 아닌 통화 강도에 피보나치가 적용됩니다.
    Santa Scalping
    Morten Kruse
    2.84 (19)
    Santa Scalping is a fully automated Expert Advisor with no use of martingale. Night scalping strategy. The SMA indicator filter are used for entries. This EA can be run from very small accounts. As small as 50 EUR. General Recommendations The minimum deposit is 50 USD,  default settings reccomend for eurusd m5 gmt +2 . Please use max spread 10 if you will not have orders change it to -1. Use a broker with good execution and with a spread of 2-5 points. A very fast VPS is required, preferably w
    The robot uses the trading strategy of breaking the lines of the Bollinger Bands indicator. The essence of this strategy lies in the constant analysis of the indicator lines and the search for the most effective breakout points for its lines. When the price breaks through the indicator line in one of the directions, the robot opens a trade in that direction and starts to follow it. But the robot does not open trades every time the indicator lines are broken, but only in those places where it co
    GoldenTrend
    Aliaksandr Sych
    GoldenTrend — a next-generation high-frequency scalping Expert Advisor designed to extract profit from the smallest market movements. Utilizing advanced algorithms for price action and volume analysis, it opens dozens of highly accurate trades daily with minimal risk. Why GoldenTrend? Монитор Ultra-Fast Trades : Captures profit from 5–15 pip movements. Ideal for ECN accounts with low spreads. Adaptive Strategy : Automatically adjusts to current market volatility and dynamically shifts tradi
    PriceA GOLD
    Muhammad Asyraf Bin Mohamad
    Using common price action. Trade base on selected hour. Recommended for GOLD but it can be run and test for other instruments. Auto cutloss & counter trade if price action failed. Auto lot calculate after loss. (Trade that open by EA with same magic number). Lot calculate based on loss & target profit in ($). Able to set total counter trade. (Recommended 3x) Counter trade will be reset before next signal. NOTE: Can refer  https://www.mql5.com/en/signals/2057996 https://www.mql5.com/en/signals/2
    MACD Divergence
    Sergey Deev
    2.5 (2)
    The indicator detects divergence signals - the divergences between the price peaks and the MACD oscillator values. The signals are displayed as arrows in the additional window and are maintained by the messages in a pop-up window, e-mails and push-notifications. The conditions which formed the signal are displayed by lines on the chart and in the indicator window. Indicator Parameters MacdFast - fast MACD line period MacdSlow - slow MACD line period MacdSignal - MACD signal line period MacdPric
    PairsTrading
    Evgenii Kuznetsov
    3.67 (9)
    The EA identifies divergences in two correlated currency pairs and trades in the direction where they converge back. Working timeframe: M30 Input parameters MagicNumber - identification number for the EA. OrdersComment - comment to order, automatic if an empty value is set. Lots - lot size. DepoPer001Lot - automatic lot calculation (specify the balance per 0.01 lot) (if 0, the value from 'Lots' parameter is used). TimeFrame - working timeframe. Symbol #2 - correlated currency. Symbol #2 reverse
    SPECIAL INTRODUCTORY PRICE!! MACD Momentum Pro is a professional, fully-customisable Expert Advisor that uses closed-bar MACD crossovers, confirms trend with HMA/WMA, and filters with ADX . It’s simple to run in the MetaTrader 4 Strategy Tester, so you can backtest, optimise, and find parameters that suit any symbol and timeframe. Packed with features ATR-based SL & TP – Adapts to volatility; no more one-size-fits-all levels. Currency or % risk – Set a fixed cash amount or a percent; lots auto-c
    Night Trader EURUSD
    Ugur Oezcan
    4.21 (29)
    The EA can trade multiple currencies. Please check our signals ( https://www.mql5.com/en/users/ugur-edin/seller ) for detailed information. No grid or martingale! No manual configuration or adjustment needed! Every trade is protected by stop loss. This Expert Advisor only trades for a short time frame at night, during the ending of the New York session. It uses low volatility moments and enters trades based on indicators. It then manages those trades with dynamic stop losses and take profits als
    PABT Pattern Indicator - it's classical system one of the signal patterns. Indicator logic - the Hi & Lo of the bar is fully within the range of the preceding bar, look to trade them as pullback in trend. In the way if indicator found PABT pattern it's drawing two lines and arrow what showing trend way.  - First line - it's entry point and drawing at: 1. On the high of signal bar or on middle of the signal bar (depending from indicator mode) for buy; 2. On the low of signal bar or on middle of t
    How the EA works (simple explanation) Trades on   M5   timeframe Uses   H1 timeframe   to analyze global market context Analyzes   2 or 3 timeframes simultaneously On each timeframe: Checks price position relative to one or two Moving Averages Evaluates MA angle and distance between price and MA Entry logic is based on   trend + volatility conditions , not on random signals The full algorithm is illustrated in the screenshots. Recommended usage Symbol:   EURUSD Timeframe:   M5 Trading
    Forex Gump Trend is a universal indicator for highly effective determination of the trend direction. If you identify the trend correctly, this is 95% of trading success, because you will be able to open trades in the direction of the price movement and benefit from it. The Forex Gump Trend indicator helps traders with a high degree of efficiency to determine the current trend direction, as well as trend reversal points. The direction of the trend is shown by colored lines on the chart, and the
    Atlon
    Roman Kucher
    Signal complex Atlon is a ready-made trading system that sends signals in the form of arrows to e-mail and push notifications to your phone. Atlon also displays ready-made TP levels in the form of red squares. The system works on any chart (currency pairs, stocks, cryptocurrencies, metals, oil). Timeframe H1. The system does not redraw and the arrows do not disappear anywhere. The set includes ready-made settings that must be loaded before installing on the chart. Download settings System parame
    H4 GBPUSD Trend Scalper is a trend signal scalper The EA trades according to the trend strategy using original built-in indicator for opening and closing orders. The external inputs for limiting trading on Fridays and Mondays are available. The purpose of the strategy is to use the current trend with the most benefit. According to the results of testing and working on demo and real accounts, the best results achieved by using the Н4 timeframe on the GBP/USD pair Works on MetaTrader 4 Build 971+
    This indicator is another variant of the famous powerful indicator Fibonacci-SS https://www.mql5.com/en/market/product/10136 but has different behaviour in placing Pending Order and TP Line. Automatically places Fibonacci retracement lines from the last highest and lowest visible bars on the chart with: An auto Pending Order (Buy/Sell). Taking Profit 1, Taking Profit 2 is pivot point and Taking Profit 3 for extended reward opportunity. The best risk and reward ratio. Simple and powerful indicat
    Ichimoku 3D
    Anton Karabeinikov
    Ichimoku 3D This Expert Advisor is based on the Ichimoku indicator using the principle of 3 Elder screens. There are 4 types of opening trades in this Expert Advisor: 1 is when there is the same buy or sell signal on 3 timeframes 2-This is when 2 timeframes have the same buy signal and 1 timeframe has the same sell signal or vice versa 3-This is when 1 timeframe is a buy signal and 2 timeframe is a sell signal or vice versa 4-This is when 1 timeframe signal to buy on the average timeframe
    Ict Gold Scalper
    Alex Amuyunzu Raymond
    5 (1)
    ICTVALID EA – Smart Money Concepts Automated Trading The ICTVALID EA is a professional trading system built on Smart Money Concepts (ICT methodology) . It automatically detects and trades institutional setups, allowing you to follow market structure with precision and consistency.  Key Features Dual Trading Modes – Choose between Scalping (short-term precision entries) or Swing Trading (longer-term trends). Smart Money Logic – Incorporates Change of Character (CHoCH), Break of Structure (BoS),
    Desbot
    Luke Joel Desmaris
    Join our Newsletter to also get a copy of our Optimization Settings: https://desbot.ai/#Newsletter  Input Parameters Below are all the input options (aka: Parameters) for Desbot and how to use them. You can find the best Parameters through optimization. RiskPercentage: Enter the number that represents the percent of your account balance you want Desbot to risk per trade. For example, entering 1.5 would risk 1.5% of your Account Balance. SLTicks: Enter the number of ticks you want for your stop
    이 제품의 구매자들이 또한 구매함
    Neuro Poseidon MT4
    Daria Rezueva
    5 (12)
    Neuro Poseidon is a new indicator by Daria Rezueva. It combines precise trading signals with adaptive TP/SL levels - creating best possible trades as a result! Message me and get  Neuro Poseidon Assistant  as a gift to automize your trading process! What makes it stand out? 1. Proven profitability on all assets and timeframes 2. Only confirmed BUY and SELL signals present on the chart 3. Adaptive TP & SL levels generated by the software for each trade 4. Easy to understand - suitable for all
    Scalper Inside PRO
    Alexey Minkov
    4.74 (68)
    Scalper Inside PRO Scalper Inside PRO is an intraday trend and scalping indicator for MetaTrader 4 that uses an exclusive algorithm to quickly detect market direction and key target levels. It automatically calculates entry, exit and multiple profit targets, and shows detailed performance statistics so you can see how different instruments and strategies performed. This helps you choose the most suitable trading instruments for the current market conditions. Additionally, you can easily integrat
    Trend Lines PRO
    Roman Podpora
    5 (1)
    트렌드 라인즈 프로       이 지표는 시장이 실제로 어떤 방향으로 전환되는지 파악하는 데 도움이 됩니다. 실제 추세 반전 지점과 주요 시장 참여자들이 다시 진입하는 지점을 보여줍니다. 보시다시피       BOS 라인       복잡한 설정이나 불필요한 노이즈 없이 더 높은 시간대의 추세 변화와 주요 레벨을 확인할 수 있습니다. 신호는 차트에 다시 그려지지 않고 캔들이 마감된 후에도 계속 표시됩니다. VERSION MT 5   -   RFI LEVELS PRO   표시기   와 결합할 때 최대 잠재력을 발휘합니다. 지표가 보여주는 내용: 실제 변화       추세(BOS 라인) 한 번 신호가 나타나면 그 신호는 계속 유효합니다! 이는 신호를 발생시킨 후 변경될 수 있는 리페인팅 방식의 지표와 중요한 차이점입니다. 리페인팅 방식의 지표는 잠재적으로 자금 손실로 이어질 수 있습니다. 이제 더욱 높은 확률과 정확도로 시장에 진입할 수 있습니다. 또한 화살표가 나타난 후 목표가(익절)
    이 지표는 실제 거래에 완벽한 자동 파동 분석 지표입니다! 사례... 참고:   웨이브 그레이딩에 서양식 이름을 사용하는 데 익숙하지 않습니다. Tang Lun(Tang Zhong Shuo Zen)의 명명 규칙의 영향으로 기본 웨이브를   펜   으로 명명하고 2차 웨이브 밴드를   세그먼트   로 명명했습니다. 동시에, 세그먼트에는 추세 방향이 있습니다.   주요 추세 세그먼트에는   이름이 지정되지만(이 이름 지정 방법은 향후 노트에서 사용됩니다. 먼저 말씀드리겠습니다.) 알고리즘은 굴곡 이론과 거의 관련이 없으므로 그렇게 해서는 안 됩니다. 이는 나의 시장 분석을   통해 요약된 끊임없이 변화하고 복잡한 운영 규칙을   반영합니다. 밴드는 더 이상 사람마다 다르지 않도록 표준화되고 정의되었습니다. 인위적인 간섭의 드로잉 방법은 시장 진입을 엄격하게 분석하는 데 핵심적인 역할을 합니다. 이 지표를 사용하는 것은 거래 인터페이스의 미학을 개선하고 원래의 K-line 거래를
    RFI levels PRO
    Roman Podpora
    5 (1)
    이 지표는 추세 반전 지점과 가격 반등 영역을 정확하게 보여줍니다.       주요 투자자들   . 새로운 트렌드가 형성되는 곳을 파악하고 최대한 정확하게 의사결정을 내리며 모든 거래를 완벽하게 통제합니다. TREND LINES PRO   지표와 함께 사용할 때 최대의 잠재력을 발휘합니다.  VERSION MT5 지표가 보여주는 내용: 새로운 추세의 시작 시 활성화되는 반전 구조 및 반전 수준. 최소한의 위험 대비 수익률을 갖는 이익 실현   (TAKE PROFIT)   및   손절매(STOP LOSS)   레벨 표시       RR 1:2   . 지능형 손실 감소 로직이 적용된 손절매 기능. 지정된 지표에서 두 가지 추세 유형에 대한 반전 패턴을 표시합니다. 지표: 트렌드를 따라   트렌드 라인 프로   (글로벌 트렌드 변화) 트렌드 프로   (빠른 트렌드 변화) 간단하고 효과적입니다       스캐너       실시간 추세 (신규). 다중 시간 프레임 도구 필터링. 표시하다  
    MTF Supply Demand Zones
    Georgios Kalomoiropoulos
    4.82 (22)
    자동화된 수요 및 공급 구역의 차세대. 모든 차트에서 작동하는 새롭고 혁신적인 알고리즘. 모든 구역은 시장의 가격 움직임에 따라 동적으로 생성됩니다. 두 가지 유형의 경고 --> 1)가격이 영역에 도달할 때 2)새로운 영역이 형성될 때 당신은 더 이상 쓸모없는 지표를 얻을 수 없습니다. 입증된 결과로 완벽한 거래 전략을 얻을 수 있습니다.     새로운 기능:     가격이 공급/수요 영역에 도달하면 경고     새로운 공급/수요 구역이 생성되면 알림     푸시 알림 알림     핍의 영역 너비 레이블     기동특무부대에 한 번 더 시간이 주어집니다. 따라서 현재보다 위의 2개의 시간 프레임 대신 현재보다 높은 3개의 시간 프레임을 볼 수 있습니다.     Alerts/Zones/MTF 기능을 활성화/비활성화하는 버튼 당신이 얻는 이점:     거래에서 감정을 제거하십시오.     거래 항목을 객관화하십시오.     높은 확률 설정을 사용하여 수익
    Entry Points Pro
    Yury Orlov
    4.59 (174)
    다시 색을 칠하지 않고 거래에 진입할 수 있는 정확한 신호를 제공하는 MT4용 지표입니다. 외환, 암호화폐, 금속, 주식, 지수 등 모든 금융 자산에 적용할 수 있습니다. 매우 정확한 추정값을 제공하고 매수와 매도의 가장 좋은 시점을 알려줍니다. 하나의 시그널로 수익을 내는 지표의 예와 함께 비디오 (6:22)시청하십시오! 대부분의 거래자는 Entry Points Pro 지표의 도움으로 첫 거래 주 동안 트레이딩 결과를 개선합니다. 저희의   Telegram Group 을 구독하세요! Entry Points Pro 지표의 좋은점. 재도색이 없는 진입 신호 신호가 나타나고 확인되면(시그널 캔들이 완성된 경우) 신호는 더 이상 사라지지 않습니다. 여타 보조지표의 경우 신호를 표시한 다음 제거되기 때문에 큰 재정적 손실로 이어집니다. 오류 없는 거래 게시 알고리즘을 통해 트레이드(진입 또는 청산)를 할 이상적인 순간을 찾을 수 있으며, 이를 통해 이를 사용하는 모든 거래자의 성공률이
    MetaBands M4
    Vahidreza Heidar Gholami
    3.5 (6)
    MetaBands uses powerful and unique algorithms to draw channels and detect trends so that it can provide traders with potential points for entering and exiting trades. It’s a channel indicator plus a powerful trend indicator. It includes different types of channels which can be merged to create new channels simply by using the input parameters. MetaBands uses all types of alerts to notify users about market events. Features Supports most of the channel algorithms Powerful trend detection algorith
    M30/H1/H4 스윙 버전 출시 큰 움직임을 잡고 싶으신가요? Gold Signal Swing Pro (M30/H1/H4). 목표: 거래당 $20-$80+. https://www.mql5.com/en/market/product/177643 KURAMA GOLD SIGNAL PRO (MT4) — 7층 필터, 자동 TP/SL, 품질 점수를 탑재한 XAUUSD 완벽 트레이딩 시스템 리페인트 없음. 리드로우 없음. 지연 없음. 모든 신호는 영구적입니다. 보이는 것이 그대로입니다. 보너스: 영구 라이선스 구매자에게 AI Zone Radar ($59 상당) + 전체 PDF 매뉴얼을 무료 제공. 구매 후 메시지를 보내주세요. AI Zone Radar: https://www.mql5.com/en/market/product/175834 트레이더의 신뢰: 활발한 골드 트레이더 커뮤니티에서 이미 사용 중. 정확도와 사
    Current event:  https://c.mql5.com/1/326/A2SR2025_NoMusic.gif A. A2SR이란 무엇입니까 ?   * 선행 기술 지표입니다(재도장 없음, 지연 없음). -- 안내 : https://www.mql5.com/en/blogs/post/734748/page4#comment_16532516 -- 및 https://www.mql5.com/en/users/yohana/blog A2SR에는 지원(수요) 및 저항(공급) 수준을 결정하는 특별한 기술이 있습니다. 우리가 인터넷에서 본 일반적인 방식과 달리 A2SR은 실제 SR 수준을 결정하는 독창적인 개념을 가지고 있습니다. 원래 기술은 인터넷에서 가져온 것이 아니며 인터넷에 게시된 적도 없습니다. A2SR은 거래 스타일에 따라 SR 수준을 자동으로 선택합니다. 시간 프레임을 변경해도 SR 레벨은 그대로 유지됩니다. 사용하는 시간 프레임에서 실제 SR을 얻지 못하기 때문입니다. A2SR은 거래를
    Quant Direction
    Georgios Kalomoiropoulos
    Quant Direction 은 3D 시장 분석 도구입니다. 다양한 매개변수에 걸쳐 정확한 백분율 편차를 계산하면서 완벽하게 객관적인 알고리즘 기반 시장 분석을 제공합니다. 첨단 AI 기반 모델링 도구와 엄격한 테스트를 거쳐 개발된 이 알고리즘은 타의 추종을 불허하는 정확도로 시장을 분석합니다. 플랫폼에서 모든 통화쌍 또는 금융 상품을 분석할 수 있습니다. 단기 거래, 데이 트레이딩, 스윙 트레이딩 등 어떤 유형의 거래를 하든 Quant Direction은 최적의 선택입니다. 운영자가 되는 것의 진정한 이점 퀀트 디렉션의 진정한 장점은 감정, 눈의 피로, 과도한 분석을 완전히 배제한다는 점입니다. 더 이상 수십 개의 차트를 일일이 살펴보며 방향을 찾거나 자신의 판단에 끊임없이 의문을 품을 필요가 없습니다. 이 시스템은 8개의 시간 간격(5개월에서 수개월까지)을 밀리초 단위로 처리합니다. 특정 시점의 주요 시장 참여자를 정확하게 식별하여 항상 성공 확률이 가장 높은 방향으로 거래할
    NAM Order Blocks
    NAM TECH GROUP, CORP.
    3.67 (3)
    MT4 Multi-timeframe Order Blocks detection indicator. Features - Fully customizable on chart control panel, provides complete interaction. - Hide and show control panel wherever you want. - Detect OBs on multiple timeframes. - Select OBs quantity to display. - Different OBs user interface. - Different filters on OBs. - OB proximity alert. - ADR High and Low lines. - Notification service (Screen alerts | Push notifications). Summary Order block is a market behavior that indicates order collection
    GoldRush Trend Arrow Signal
    Kirk Lee Holloway
    5 (2)
    GoldRush 트렌드 화살표 신호 GoldRush 트렌드 화살표 신호 지표는 XAU/USD 시장에서 고속 단기 스캘핑 트레이더를 위해 설계된 정밀한 실시간 트렌드 분석을 제공합니다. 1분 시간대에 특화되어 설계된 이 도구는 명확한 진입점을 표시하는 방향성 화살표를 제공하여 스캘퍼들이 변동성이 높은 시장 환경에서도 자신 있게 거래할 수 있도록 합니다. 이 지표는 PRIMARY 및 SECONDARY 경고 화살표로 구성됩니다. PRIMARY 신호는 추세 방향의 변화를 나타내는 흰색과 검은색 방향성 화살표이며, SECONDARY 신호는 PRIMARY 화살표가 지시하는 방향을 확인하고 잠재적인 거래 진입점을 표시하는 파란색과 빨간색 화살표입니다. 참고: 추세 방향이 변경된 후 PRIMARY 경고 화살표가 단 하나만 표시될 경우, 다수의 SECONDARY 파란색/빨간색 화살표가 표시될 수 있음을 유의해야 합니다. SECONDARY 신호는 신호 기준을 충족하는 어떤 캔들 이후에도 표시
    The Propfolio Master Suite is the ultimate all-in-one analytical workstation for professional traders. Combining the power of the Beat The Market Maker (BTMM) methodology, Smart Money Concepts (SND/Liquidity), and Advanced Volume Profile, this suite replaces multiple different indicators with one optimized engine. Monitor up to 14 pairs simultaneously from a single chart, instantly identify market cycles, and seamlessly map institutional footprints with the click of a button. The Command Center
    KuKl
    IGOR KIRIANEN
    The indicator is built on a non-standard Zig Zag, it draws accumulations after which if the price leaves this zone and a test of this zone occurs, then a sound signal is given and an arrow appears - after the test candle closes.The indicator does not redraw its signals, it is very easy to use, there are only three settings 1- this is the zig zag parameter 2- this is the minimum price exit from the zone 3- this is the maximum price exit from the zone. The lower the parameter for Zig Zag, the more
    Cyclic Impulse
    Vitalyi Belyh
    차트를 구조화하고 주기적인 가격 변동을 식별하는 기술 지표입니다. 모든 차트에서 작업할 수 있습니다. 다양한 유형의 알림. 그래프 자체에도 추가 화살표가 있습니다. 역사를 재구성하지 않고, 촛불을 닫는 작업에 임한다. M5 이상에서 권장되는 TF입니다. 사용 및 구성이 쉬운 매개변수입니다. 매개변수가 다른 2개의 지표를 사용하는 경우, 다른 지표 없이 해당 지표만 사용할 수 있습니다. 2개의 입력 매개변수가 있습니다 주기성과 신호 지속 시간 이 2개의 매개변수는 차트 구조의 처리와 관련이 있습니다. Cyclicity - 역전 주기가 얼마나 자주 바뀌는지 조절하고 주기를 매끄럽게 합니다. Signal duration - 최소 숫자에서는 가격 움직임의 충격을 감지하고, 최대 숫자에서는 장기적 추세 움직임을 감지합니다.. --------------------------------
    PZ Harmonacci Patterns
    PZ TRADING SLU
    3.17 (6)
    Trade smarter, not harder: Empower your trading with Harmonacci Patterns This is arguably the most complete harmonic price formation auto-recognition indicator you can find for the MetaTrader Platform. It detects 19 different patterns, takes fibonacci projections as seriously as you do, displays the Potential Reversal Zone (PRZ) and finds suitable stop-loss and take-profit levels. [ Installation Guide | Update Guide | Troubleshooting | FAQ | All Products  ] It detects 19 different harmonic pric
    Smart Price Action Concepts
    Issam Kassas
    4.77 (13)
    이 제품은 2026년 시장에 맞게 업데이트되었으며 최신 MT5 빌드에 최적화되었습니다. 가격 업데이트 안내: Smart Price Action Concepts는 현재 $200 에 제공됩니다. 다음 30회 구매 후 가격은 $299 로 인상됩니다. 특별 혜택: 구매 후 저에게 개인 메시지를 보내시면 무료 보너스 + 선물 을 받을 수 있습니다. 먼저, 이 트레이딩 도구는 리페인트 없음, 재그리기 없음, 지연 없음의 인디케이터이므로 전문적인 트레이딩에 적합하다는 점을 강조하고 싶습니다. Online course , and manual Smart Price Action Concepts Indicator는 초보자와 경험 많은 트레이더 모두에게 매우 강력한 도구입니다. 20개 이상의 유용한 인디케이터를 하나로 결합하고, Inner Circle Trader Analysis와 Smart Money Concepts Trading Strategies 같은 고급 트레이딩 아이디어를 통합합니다. 이 인디
    Dynamic Scalper System
    Vitalyi Belyh
    5 (1)
    " Dynamic Scalper System " 지표는 추세 파동 내에서 스캘핑 방식으로 거래하도록 설계되었습니다. 주요 통화쌍 및 금에서 테스트되었으며, 다른 거래 상품과의 호환성이 가능합니다. 추가적인 가격 변동 지원을 통해 추세에 따라 단기 포지션 진입 신호를 제공합니다. 지표의 원리 큰 화살표는 추세 방향을 결정합니다. 작은 화살표 형태의 스캘핑 신호를 생성하는 알고리즘은 추세 파동 내에서 작동합니다. 빨간색 화살표는 상승 방향을, 파란색 화살표는 하락 방향을 나타냅니다. 민감한 가격 변동선은 추세 방향으로 그려지며, 작은 화살표의 신호와 함께 작용합니다. 신호는 다음과 같이 작동합니다. 적절한 시점에 선이 나타나면 진입 신호가 형성되고, 선이 있는 동안 미결제 포지션을 유지하며, 완료되면 거래를 종료합니다. 권장되는 작업 시간대는 M1~H4입니다. 화살표는 현재 캔들에 형성되며, 다음 캔들이 이미 시작되었더라도 이전 캔들의 화살표는 다시 그려지지 않습니다. 입력 매개
    Cycle Sniper
    Elmira Memish
    4.39 (36)
    Please contact us after your purchase and we will send you the complimentary indicators to complete the system Cycle Sniper is not a holy grail but when you use it in a system which is explained in the videos, you will feel the difference. If you are not willing to focus on the charts designed with Cycle Sniper and other free tools we provide, we recommend not buying this indicator. We recommend watching the videos about the indiactor and system before purchasing. Videos, settings  and descri
    GOLD Impulse with Alert
    Bernhard Schweigert
    4.67 (12)
    이 지표는 Advanced Currency IMPULSE with ALERT  +   Currency Strength Exotics  의 2가지 제품의 슈퍼 조합입니다. 그것은 모든 시간 프레임에 대해 작동하며 8개의 주요 통화와 하나의 기호에 대한 강약의 충동을 그래픽으로 보여줍니다! 이 표시기는 금, 이국적인 쌍, 상품, 지수 또는 선물과 같은 기호에 대한 통화 강도 가속을 표시하는 데 특화되어 있습니다. 금, 은, 오일, DAX, US30, MXN, TRY, CNH 등의 진정한 통화 강도 가속(충동 또는 속도)을 표시하기 위해 9번째 줄에 모든 기호를 추가할 수 있습니다. 새로운 기본 알고리즘을 기반으로 구축되어 잠재적인 거래를 훨씬 더 쉽게 식별하고 확인할 수 있습니다. 이는 통화의 강세 또는 약세가 가속되는지 여부를 그래픽으로 표시하고 가속 속도를 측정하기 때문입니다. 자동차의 속도계처럼 생각하면 됩니다. 가속화할 때 Forex 시장에서 동일한 일이 분명히 더 빠르
    Quants HL Break
    Ferhat Mutlu
    5 (2)
    LH 및 HL 브레이크아웃을 찾기 위한 순수 가격 조치에 의한 고급 계산. 그것은 당신에게 시장에서 큰 반전 포인트를 줄 것입니다.LH 및 HL 신호는 traingle 브레이크 아웃에도 사용할 수 있습니다. 브레이크 아웃이 발생하면 강한 반전을 나타냅니다. 이동 평균에 대한 좋은 필터입니다. 추세 지표와 함께 사용하는 것이 좋습니다. 지원 및 저항, 공급 수요 지표에 대한 추가 확인으로 사용할 수 있습니다. 자세한 내용은 다음 외환 스레드에서 찾을 수 있습니다. 표시기가 다시 칠해지지 않습니다. Buffers :   SetIndexBuffer ( 0 ,UpBar);      SetIndexBuffer ( 1 ,UpBar2);           SetIndexBuffer ( 2 ,DnBar);      SetIndexBuffer ( 3 ,DnBar2);           SetIndexBuffer ( 4 ,UpBarTop);      SetIndexBuffer ( 5 ,UpBa
    Miraculous Indicator – Gann Square of Nine 기반 100% 비리페인트 Forex 및 바이너리 도구 이 영상은 Miraculous Indicator 를 소개합니다. 이 지표는 Forex 및 바이너리 옵션 트레이더를 위해 특별히 개발된 매우 정확하고 강력한 트레이딩 도구입니다. 이 지표가 독특한 이유는 전설적인 **Gann Square of Nine(Gann 9의 사각형)**과 **Gann's Law of Vibration(Gann 진동의 법칙)**에 기반을 두고 있기 때문입니다. 이는 현대 트레이딩에서 가장 정밀한 예측 도구 중 하나로 손꼽힙니다. Miraculous Indicator는 완전히 비리페인트(non-repaint) 됩니다. 즉, 캔들이 마감된 후에도 신호가 변경되거나 사라지지 않습니다. 보이는 것이 곧 결과입니다. 이는 트레이더가 자신감을 가지고 거래에 진입하고 청산할 수 있는 신뢰할 수 있고 일관된 기반을 제공합니다. 주요 특징: Gann
    Quantum Breakout Indicator PRO
    Bogdan Ion Puscasu
    4.96 (26)
    소개       Quantum Breakout PRO   , 브레이크아웃 존 거래 방식을 변화시키는 획기적인 MQL5 지표! 13년 이상의 거래 경험을 가진 숙련된 트레이더 팀이 개발한   Quantum Breakout PRO는   혁신적이고 역동적인 브레이크아웃 영역 전략으로 거래 여정을 새로운 차원으로 끌어올리도록 설계되었습니다. Quantum Breakout Indicator는 5개의 이익 목표 영역이 있는 브레이크아웃 영역의 신호 화살표와 브레이크아웃 상자를 기반으로 한 손절 제안을 제공합니다. 초보자 거래자와 전문 거래자 모두에게 적합합니다. Quantum EA 채널:       여기를 클릭하세요 MT5 버전 :   여기를 클릭하세요 중요한! 구매 후 설치 매뉴얼을 받으려면 개인 메시지를 보내주십시오. 추천: 기간: M15 통화쌍: GBPJPY, EURJPY, USDJPY,NZDUSD, XAUUSD 계정 유형: 스프레드가 매우 낮은 ECN, Raw 또는 Razo
    CountSig
    Yin Zhou Luo
    一款信号统计指标(MT4)——实现基于当前图表周期下的单线MA转向和双线MA金叉/死叉统计 . 转向定义:前一K向下或走平,当前K向上,视为转向向上;反之,转向向下。 金死叉定义:前一K快线在慢线下方,当前K快线在慢线上方,为金叉;反之,死叉。 参数及使用说明: 1、可指定统计K线数。 2、可指定4个不同的日内时间段,格式如"03:00-07:59",4个时间段可交叉任意输入。 3、可配置ABC三个浮盈区间段点值。如:分界区间统计小点值设为500,即当某转向信 号出现后到下一反向信号止浮盈<=此点值,计入A区间; 若大于此点值<大分界点值时,计入B区间;若大于“大分界点值”计入C区间。 4、最大/最小浮盈统计。显示所有统计区间内的最大浮盈点值和最小浮盈点值(亏损点值)。 5、输出完整信号,按信号出现顺序排列,如“ACCBCA”之类。 6、综合预测。使用概率、周期、趋势、马尔可夫链等综合概算输出预测该信号出现的归类概率值。 7、加载指定MA线。在当前图表自动载入相应设置的MA线。 8、自适应列宽。以完整显示统计信号数。 9、用法:点击相应统计按钮即输出相应的统计表格.
    Precautions for subscribing to indicator This indicator only supports the computer version of MT4 Does not support MT5, mobile phones, tablets The indicator only shows the day's entry arrow The previous history arrow will not be displayed (Live broadcast is for demonstration) The indicator is a trading aid Is not a EA automatic trading No copy trading function The indicator only indicates the entry position No exit (target profit)  The entry stop loss point is set at 30-50 PIPS Or the front hi
    Apex Edge No Repaint MT4용 전문가용 리페인팅 없는 트레이딩 지표 Apex Edge No Repaint는 화살표 리페인팅 현상 없이 명확한 신호를 원하는 진지한 외환 및 암호화폐 트레이더를 위해 설계된 프리미엄급의 깔끔하고 신뢰할 수 있는 트레이딩 도구입니다. 주요 기능: 100% 리페인트 없음 – 신호는 차트에 나타난 후 고정됩니다. 듀얼 신호 시스템: 초기 기회를 위한 RAW 신호와 높은 확률의 확정 진입을 위한 CONF 신호 간편한 원클릭 토글 버튼: RAW 켜기/끄기 및 CONF 켜기/끄기 추세, 강도 백분율 및 신호 상태를 표시하는 전문적인 실시간 대시보드 즉시 알림: 팝업, 소리 및 이메일 알림 모든 CONF 신호에 TP1, TP2 및 손절매 레벨 자동 표시 즉시 시각적 명확성을 위한 깔끔한 색상 코드 화살표: 연두색 → CONF 매수 빨간색 → CONF 매도 청록색 → RAW 매수 자홍색 → RAW 매도 모든 시간대 및 모든 종목에서 작동 장점:
    Grabber System
    Ihor Otkydach
    5 (2)
    탁월한 기술적 지표인 Grabber를 소개합니다. 이 도구는 즉시 사용 가능한 “올인원(All-Inclusive)” 트레이딩 전략으로 작동합니다. 하나의 코드 안에 강력한 시장 기술 분석 도구, 매매 신호(화살표), 알림 기능, 푸시 알림이 통합되어 있습니다. 이 인디케이터를 구매하신 모든 분들께는 다음의 항목이   무료로   제공됩니다: Grabber 유틸리티: 오픈 포지션을 자동으로 관리하는 도구 단계별 영상 매뉴얼: 설치, 설정, 그리고 실제 거래 방법을 안내 맞춤형 세트 파일: 인디케이터를 빠르게 자동 설정하여 최고의 성과를 낼 수 있도록 도와줍니다 다른 전략은 이제 잊어버리세요! Grabber만이 여러분을 새로운 트레이딩의 정점으로 이끌어 줄 수 있습니다. Grabber 전략의 주요 특징: 거래 시간 프레임: M5부터 H4까지 거래 가능한 자산: 어떤 자산이든 사용 가능하지만, 제가 직접 테스트한 종목들을 추천드립니다 (GBPUSD, GBPCAD, GBPCHF, AUDCAD
    이 인디케이터는 엘리어트 파동 이론과 두 가지 방식으로 작동합니다: 자동 작동: 이 모드에서는 인디케이터가 엘리어트 파동 이론에 따라 차트 상의 모든 5개의 모티브 웨이브를 자동으로 감지하고 예측 및 잠재적인 반전 지역을 제공합니다. 또한 중요한 개발 사항을 트레이더에게 알릴 수 있는 경보 및 푸시 메시지를 생성할 수 있는 능력을 갖추고 있습니다. 이 자동 기능은 엘리어트 파동 패턴의 식별과 분석 프로세스를 간소화합니다. 수동 작동: 이 옵션은 엘리어트 파동 이론을 수동으로 다루고 싶은 트레이더를 위해 설계되었습니다. 이를 통해 사용자는 아홉 가지 다른 등급을 사용하여 웨이브를 그릴 수 있습니다. 각 등급은 나타난 후에 차트에 그려진 라인을 조정하여 개별적으로 정의할 수 있습니다. 이 기능은 웨이브를 수동으로 그리는 프로세스를 간소화하며 더 효율적으로 만들어 줍니다. 중요한 점으로 모든 그림 데이터가 미래 참조를 위해 플랫폼 데이터 폴더에 저장된다는 것을 기억해야 합니다. 파라미터:
    Introduction to Fractal Pattern Scanner Fractal Indicator refers to the technical indicator that makes use of the fractal geometry found in the financial market. Fractal Pattern Scanner is the advanced Fractal Indicator that brings the latest trading technology after the extensive research and development work in the fractal geometry in the financial market. The most important feature in Fractal Pattern Scanner is the ability to measure the turning point probability as well as the trend probabi
    제작자의 제품 더 보기
    Pan Bands of Asymmetric Volatility - A Research-Driven Volatility Framework and Market Regime Switching Signal Author : Heping Pan Swingtum Prediction Pty Ltd, Australia panhepingism@gmail.com 28/12/2025   Des cription Move beyond conventional indicators. The Pan Bands of Asymmetric Volatility suite is not merely another technical tool—it is a trading application built upon a peer-reviewed, academically published financial research model [Heping Pan, (2012), "Yin-yang volatility in scale spac
    This indicator PanBands.ex5 is the MQL5 version of the original MQL4 indicator PanBands.ex4 for Pan Bands of Volatility. For detailed Description and Screenshot of this Indicator, please visit   https://www.mql5.com/en/market/product/160068 The logic of calculation and function of these two versions are the same. Here still we provide a brief description as follows: ------------------------------------------------------------------------------------------ Des cription Move beyond convention

    This indicator PanBandsRegime.ex5 is the MQL5 version of the original MQL4 version PanBandsRegime.ex4 for market regime switching based on the complex crossings of two Pan Bands of Asymmetric Volatility (PanBands.ex4 for MT4  and PanBands.ex5 for MT5). The description of PanBandsRegime.ex4 for MT4 is available here: https://www.mql5.com/en/market/product/160340 For a good understanding of Pan Bands of Asymmetric Volatility, read https://www.mql5.com/en/market/product/160068&nbsp ; (PanBands.ex
    필터:
    리뷰 없음
    리뷰 답변